
Rationale and Objectives
To evaluate variability in the clinical assessment of breast images, we evaluated scoring behavior of radiologists in a retrospective reader study combining x-ray mammography (XRM) and three-dimensional automated breast ultrasound (ABUS) for breast cancer detection in women with dense breasts.
Methods
The study involved 17 breast radiologists in a sequential study design with readers first interpreting XRM-alone followed by an interpretation of combined XRM + ABUS. Each interpretation included a forced Breast Imaging Reporting and Data System scale and a likelihood that the woman had breast cancer. The analysis included 164 asymptomatic patients, including 31 breast cancer patients, with dense breasts and a negative screening XRM. Of interest were interreader scoring variability for XRM-alone, XRM + ABUS, and the sequential effect. In addition, a simulated double reading by pairs of readers of XRM + ABUS was investigated. Performance analysis included receiver operating characteristic analysis, percentile analysis, and κ statistics. Bootstrapping was used to determine statistical significance.
Results
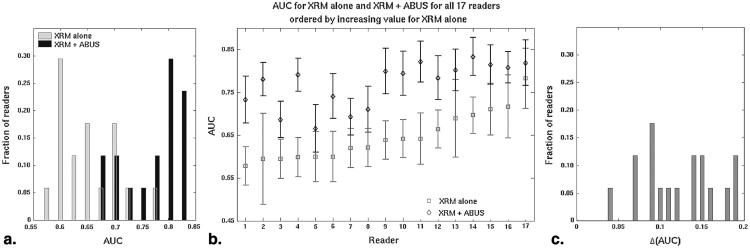
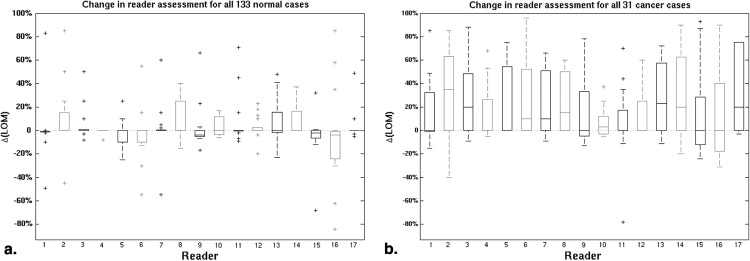
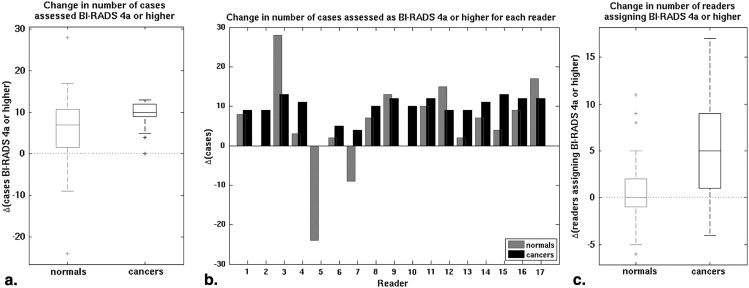
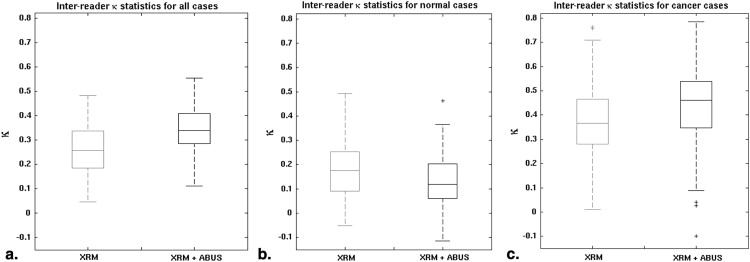
The median change in area under the receiver operating characteristic curve after ABUS interpretation was 0.12 (range 0.04–0.19). Reader agreement was fair with the median interreader κ being 0.26 (0.05–0.48) for XRM-alone and 0.34 (0.11–0.55) for XRM + ABUS (95% confidence interval for the difference in κ, 0.06–0.11). Simulated double reading of XRM + ABUS demonstrated tradeoffs in sensitivity and specificity, but conservative simulated double reading resulted in a significant improvement in both sensitivity (16.7%) and specificity (7.6%) with respect to XRM-alone.
Conclusion
A modest, but statistically significant, increase in interreader agreement was observed after interpretation of ABUS.
Breast imaging methods for the early detection and diagnosis of cancer continue to evolve. Mammography, as the primary screening modality, allows for the early detection of nonpalpable breast cancers and has been shown to reduce breast cancer mortality . Although the overall sensitivity of mammography is 70% to 90%, the sensitivity can range from 30% to 98% depending on whether the breast consists mostly of extremely dense glandular tissue or contains mostly fat . Tumors diagnosed in women with dense breast tissue are currently usually larger and of higher histological grade with a greater likelihood of lymph node metastases, resulting in poorer prognosis . Moreover, the presence of dense breast tissue is associated with an elevated risk for breast cancer with the relative risk more than 5 times greater for women with the most dense breast tissue than for women without dense breast tissue . Nearly 40% of women in the United States have dense breasts and the poor sensitivity of mammography in women with Breast Imaging Reporting and Data System (BI-RADS) composition/density 3 or 4 has resulted in several states passing legislation requiring women be informed of the breast density and the possible need for additional screening with modalities other than mammography .
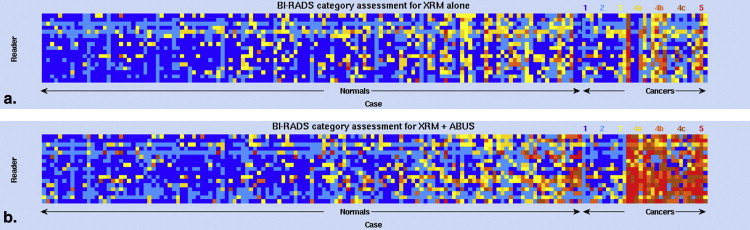
Based on initial clinical studies using conventional ultrasound , the addition of automated breast ultrasound (ABUS) to screening x-ray mammography (XRM) is expected to yield a benefit to patients with dense breast tissue by providing earlier detection of breast cancers that might be missed by mammography. Hence, a multireader multicase (MRMC) clinical reader study was conducted evaluating the use of ABUS in conjunction with XRM in the breast cancer screening of women with dense breasts and a negative screening XRM (tumor BI-RADS assessment category 1 or 2) . That study involved both semicontinuous reader scoring data (the likelihood of malignancy) and two-category data (cancer versus noncancer) . The reader-assigned likelihoods of malignancy served as the decision variables in an MRMC receiver operating characteristic (ROC) analysis . The BI-RADS assessment categories were used to determine sensitivity and specificity given a predetermined cutoff for the distinction between patients with and without cancer. A statistically significant increase in the overall area under the ROC curve was obtained as well as a statistically significant increase in sensitivity, while a slight decline in specificity failed to reach statistical significance ( Table 1 ) (and Giger et al, manuscript in preparation). In contrast, the work presented here focused more on individual readers and cases and analyzed (1) the reader scoring behavior of the participating radiologists, (2) agreement (or lack thereof) between readers, (3) the impact of the consecutive reading with two modalities (XRM and ABUS in this instance), and (4) the potential of improvement from double reading by pairs of readers. The latter was done through simulations using the reader data. It is important to note that it was not our intent to critique individual radiologists or to determine which radiologist was “better.”
Table 1
Summary of Multicase Multireader Analysis Results Obtained in That Are Relevant to the Work Presented Here: AUC Values (with Standard Error in Parentheses), Sensitivity, and Specificity
XRM-Alone XRM + ABUS_P_ Value AUC 0.65 (0.033) 0.77 (0.035) <.001 Overall sensitivity ∗ 27.1% 57.7% † <.001 Overall specificity ∗ 88.1% 84.0% ‡ .86
ABUS, three-dimensional automated breast ultrasound; AUC, area under the ROC curve; XRM, x-ray mammography.
Get Radiology Tree app to read full this article<
Get Radiology Tree app to read full this article<
Get Radiology Tree app to read full this article<
Get Radiology Tree app to read full this article<
Materials and methods
Study Design
Get Radiology Tree app to read full this article<
Get Radiology Tree app to read full this article<
Data Set
Get Radiology Tree app to read full this article<
Get Radiology Tree app to read full this article<
Readers
Get Radiology Tree app to read full this article<
Analyses
Get Radiology Tree app to read full this article<
ROC analysis
Get Radiology Tree app to read full this article<
Likelihood of malignancy
Get Radiology Tree app to read full this article<
Forced BI-RADS assessment
Get Radiology Tree app to read full this article<
Cohen κ
Get Radiology Tree app to read full this article<
“Double reading”
Get Radiology Tree app to read full this article<
Get Radiology Tree app to read full this article<
Get Radiology Tree app to read full this article<
Results
ROC Analysis
Get Radiology Tree app to read full this article<
Get Radiology Tree app to read full this article<
Likelihood of Malignancy
Get Radiology Tree app to read full this article<
Get Radiology Tree app to read full this article<
Forced BI-RADS Assessment
Get Radiology Tree app to read full this article<
Get Radiology Tree app to read full this article<
Get Radiology Tree app to read full this article<
Get Radiology Tree app to read full this article<
Cohen κ
Get Radiology Tree app to read full this article<
Get Radiology Tree app to read full this article<
Double Reading
Get Radiology Tree app to read full this article<
Table 2
Overview of Sensitivities and Specificities in A Posteriori Simulated Double Reading Approaches (by Pairs of Radiologists) for XRM + ABUS (median [95% CI]) and the Changes with Respect to Single Reading Conditions
XRM + ABUS Double Reading Change wrt XRM + ABUS Single Reading Change wrt XRM Single Reading Aggressive Sensitivity 71.0% [61.3%; 77.4%] 13.8% [11.2%; 17.3%] 44.4% [35.2%; 56.3%] Specificity 79.0% [64.7%; 90.2%] −11.6% [−12.8%; −10.5%] −16.7% [−18.2%; −13.3%] Conservative Sensitivity 48.4% [29.0%; 54.8%] −13.9% [−17.2%; −11.1%]16.7% [9.1%; 26.1%] Specificity 97.0% [95.4%; 99.3%] 11.6% [10.6%; 12.8%]7.6% [6.0%; 9.2%]
ABUS, three-dimensional automated breast ultrasound; XRM, x-ray mammography.
Get Radiology Tree app to read full this article<
Get Radiology Tree app to read full this article<
Discussion
Get Radiology Tree app to read full this article<
Get Radiology Tree app to read full this article<
Get Radiology Tree app to read full this article<
Get Radiology Tree app to read full this article<
Acknowledgments
Get Radiology Tree app to read full this article<
Get Radiology Tree app to read full this article<
Get Radiology Tree app to read full this article<
References
1. Bock K., Borisch B., Cawson J., et. al.: Effect of population-based screening on breast cancer mortality. Lancet 2011; 378: pp. 1775-1776.
2. Tabar L., Fagerberg C.J., Gad A., et. al.: Reduction in mortality from breast cancer after mass screening with mammography. Randomised trial from the Breast Cancer Screening Working Group of the Swedish National Board of Health and Welfare. Lancet 1985; 1: pp. 829-832.
3. Mandelson M.T., Oestreicher N., Porter P.L., et. al.: Breast density as a predictor of mammographic detection: comparison of interval- and screen-detected cancers. J Natl Cancer Inst 2000; 92: pp. 1081-1087.
4. Ghosh K., Brandt K.R., Sellers T.A., et. al.: Association of mammographic density with the pathology of subsequent breast cancer among postmenopausal women. Cancer Epidemiol Biomarkers Prev 2008; 17: pp. 872-879.
5. Chiu S.Y., Duffy S., Yen A.M., et. al.: Effect of baseline breast density on breast cancer incidence, stage, mortality, and screening parameters: 25-year follow-up of a Swedish mammographic screening. Cancer Epidemiol Biomarkers Prev 2010; 19: pp. 1219-1228.
6. Boyd N.F., Martin L.J., Yaffe M.J., et. al.: Mammographic density and breast cancer risk: current understanding and future prospects. Breast Cancer Res 2011; 13: pp. 223.
7. Martin L.J., Melnichouk O., Guo H., et. al.: Family history, mammographic density, and risk of breast cancer. Cancer Epidemiol Biomarkers Prev 2010; 19: pp. 456-463.
8. Boyd N.F., Guo H., Martin L.J., et. al.: Mammographic density and the risk and detection of breast cancer. N Engl J Med 2007; 356: pp. 227-236.
9. “Are You Dense Advocacy”, Are You Dense Advocacy, Inc., http://www.areyoudenseadvocacy.org/dense/ . Accessed 4/1/2013.
10. Hooley R.J., Greenberg K.L., Stackhouse R.M., et. al.: Screening US in patients with mammographically dense breasts: initial experience with Connecticut Public Act 09-41. Radiology 2012; 265: pp. 59-69.
11. Corsetti V., Houssami N., Ghirardi M., et. al.: Evidence of the effect of adjunct ultrasound screening in women with mammography-negative dense breasts: interval breast cancers at 1 year follow-up. Eur J Cancer 2011; 47: pp. 1021-1026.
12. Corsetti V., Houssami N., Ferrari A., et. al.: Breast screening with ultrasound in women with mammography-negative dense breasts: evidence on incremental cancer detection and false positives, and associated cost. Eur J Cancer 2008; 44: pp. 539-544.
13. Corsetti V., Ferrari A., Ghirardi M., et. al.: Role of ultrasonography in detecting mammographically occult breast carcinoma in women with dense breasts. Radiol Med 2006; 111: pp. 440-448.
14. Berg W.A., Blume J.D., Cormack J.B., et. al.: Combined screening with ultrasound and mammography vs mammography alone in women at elevated risk of breast cancer. JAMA 2008; 299: pp. 2151-2163.
15. Giger ML, Miller DP, Bancroft Brown J, et al. Clinical reader study examining the performance of mammography and automated breast ultrasound in breast cancer screening. 98th Assembly and Annual Meeting of Radiological Society of North America. 2012.
16. Samuelson F., Gallas B.D., Myers K.J., et. al.: The importance of ROC data. Acad Radiol 2011; 18: pp. 257-258. author reply 9–61
17. Hillis S.L., Berbaum K.S., Metz C.E.: Recent developments in the Dorfman-Berbaum-Metz procedure for multireader ROC study analysis. Acad Radiol 2008; 15: pp. 647-661.
18. Roe C.A., Metz C.E.: Dorfman-Berbaum-Metz method for statistical analysis of multireader, multimodality receiver operating characteristic data: validation with computer simulation. Acad Radiol 1997; 4: pp. 298-303.
19. Dorfman D.D., Berbaum K.S., Metz C.E.: Receiver operating characteristic rating analysis. Generalization to the population of readers and patients with the jackknife method. Invest Radiol 1992; 27: pp. 723-731.
20. Pesce L.L., Metz C.E.: Reliable and computationally efficient maximum-likelihood estimation of “proper” binormal ROC curves. Acad Radiol 2007; 14: pp. 814-829.
21. Kundel H.L., Polansky M.: Measurement of observer agreement. Radiology 2003; 228: pp. 303-308.
22. Berry C.C.: The kappa statistic. JAMA 1992; 268: pp. 2513-2514.
23. Efron B., Tibshirani R.: An Introduction to the Bootstrap.1993.Chapman & Hall
24. Gruszauskas N.P., Drukker K., Giger M.L., et. al.: Performance of breast ultrasound computer-aided diagnosis: dependence on image selection. Acad Radiol 2008; 15: pp. 1234-1245.
25. Waldmann A., Kapsimalakou S., Katalinic A., et. al.: Benefits of the quality assured double and arbitration reading of mammograms in the early diagnosis of breast cancer in symptomatic women. Eur Radiol 2012; 22: pp. 1014-1022.
26. Duijm L.E., Groenewoud J.H., Hendriks J.H., et. al.: Independent double reading of screening mammograms in The Netherlands: effect of arbitration following reader disagreements. Radiology 2004; 231: pp. 564-570.
27. Beam C.A., Sullivan D.C., Layde P.M.: Effect of human variability on independent double reading in screening mammography. Acad Radiol 1996; 3: pp. 891-897.