
Rationale and Objectives
The aim of this study was to compare average glandular dose (AGD) in two full-field digital mammography units using different anode/filter combinations.
Materials and Methods
Mammographies of 50 consecutive patients on a mammography system using a tungsten/rhodium (W/Rh) anode/filter combination were retrospectively compared to prior examinations on a different mammography unit using combinations of Molybdenum (Mo) and Rhodium (Rh). To exclude effects of increasing patient age, two prior examinations within 5 years were used. Both views of one breast were chosen for analysis. AGD was recorded as stated by each mammography unit. Accuracy of stated AGD and contrast-detail resolution were assessed using different breast phantoms.
Results
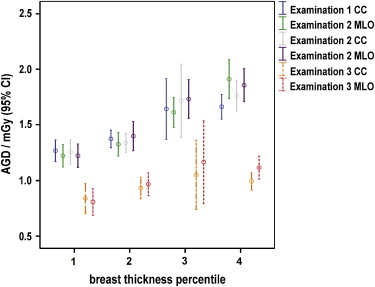
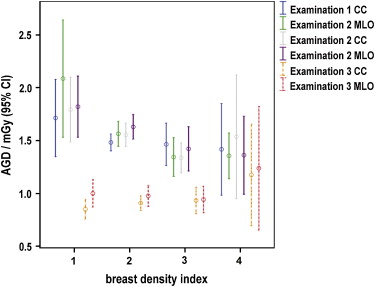
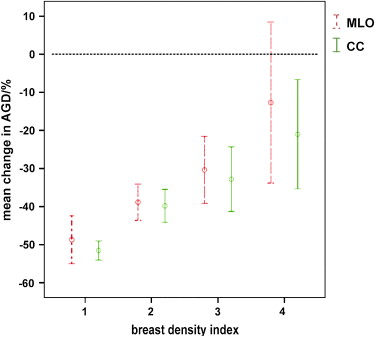
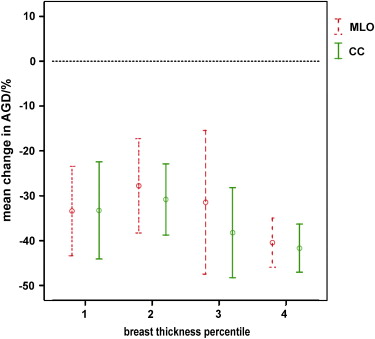
The mean AGDs from the examinations using W/Rh were 0.95 mGy and 1.01 mGy for craniocaudal (CC) and mediolateral oblique (MLO) views compared to 1.51 mGy and 1.54 mGy, respectively, using combinations of Mo and Rh ( P < .001). Relative reduction of AGD was independent of breast thickness but decreased with increasing breast density (partial correlation coefficient of 0.46, P < .005 and 0.57, P < .001, for CC and MLO views, respectively). Low-level contrast resolution was equal in both units using standard acquisition parameters.
Conclusion
In clinical mammographies, higher energy beam spectra obtained using W/Rh anode/filter combinations may significantly contribute to lowering AGD compared to Mo/Mo, Mo/Rh, and Rh/Rh in breasts that are not extremely dense.
The use of digital mammography has led to significant reductions in the average glandular dose (AGD) associated with mammography examinations . Among the advantages of digital mammography are an increased dynamic range and the ability to optimize image contrast by postprocessing techniques . In film mammography, the detector dose is determined by properties of the film and relative contrast can be optimized by using a molybdenum anode with characteristic peaks at 17.5 and 19.6 keV . However, with the high dynamic range of digital detectors, image quality has to be characterized by signal-difference-to-noise-ratio (SDNR), which for calcifications and tumors is optimal for photon spectra of higher mean energy . The latter may be particularly true in thicker breasts . It has been reported that higher energy photons may be absorbed more effectively by selenium layers used in some flat panel detectors . Several phantom studies have demonstrated a decrease in AGD for a given SDNR with the use of a tungsten/rhodium (W/Rh) anode filter combination compared with molybdenum/molybdenum (Mo/Mo) or molybdenum/rhodium (Mo/Rh) . One recent study compared two groups of patients examined with either Mo/Mo or Mo/Rh according to breast thickness or with W/Rh . However, no direct, intraindividual comparison of the AGD of different mammography systems in clinical use has so far been published.
Currently available digital mammography systems differ in terms of both the x-ray beam spectra and detector technologies used. Charge-coupled device–based systems are in use in stereotactic breast imaging, but are no longer being used in full-field digital mammography. One system uses a photon counting slot-scan technique . However, the majority of digital mammography systems available employ flat panel detectors on the basis of amorphous silicon or selenium. Several studies have examined the image quality of different detector technologies .
Get Radiology Tree app to read full this article<
Materials and methods
Get Radiology Tree app to read full this article<
Mammography Systems
Get Radiology Tree app to read full this article<
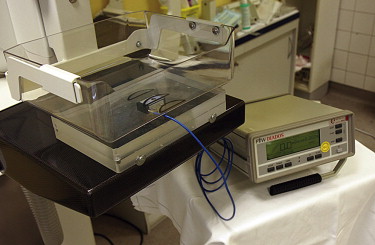
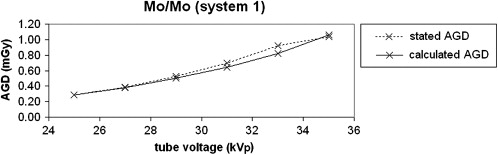
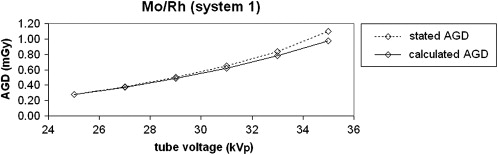
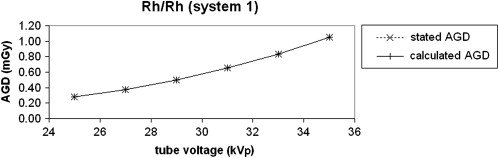
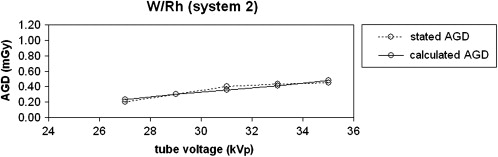
Verification of Estimated AGD Stated by each Mammography Unit
Get Radiology Tree app to read full this article<
Get Radiology Tree app to read full this article<
Intraindividual Comparison of AGD in a Clinical Setting
Get Radiology Tree app to read full this article<
Get Radiology Tree app to read full this article<
Comparison of Contrast-detail Resolution at Standard Settings
Get Radiology Tree app to read full this article<
IQFinv=100∑ni=1CiDi,th IQFinv
=
100
∑
i
=
1
n
C
i
D
i
,
t
h
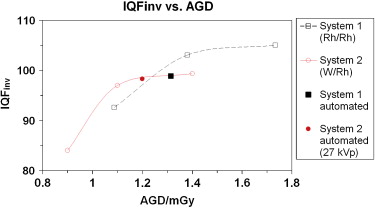
where C i represents the object position in the contrast column (thickness), D i , th denotes the smallest visible diameter in this column, and n represents the number of rows/columns in the phantom. A higher IQFinv corresponds to a better contrast-detail resolution. Four Plexiglas plates of 1 cm thickness each were placed on the phantom to simulate a typical breast. At a tube voltage of 28kVp, eight consecutive images were acquired at tube currents of 63 mAs, 80 mAs, and 100 mAs. In addition to using predefined imaging settings, a further set of phantom images using automated settings were acquired on each system. Automated analysis of phantom images was performed using a software program (CDMAM Analyser Version 1.1, Artinis Medical Systems BV, AS Zetten, Netherlands) and the IQFinv at each setting was determined.
Get Radiology Tree app to read full this article<
Statistics
Get Radiology Tree app to read full this article<
Results
Comparison of “Measured” and “Stated” AGD
Get Radiology Tree app to read full this article<
Patient Examinations
Get Radiology Tree app to read full this article<
Table 1
Anode/filter Combinations Employed in the Mammography Examinations by View
Examination 1 Examination 2 Examination 3 View Anode/Filter: No. of patients Anode/Filter: No. of patients Anode/Filter: No. of patients CC Mo/Mo: 8 Mo/Mo: 9 W/Rh: 50 Mo/Rh: 17 Mo/Rh: 15 Rh/Rh: 25 Rh/Rh: 26 MLO Mo/Mo: 5 Mo/Mo: 7 W/Rh: 50 Mo/Rh: 11 Mo/Rh: 11 Rh/Rh: 34 Rh/Rh: 32
CC: craniocaudal; MLO: mediolateral oblique.
Get Radiology Tree app to read full this article<
Get Radiology Tree app to read full this article<
Get Radiology Tree app to read full this article<
Table 2
Mean Average Glandular Dose (AGD) in the Three Examinations by View
Examination 1 Examination 2 Examination 3 GE Senographe 2000D GE Senographe 2000D Siemens Novation DR AGD (mean [95% confidence interval])/mGy_CC:_ 1.49 [1.40–1.57]CC: 1.52 [1.41–1.62]CC: 0.95 [0.87–1.03] ∗ MLO: 1.52 [1.42–1.62]MLO: 1.55 [1.46–1.65]MLO: 1.01 [0.91–1.11] ∗ Compression force (mean[range])/N_CC:_ 139 [60–200]CC: 136 [50–180]CC: 122 [58–197]MLO: 144 [60–200]MLO: 140 [70–200]MLO: 136 [58–189] Compression thickness (mean[range])/mm_CC:_ 47 [19–76]CC: 48 [14–77]CC: 49 [19–78]MLO: 49 [14–76]MLO: 51 [13–84]MLO: 51 [19–81]
CC: craniocaudal; MLO: mediolateral oblique.
Get Radiology Tree app to read full this article<
Get Radiology Tree app to read full this article<
Get Radiology Tree app to read full this article<
Get Radiology Tree app to read full this article<
Get Radiology Tree app to read full this article<
Get Radiology Tree app to read full this article<
Table 3
Breast Characteristics and Imaging Settings According to Anode/Filter Combination Used
View Position Anode/Filter Combination Mean ACR Density Index (Range) Mean Tube Voltage/kV (Range) Mean Breast Thickness/mm (Range) Mean AGD/mGy Mean AGD Reduction ∗ Examinations 1 and 2 (System 1) CC Mo/Mo ( n = 17) 2.88 (2–4) 27.6 (27–28) 28 (17–37) 1.12 ± 0.22 40.8 ± 12.0% Mo/Rh ( n = 32) 2.31 (1–4) 28.0 (27–29) 45 (36–65) 1.53 ± 0.26 42.3 ± 11.7% Rh/Rh ( n = 51) 2.45 (1–4) 29.7 (28–32) 56 (33–77) 1.57 ± 0.42 30.5 ± 15.1% MLO Mo/Mo ( n = 12) 3.08 (2–4) 27.7 (27–28) 25 (13–38) 1.22 ± 0.24 39.9 ± 9.8% Mo/Rh ( n = 22) 2.27 (1–4) 28.3 (27–29) 45 (28–66) 1.54 ± 0.29 44.1 ± 10.4% Rh/Rh ( n = 66) 2.44 (1–4) 29.8 (28–32) 56 (33–84) 1.59 ± 0.36 28.7 ± 19.6% Examination 3 (System 2) CC W/Rh ( n = 100) 2.48 (1–4) 28.5 (25–32) 49 (19–78) 0.95 ± 0.29 — MLO W/Rh ( n = 100) 2.48 (1–4) 28.7 (25–32) 51 (19–81) 1.01 ± 0.35 —
CC: craniocaudal; MLO: mediolateral oblique; ACR, American College of Radiology.
Get Radiology Tree app to read full this article<
Get Radiology Tree app to read full this article<
Contrast-detail Resolution
Get Radiology Tree app to read full this article<
![Figure 11, Magnification of the same group of microcalcifications: i) System 1 (MLO view, September 2006, Rh/Rh, average glandular dose [AGD] 1.2 mGy), ii) System 2 (MLO view, August 2007, W/Rh, AGD 1.1 mGy). MLO, mediolateral oblique.](https://storage.googleapis.com/dl.dentistrykey.com/clinical/IntraindividualComparisonofAverageGlandularDoseofTwoDigitalMammographyUnitsusingDifferentAnodeFilterCombinations/10_1s20S1076633209003110.jpg)
Get Radiology Tree app to read full this article<
Discussion
Get Radiology Tree app to read full this article<
Get Radiology Tree app to read full this article<
Get Radiology Tree app to read full this article<
Table 4
Partial Correlation Coefficients of Average Glandular Dose (AGD) and Breast Thickness and AGD and Breast Density Index in Both Views in the Three Examinations
Correlation Coefficient Examination View AGD and Breast Thickness ∗ AGD and Breast Density † 1 (System 1) MLO 0.75 ( P < .001) 0.08 (NS) CC 0.73 ( P < .001) 0.28 (NS) 2 (System 1) MLO 0.79 ( P < .001) 0.11 (NS) CC 0.75 ( P < .001) 0.30 ( P < .05) 3 (System 2) MLO 0.53 ( P < .001) 0.47 ( P < .01) CC 0.47 ( P < .01) 0.51 ( P < .001)
AGD, average glandular dose; CC: craniocaudal; MLO: mediolateral oblique.
Get Radiology Tree app to read full this article<
Get Radiology Tree app to read full this article<
Get Radiology Tree app to read full this article<
Get Radiology Tree app to read full this article<
Differences in Detector Technology
Get Radiology Tree app to read full this article<
Image Quality
Get Radiology Tree app to read full this article<
Limitations of the Study
Get Radiology Tree app to read full this article<
Get Radiology Tree app to read full this article<
References
1. Bloomquist A.K., Yaffe M.J., Pisano E.D., et. al.: Quality control for digital mammography in the ACRIN DMIST trial: part I. Med Phys 2006; 33: pp. 719-736.
2. Pisano E.D., Gatsonis C., Hendrick E., et. al.: Diagnostic performance of digital versus film mammography for breast-cancer screening. N Engl J Med 2005; 353: pp. 1773-1783.
3. Rini J.M., Horowitz A., Balter S., et. al.: A comparison of tungsten and molybdenum as target material for mammographic x-ray tubes. Radiology 1973; 106: pp. 657-661.
4. Bernhardt P., Mertelmeier T., Hoheisel M.: X-ray spectrum optimization of full-field digital mammography: simulation and phantom study. Med Phys 2006; 33: pp. 4337-4349.
5. Dance D.R., Thilander A.K., Sandborg M., et. al.: Influence of anode/filter material and tube potential on contrast, signal-to-noise ratio and average absorbed dose in mammography: a Monte Carlo study. Br J Radiol 2000; 73: pp. 1056-1067.
6. Jennings R.J., Eastgate R.J., Siedband M.P., et. al.: Optimal x-ray spectra for screen-film mammography. Med Phys 1981; 8: pp. 629-639.
7. Schulz-Wendtland R., Hermann K.P., Wenkel E., et. al.: [Experimental investigations for dose reduction by optimizing the radiation quality for digital mammography with an a-Se detector]. Rofo 2007; 179: pp. 487-491.
8. Toroi P., Zanca F., Young K.C., et. al.: Experimental investigation on the choice of the tungsten/rhodium anode/filter combination for an amorphous selenium-based digital mammography system. Eur Radiol 2007; 17: pp. 2368-2375.
9. Uhlenbrock D.F., Mertelmeier T.: Comparison of anode/filter combinations in digital mammography with respect to the average glandular dose. Rofo 2009; 181: pp. 249-254.
10. Wallis M.: NHSBSP Equipment Report 0601: evaluation and clinical assessment of digital mammography screening using a Sectra MicroDose full field digital x-ray unit and spectra breast imaging PACS.2006.NHS Cancer Screening ProgrammesSheffield, UK
11. Schulz-Wendtland R., Lell M., Wenkel E., et. al.: [DR (a-Se) versus CR (DLR)—is an improvement of the accuracy possible? A retrospective histologic analysis (n = 100)]. Rontgenpraxis 2007; 56: pp. 129-135.
12. Perry N., Broeders M., de Wolf C., et. al.: European guidelines for quality assurance in breast cancer screening and diagnosis. Fourth edition—summary document. Ann Oncol 2008; 19: pp. 614-622.
13. Bacher K., Smeets P., De Hauwere A., et. al.: Image quality performance of liquid crystal display systems: influence of display resolution, magnification and window settings on contrast-detail detection. Eur J Radiol 2006; 58: pp. 471-479.
14. Thijssen M.A.O., Thijssen H.O.M., Merx J.L.: A definition of image quality: the image quality figure.Moores B.M.Wall B.F.Eriskat H.BIR report 20: optimization of image quality and patient exposure in diagnostic radiology.1989.The British Institute of RadiologyLondon:pp. 29-34.
15. Säbel M., Aichinger U., Schulz-Wendtland R.: [Radiation exposure in x-ray mammography]. Rofo 2001; 173: pp. 79-91.
16. Beckett J., Kotre C., Michaelson J.: Analysis of benefit: risk ratio and mortality reduction for the UK Breast Screening Programme. Br J Radiol 2003; 76: pp. 309-320.
17. Tabar L., Yen M.F., Vitak B., et. al.: Mammography service screening and mortality in breast cancer patients: 20-year follow-up before and after introduction of screening. Lancet 2003; 361: pp. 1405-1410.