
Rationale and Objectives
To compare the results of two software-based methods, Quantra and Volpara, for volumetric breast composition assessment.
Materials and Methods
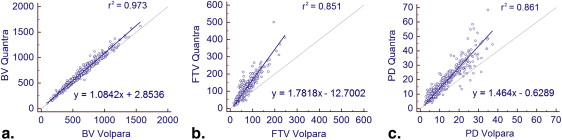
Four hundred forty-five normal, bilateral, two-view, digital mammograms were included. Breast volume (BV), fibroglandular tissue volume (FTV), and percent density (PD) were measured using both methods and compared. Deming regression was performed to obtain linear equations for mapping the results of one software on the other.
Results
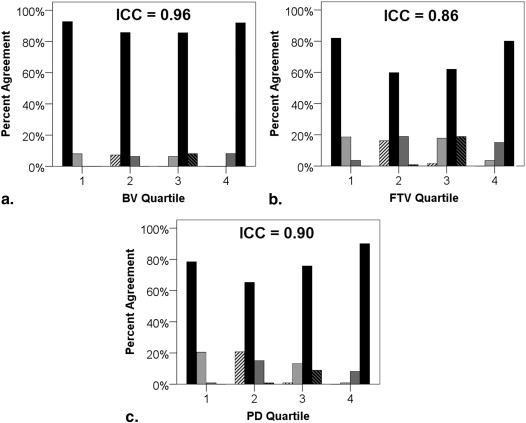
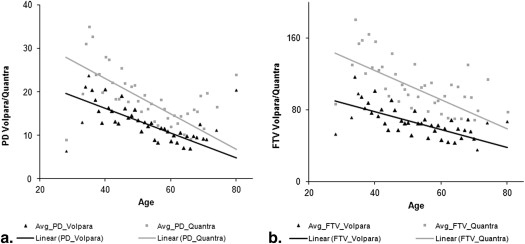
The median and quartile ranges of both methods agreed well for BV but were different for FTV and PD, with Quantra showing much higher values of FTV and PD. The correlation of results obtained by both methods for BV, FTV, and PD was 0.99, 0.91, and 0.94, respectively. Intraclass correlation in the assignment of quartiles of BV, FTV, and PD was 0.96, 0.86, and 0.90, respectively. Both methods showed a similar association of FTV and PD with patient age and similar left-to-right correlation. Mapping of results onto each other using linear equations removed the systematic differences.
Conclusions
Although Quantra and Volpara use different models for analysis of volumetric breast composition and produce different nominal results of FTV and PD, both methods are highly correlated and show very good to excellent agreement in quartile assignment of all parameters measured. Both methods show a similar association with patient age and similar reproducibility. Both methods can be mapped onto each other using the equations suggested.
Mammographic breast density is a strong predictor of breast cancer . Recent studies indicate that it may also be a useful parameter for assessing the response to tamoxifen and for estimating the prognosis of breast cancer patients . Breast density also strongly affects the sensitivity of screening mammography and may be used as a variable to individualize screening regimens in the future .
Visual breast density assessment, which is used in most clinical and many research settings, is fast but is limited by only moderate inter-reader and intra-reader agreement . Semiquantitative methods were developed to improve reproducibility, but are time consuming because they require reader interaction . More recently, several methods for automated volumetric breast composition assessment have been introduced which provide fast and highly reproducible quantification of breast density and absolute volumes of breast tissue components . Different models are used to derive the volumes of breast tissue components from digital mammogram raw data, and these produce very different results . This potentially limits the applicability of the results of research studies using either technique. Although the Quantra software (Hologic Inc., Bedford, MA) uses the acquisition parameters of the mammogram together with a model of x-ray attenuation of different breast tissues, the Volpara software (Mātakina, Wellington, New Zealand) uses “relative physics,” with features of the mammogram to be analyzed for calibration . Individual software algorithms have been compared to visual assessment of breast density and to magnetic resonance imaging (MRI) as a reference standard . However, owing to the different models used, it is not clear how the results obtained with different softwares can be compared to each other. The aim of this study was to perform intraindividual comparison of two volumetric breast composition assessment software methods, the Quantra and Volpara, 1) to determine whether there is a linear or a more complex relationship between the results obtained with both methods and 2) to determine how results from one software can be compared to those from the other.
Materials and methods
Get Radiology Tree app to read full this article<
Image Data
Get Radiology Tree app to read full this article<
Volumetric Breast Composition Analysis Software
Get Radiology Tree app to read full this article<
Get Radiology Tree app to read full this article<
Statistical Analysis
Get Radiology Tree app to read full this article<
Get Radiology Tree app to read full this article<
Cυ=σμ C
υ
=
σ
μ
where σ is the sample standard deviation and μ is the sample mean.
Get Radiology Tree app to read full this article<
Results
Get Radiology Tree app to read full this article<
Table 1
Median and Quartile Ranges of Both Softwares
Median and Qartile Ranges of both Softwares Median Quartiles 1 2 3 4 BV (cm 3 ) Quantra 604 107–430 431–603 604–855 856–1618 Volpara 563 98–405 406–563 564–770 771–1565 FTV (cm 3 ) Quantra 87.0 16.5–60 61–87 88–131 132–501 Volpara 55.4 16.0–41 42–55 56–80 81–246 PD (%) Quantra 15.0 3.0–9.7 9.8–15.0 15.1–23.5 23.6–69.0 Volpara 10.8 2.3–6.8 6.9–10.8 10.9–16.7 16.8–37.3
BV, breast volume; FTV, fibroglandular tissue volume; PD, percent density.
Get Radiology Tree app to read full this article<
Get Radiology Tree app to read full this article<
Get Radiology Tree app to read full this article<
Get Radiology Tree app to read full this article<
Get Radiology Tree app to read full this article<
Get Radiology Tree app to read full this article<
Get Radiology Tree app to read full this article<
Get Radiology Tree app to read full this article<
Get Radiology Tree app to read full this article<
Discussion
Get Radiology Tree app to read full this article<
Get Radiology Tree app to read full this article<
Get Radiology Tree app to read full this article<
Get Radiology Tree app to read full this article<
Get Radiology Tree app to read full this article<
Get Radiology Tree app to read full this article<
Get Radiology Tree app to read full this article<
Get Radiology Tree app to read full this article<
Get Radiology Tree app to read full this article<
Get Radiology Tree app to read full this article<
Get Radiology Tree app to read full this article<
Acknowledgments
Get Radiology Tree app to read full this article<
References
1. Assi V., Warwick J., Cuzick J., et. al.: Clinical and epidemiological issues in mammographic density. Nat Rev Clin Oncol 2012; 9: pp. 33-40.
2. McCormack V.A., dos Santos Silva I.: Breast density and parenchymal patterns as markers of breast cancer risk: a meta-analysis. Cancer Epidemiol Biomarkers Prev 2006; 15: pp. 1159-1169.
3. Cuzick J., Warwick J., Pinney E., et. al.: Tamoxifen-induced reduction in mammographic density and breast cancer risk reduction: a nested case-control study. J Natl Cancer Inst 2011; 103: pp. 744-752.
4. Li J., Humphreys K., Eriksson L., et. al.: Mammographic density reduction is a prognostic marker of response to adjuvant tamoxifen therapy in postmenopausal patients with breast cancer. J Clin Oncol 2013; 31: pp. 2249-2256.
5. Maskarinec G., Pagano I.S., Little M.A., et. al.: Mammographic density as a predictor of breast cancer survival: the Multiethnic Cohort. Breast Cancer Res 2013; 15: pp. R7.
6. Sandberg M.E., Li J., Hall P., et. al.: Change of mammographic density predicts the risk of contralateral breast cancer—a case-control study. Breast Cancer Res 2013; 15: pp. R57.
7. Drukteinis J.S., Mooney B.P., Flowers C.I., et. al.: Beyond mammography: new frontiers in breast cancer screening. Am J Med 2013; 126: pp. 472-479.
8. Bernardi D., Pellegrini M., Di Michele S., et. al.: Interobserver agreement in breast radiological density attribution according to BI-RADS quantitative classification. Radiol Med 2012; 117: pp. 519-528.
9. Ciatto S., Houssami N., Apruzzese A., et. al.: Categorizing breast mammographic density: intra- and interobserver reproducibility of BI-RADS density categories. Breast 2005; 14: pp. 269-275.
10. Ooms E.A., Zonderland H.M., Eijkemans M.J., et. al.: Mammography: interobserver variability in breast density assessment. Breast 2007; 16: pp. 568-576.
11. Byng J.W., Boyd N.F., Fishell E., et. al.: The quantitative analysis of mammographic densities. Phys Med Biol 1994; 39: pp. 1629-1638.
12. Engelken F., Singh J.M., Fallenberg E.M., et. al.: Volumetric breast composition analysis: reproducibility of breast percent density and fibroglandular tissue volume measurements in serial mammograms. Acta Radiol 2014; 55: pp. 32-38.
13. Singh J.M., Fallenberg E.M., Diekmann F., et. al.: Volumetric breast density assessment: reproducibility in serial examinations and comparison with visual assessment. Rofo 2013; 185: pp. 844-848.
14. van Engeland S., Snoeren P.R., Huisman H., et. al.: Volumetric breast density estimation from full-field digital mammograms. IEEE Trans Med Imaging 2006; 25: pp. 273-282.
15. Ciatto S., Bernardi D., Calabrese M., et. al.: A first evaluation of breast radiological density assessment by QUANTRA software as compared to visual classification. Breast 2012; 21: pp. 503-506.
16. Jeffreys M., Warren R., Highnam R., et. al.: Initial experiences of using an automated volumetric measure of breast density: the standard mammogram form. Br J Radiol 2006; 79: pp. 378-382.
17. Gweon H.M., Youk J.H., Kim J.A., et. al.: Radiologist assessment of breast density by BI-RADS categories versus fully automated volumetric assessment. AJR Am J Roentgenol 2013; 201: pp. 692-697.
18. Seo J.M., Ko E.S., Han B.K., et. al.: Automated volumetric breast density estimation: a comparison with visual assessment. Clin Radiol 2013; 68: pp. 690-695.
19. Wang J., Azziz A., Fan B., et. al.: Agreement of mammographic measures of volumetric breast density to MRI. PLoS One 2013; 8: pp. e81653.
20. Hammann-Kloss J.S., Bick U., Fallenberg E., et. al.: Volumetric quantification of the effect of aging and hormone replacement therapy on breast composition from digital mammograms. Eur J Radiol 2014; 83: pp. 1092-1097.
21. Skippage P., Wilkinson L., Allen S., et. al.: Correlation of age and HRT use with breast density as assessed by Quantra. Breast J 2013; 19: pp. 79-86.
22. Redondo A., Comas M., Macia F., et. al.: Inter- and intraradiologist variability in the BI-RADS assessment and breast density categories for screening mammograms. Br J Radiol 2012; 85: pp. 1465-1470.
23. Chmura Kraemer H., Periyakoil V.S., Noda A.: Kappa coefficients in medical research. Stat Med 2002; 21: pp. 2109-2129.
24. Sauber N, Chan A, Highnam R. BI-RADS breast density classification - an international standard? Poster Presentation presented at: European Congress of Radiology. Vienna, Austria 2013 Mar 7-11.