
Rationale and Objectives
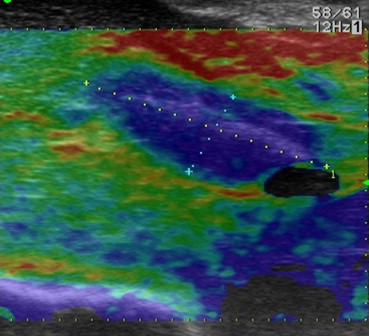
Image-guided thermal ablation is used to treat primary and secondary liver cancers. Evaluating completeness of ablation is difficult with standard intraoperative B-mode ultrasound. This study evaluates the ability of B-mode ultrasound (US) and tissue elastography to adequately measure the extent of ablation compared to pathologic assessment.
Materials and Methods
An in vivo porcine model was used to compare B-mode ultrasonography and elastography to pathologic assessment of the microwave ablation zone area. In parallel, intraoperative ablations in patients were used to assess the ability of B-mode US and elastographic measures of tissue strain immediately after ablation to predict ablation size, compared to postprocedural computed tomography (CT).
Results
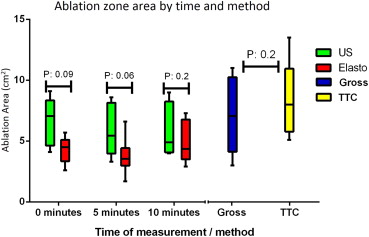
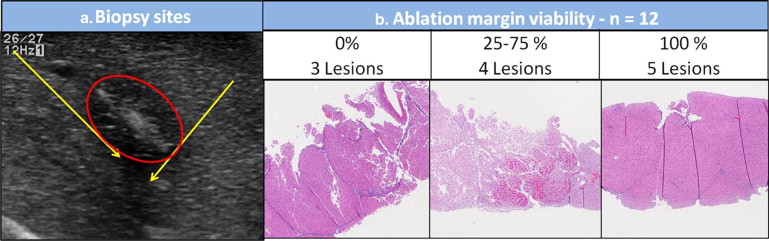
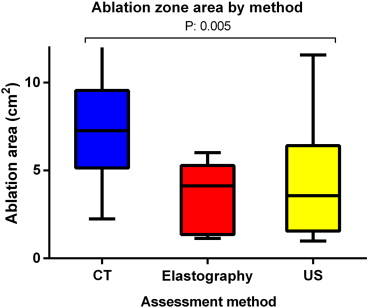
In the animal model, ablation zones appeared to decrease in size when monitored with ultrasound over a 10-minute span with both B-mode US and elastography. Both techniques estimated smaller zones than gross pathology, however, the differences did not reach statistical significance. Biopsies from the edges of the ablation zone, as assessed by US, contained viable tissue in 75% of the cases. In the human model, B-mode US and elastography estimated similar ablation sizes; however, they underestimate the final size of the ablation defect as measured on postprocedure CT scan (median area [interquartile range]: CT, 7.3 cm 2 [5.2–9.5] vs. US 3.6 cm 2 [1.7–6.3] and elastography 4.1 cm 2 [1.4–5.1]; P = .005).
Conclusions
Ultrasound and elastography provide an accurate gross estimation of ablation zone size but are unable to predict the degree of cellular injury and significantly underestimate the ultimate size of the ablation
Thermal ablation is an accepted therapeutic alternative in selected patients with primary or metastatic liver neoplasms. This approach is used primarily for tumors that are considered inappropriate for resection because of tumor- (multiplicity, location within the liver) or patient-related factors (comorbidities or small, predicted, future liver remnant) . Local recurrence, however, is common and has been associated with tumor size and tumor location .
The ideal image guidance modality would assist in preoperative planning, lesion targeting, real-time ablation monitoring, and ablation zone assessment . Intraoperative ultrasound (ioUS) is the most widely used image guidance modality, given its availability, relative ease of use, and ability to provide feedback for ablation probe placement (lesion targeting) . However, heat-induced artifact and the underlying characteristics of the liver parenchyma (i.e., steatosis, cirrhosis, and chemotherapy-associated changes) significantly impact ablation zone monitoring and assessment during and immediately after the ablation has taken place. As a result, complete destruction of tumor tissue is impossible to confirm . In addition, it is unclear how this technical limitation influences local recurrence rates .
Get Radiology Tree app to read full this article<
Get Radiology Tree app to read full this article<
Methods
Get Radiology Tree app to read full this article<
Porcine in vivo model
Get Radiology Tree app to read full this article<
Get Radiology Tree app to read full this article<
Get Radiology Tree app to read full this article<
Human model
Get Radiology Tree app to read full this article<
Get Radiology Tree app to read full this article<
Microwave ablation
Get Radiology Tree app to read full this article<
Ultrasonography and elastography guidance system
Get Radiology Tree app to read full this article<
Statistical analysis
Get Radiology Tree app to read full this article<
Results
Porcine in vivo model
Get Radiology Tree app to read full this article<
Table 1
Ablation Zone Areas by Different Modalities and Time Points in Six Microwave Ablations in Porcine Model
Ablation Zone 0 minute 5 minutes 10 minutes TTC Gross Elastography US Elastography US Elastography US Lesion 1 6.3 3 3.6 7.7 3.6 6 3.7 4 Lesion 2 13.5 10 2.6 4.8 3.4 3.3 3.7 5 Lesion 3 6 4.5 4.7 8.1 1.7 4.2 6.6 9 Lesion 4 10.1 9.5 4.3 9.1 6.6 8.6 7.3 8 Lesion 5 5.1 4.6 4.9 4.1 3.7 4.9 2.9 4.8 Lesion 6 9.7 11 5.7 6.4 3.5 8 5 4.1 Median 8 7.05 4.5 7.05 3.55 5.45 4.35 4.9
TTC, 2,3,5-triphenyltetrazolium chloride; US, B-mode ultrasound.
Comparison of the estimated size of ablation by ultrasound, elastography, TTC enhanced, and gross pathology measurements in the porcine model.
Get Radiology Tree app to read full this article<
Get Radiology Tree app to read full this article<
Get Radiology Tree app to read full this article<
Human model (Intraoperative ablation)
Get Radiology Tree app to read full this article<
Table 2
Human Model ( n = 24)
US Elastography_P_ Value Tumor size, cm 2 (IQR) 0.4 (0.1–1.2) 0.6 (0.3–1.7) .4 Ablation size, cm 2 (IQR) 3 (1.2–4.1) 3.2 (1.3–4.3) .1
IQR, interquartile range; US, B-mode ultrasound.
Comparison of the estimated size of ablation by ultrasound and elastography in the human model.
Get Radiology Tree app to read full this article<
Discussion
Get Radiology Tree app to read full this article<
Get Radiology Tree app to read full this article<
Get Radiology Tree app to read full this article<
Get Radiology Tree app to read full this article<
Get Radiology Tree app to read full this article<
Get Radiology Tree app to read full this article<
Get Radiology Tree app to read full this article<
Conclusion
Get Radiology Tree app to read full this article<
References
1. Rocha F.G., D’Angelica M.: Treatment of liver colorectal metastases: role of laparoscopy, radiofrequency ablation, and microwave coagulation. J Surg Oncol 2010; 102: pp. 968-974.
2. Lau W.Y., Lai E.C.: The current role of radiofrequency ablation in the management of hepatocellular carcinoma: a systematic review. Ann Surg 2009; 249: pp. 20-25.
3. Mulier S., Ni Y., Jamart J., et. al.: Local recurrence after hepatic radiofrequency coagulation: multivariate meta-analysis and review of contributing factors. Ann Surg 2005; 242: pp. 158-171.
4. Kingham T.P., Tanoue M., Eaton A., et. al.: Patterns of recurrence after ablation of colorectal cancer liver metastases. Ann Surg Oncol 2012; 19: pp. 834-841.
5. Clasen S., Pereira P.L.: Magnetic resonance guidance for radiofrequency ablation of liver tumors. J Magn Reson Imaging 2008; 27: pp. 421-433.
6. Kolokythas O., Gauthier T., Fernandez A.T., et. al.: Ultrasound-based elastography: a novel approach to assess radio frequency ablation of liver masses performed with expandable ablation probes: a feasibility study. J Ultrasound Med 2008; 27: pp. 935-946.
7. Choi D., Lim H.K., Kim S.H., et. al.: Hepatocellular carcinoma treated with percutaneous radio-frequency ablation: usefulness of power Doppler US with a microbubble contrast agent in evaluating therapeutic response-preliminary results. Radiology 2000; 217: pp. 558-563.
8. Leyendecker J.R., Dodd G.D., Halff G.A., et. al.: Sonographically observed echogenic response during intraoperative radiofrequency ablation of cirrhotic livers: pathologic correlation. AJR Am J Roentgenol 2002; 178: pp. 1147-1151.
9. Van Vledder M.G., Boctor E.M., Assumpcao L.R., et. al.: Intra-operative ultrasound elasticity imaging for monitoring of hepatic tumour thermal ablation. HPB (Oxford) 2010; 12: pp. 717-723.
10. Byrd J.F., Agee N., McKillop I.H., et. al.: Colour doppler ultrasonography provides real-time microwave field visualisation in an ex vivo porcine model. HPB (Oxford) 2011; 13: pp. 400-403.
11. Wiggermann P., Jung E.M., Glöckner S., et. al.: Real-time elastography of hepatic thermal lesions in vitro: histopathological correlation. Ultraschall Med 2012; 33: pp. 170-174.
12. Wells P.N., Liang H.D.: Medical ultrasound: imaging of soft tissue strain and elasticity. J R Soc Interface 2011; 8: pp. 1521-1549.
13. Raman S.S., Lu D.S., Vodopich D.J., et. al.: Creation of radiofrequency lesions in a porcine model: correlation with sonography, CT, and histopathology. AJR Am J Roentgenol 2000; 175: pp. 1253-1258.
14. McGahan J.P., Brock J.M., Tesluk H., et. al.: Hepatic ablation with use of radio-frequency electrocautery in the animal model. J Vasc Interv Radiol 1992; 3: pp. 291-297.
15. Solbiati L., Ierace T., Goldberg S.N., et. al.: Percutaneous US-guided radio-frequency tissue ablation of liver metastases: treatment and follow-up in 16 patients. Radiology 1997; 202: pp. 195-203.
16. Nouso K., Shiraga K., Uematsu S., et. al.: Prediction of the ablated area by the spread of microbubbles during radiofrequency ablation of hepatocellular carcinoma. Liver Int 2005; 25: pp. 967-972.
17. Varghese T., Techavipoo U., Liu W., et. al.: Elastographic measurement of the area and volume of thermal lesions resulting from radiofrequency ablation: pathologic correlation. AJR Am J Roentgenol 2003; 181: pp. 701-707.
18. Varghese T., Zagzebski J.A., Lee F.T.: Elastographic imaging of thermal lesions in the liver in vivo following radiofrequency ablation: preliminary results. Ultrasound Med Biol 2002; 28: pp. 1467-1473.
19. Melodelima D., Chenot J., Souchon R., et. al.: Visualisation of liver tumours using hand-held real-time strain imaging: results of animal experiments. Br J Radiol 2012; 85: pp. e556-e565.
20. Rivaz H., Fleming I., Assumpcao L., et. al.: Ablation monitoring with elastography: 2D in-vivo and 3D ex-vivo studies. Med Image Comput Comput Assist Interv 2008; 11: pp. 458-466.
21. Carrafiello G., Lagana D., Mangini M., et. al.: Microwave tumors ablation: principles, clinical applications and review of preliminary experiences. Int J Surg 2008; 6: pp. S65-S69.
22. Goldberg S.N., Gazelle G.S., Compton C.C., et. al.: Treatment of intrahepatic malignancy with radiofrequency ablation: radiologic-pathologic correlation. Cancer 2000; 88: pp. 2452-2463.
23. Zhou Q., Jin X., Jiao D.C., et. al.: Microwave ablation: results in ex vivo and in vivo porcine livers with 2450-MHz cooled-shaft antenna. Chin Med J 2011; 124: pp. 3386-3393.