
Rationale and Objectives
This study aims to investigate the value of intravoxel incoherent motion (IVIM)-derived parameters for early evaluation of the efficiency of radiofrequency ablation (RFA) treatment for rabbit liver VX2 tumor.
Materials and Methods
Eighteen rabbit liver VX2 tumor models were constructed, and computed tomography–guided RFA was performed. One day before and 7 days after RFA, 18 models underwent magnetic resonance imaging, including contrast-enhanced imaging and IVIM diffusion-weighted imaging with 16 b -factors (0–1000 s/mm 2 ). Post-RFA liver tumors were segmented into viable tumor, inflammatory reaction, and ablation necrotic regions according to gross and histopathologic examinations. Parameters derived from IVIM were calculated. One-way analysis of variance and least significant difference test were used for comparisons among the three regions. The diagnostic performance of parameters was evaluated using receiver operating characteristic (ROC) analysis.
Results
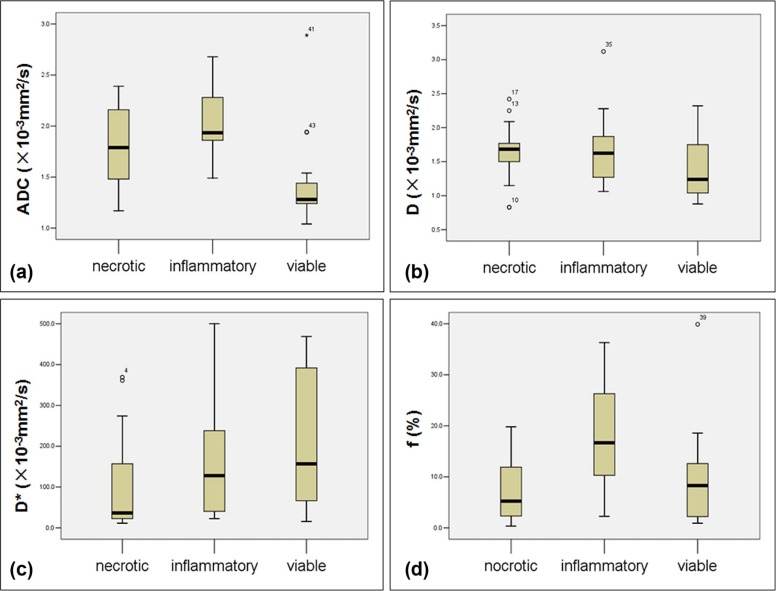
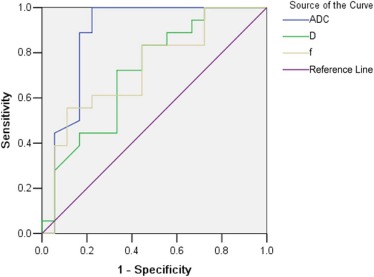
ADC total , D , and f values were significantly lower in viable tumor than in inflammatory reaction regions (all P < .05), but D \* showed no significant difference between the two regions. ADC total values of viable tumor regions were significantly lower than that of ablation necrotic regions ( P = .007), but D \* values of necrotic regions were significantly lower than that of viable tumor regions ( P = .045). In ROC analysis, ADC showed the highest area under the ROC curve for differentiating inflammatory reaction from viable tumor region.
Conclusions
ADC total , D , and f were valuable discriminating markers for differentiation between regions of viable tumor and inflammatory reaction in post-RFA tumor, especially ADC total outperformed the other two parameters with higher diagnostic performance.
Introduction
As one of minimally invasive approaches, radiofrequency ablation (RFA) has been widely used in the treatment of malignant hepatic tumors, especially in patients with unresectable malignancies. Although RFA has achieved promising treatment effects, the incidence of local residual tumors or recurrence after RFA still remains high , which indicates treatment failure and the need for further therapy. Thus, it is of great importance for imaging assessment to detect viable tumor tissue accurately early after RFA. At an early stage after RFA, the inflammatory reaction to the thermal stress around the ablation zone is usually obvious and can last for up to 6 months after RFA . Some imaging features of inflammatory reaction regions may overlap with those of viable tumor regions, such as shape, density or signal intensity, and enhancement pattern . Conventional imaging examination methods (magnetic resonance imaging [MRI] or computed tomography [CT]) based on morphological characteristics cannot provide additional information, which makes it difficult to differentiate between regions of viable tumor and inflammatory reaction within liver tumors after RFA.
Magnetic resonance (MR) diffusion-weighted imaging (DWI) has shown its value in differential diagnosis and treatment follow-up for liver tumors. However, within living tissue, the signal intensity decay vs b -value (gradient intensity) is influenced simultaneously by microcirculation perfusion and pure molecular diffusion . The new intravoxel incoherent motion (IVIM) theory can distinguish perfusion effects from diffusion effects using multiple b -value imaging and biexponential fit analysis . In recent years, IVIM theory has been applied to many clinical studies in abdominal diseases . Therefore, we hypothesize that IVIM may help characterize tissue components in the liver tumor after RFA.
Get Radiology Tree app to read full this article<
Materials and Methods
Liver VX2 Tumor Model
Get Radiology Tree app to read full this article<
Radiofrequency Ablation of VX2 Tumors
Get Radiology Tree app to read full this article<
MR Protocol
Get Radiology Tree app to read full this article<
Table 1
Magnetic Resonance Imaging Parameters
Sequence Repetition Time (ms) Echo Time (ms) Flip Angle (degrees) Matrix Field of View (mm 2 ) Section Thickness (mm) T2-weighted single-shot fast spin echo 2830 65.9 90 288 × 288 140 × 140 2 DWI with 15 b -values 4000 73.9 90 128 × 128 140 × 140 2.6 LAVA-Flex 4 2 70 160 × 160 140 × 140 2
DWI, diffusion-weighted imaging.
Note. b -values of 0, 20, 30, 40, 50, 60, 70, 80, 100, 200, 300, 400, 600, 800, 1000 s/mm 2 were used for DWI.
Get Radiology Tree app to read full this article<
Histopathologic and Immunohistochemical Analysis
Get Radiology Tree app to read full this article<
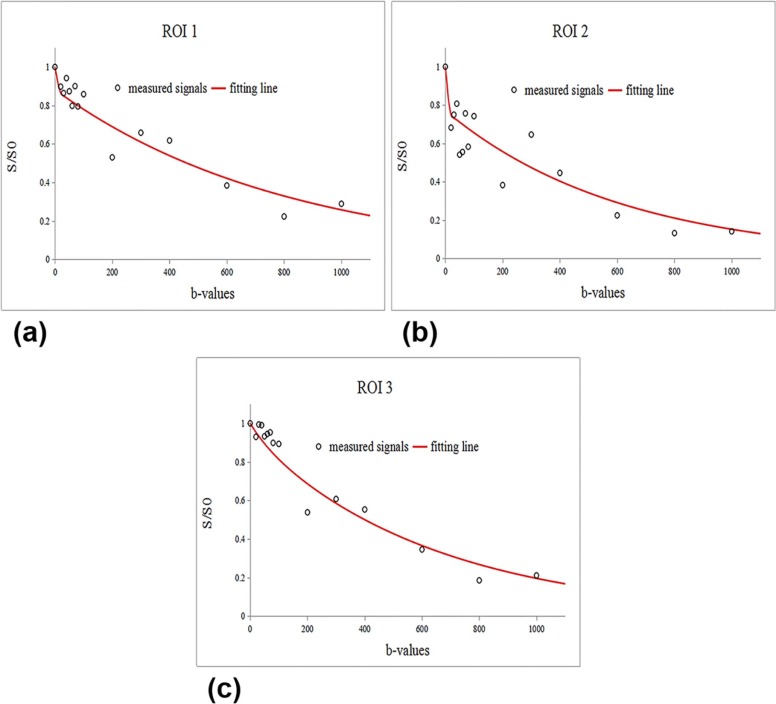
DWI Parameter Acquisition
Get Radiology Tree app to read full this article<
Sb/S0=exp(−b×ADC). S
b
/
S
0
=
exp
(
−
b
×
A
D
C
)
.
In the equation, S b is the signal intensity at a given b -value and S 0 is the signal intensity in the absence of a diffusion gradient ( b = 0). On the basis of IVIM theory, the D , D *, and f values were calculated with a biexponential fit model using the following equation :
Sb/S0=(1−f)×exp(−b×D)+f×exp[−b(D+D*)]. S
b
/
S
0
=
(
1
−
f
)
×
exp
(
−
b
×
D
)
+
f
×
exp
[
−
b
(
D
+
D
*
)
]
.
Get Radiology Tree app to read full this article<
Statistical Analysis
Get Radiology Tree app to read full this article<
Results
Establishment of the Liver VX2 Tumor Model
Get Radiology Tree app to read full this article<
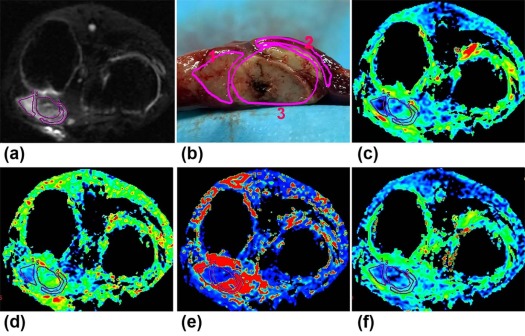
Histopathologic Findings
Get Radiology Tree app to read full this article<
Gross observation
Get Radiology Tree app to read full this article<
Microscopic observation
Get Radiology Tree app to read full this article<
Validation of Components Within Post-RFA Lesions on MRI
Get Radiology Tree app to read full this article<
IVIM Parameters
Get Radiology Tree app to read full this article<
Get Radiology Tree app to read full this article<
Table 2
Mean Values of Measured Parameters for Three Regions of Post-RFA Tumor
Parameter Necrotic Inflammatory Viable_ADC_ total (×10 −3 mm 2 /s) 1.79 ± 0.36 2.04 ± 0.32 1.44 ± 0.44D (×10 −3 mm 2 /s) 1.63 ± 0.41 1.71 ± 0.52 1.37 ± 0.40D \* (×10 −3 mm 2 /s) 109.53 ± 123.64 153.44 ± 133.36 206.63 ± 164.10f (%) 7.71 ± 6.42 18.15 ± 11.12 9.97 ± 9.39
RFA, radiofrequency ablation.
Note. Data are expressed as mean ± standard deviation.
Table 3
Results of Multiple Comparisons Among the Three Regions of Post-RFA Liver Tumor
Parameter Necrotic vs Inflammatory Necrotic vs Viable Inflammatory vs Viable_ADC_ total 0.0560.007 \* ≤ 0.001 \* D 0.621 0.0800.026 \* D \* 0.3560.045 \* 0.264f ≤ 0.001 \* 0.4640.010 \*
RFA, radiofrequency ablation.
Note. Data are P values.
Get Radiology Tree app to read full this article<
Get Radiology Tree app to read full this article<
Get Radiology Tree app to read full this article<
Table 4
ROC Analysis for ADC total , D , and f in Differentiating Between Viable and Inflammatory Regions
Parameter_A z_ Value \* (AUC) Best Cutoff Sensitivity (%) Specificity (%)P Value_ADC_ total (10 −3 mm 2 /s) 0.880 (0.750, 1.009) 1.465 77.78 100 ≤.001D (10 −3 mm 2 /s) 0.716 (0.547, 0.885) 1.310 66.67 72.22 .027f (%) 0.728 (0.560, 0.897) 0.166 88.89 55.56 .019
AUC, area under the curve; ROC, receiver operating characteristic.
Get Radiology Tree app to read full this article<
Get Radiology Tree app to read full this article<
Discussion
Get Radiology Tree app to read full this article<
Get Radiology Tree app to read full this article<
Get Radiology Tree app to read full this article<
Get Radiology Tree app to read full this article<
Get Radiology Tree app to read full this article<
Get Radiology Tree app to read full this article<
Get Radiology Tree app to read full this article<
Get Radiology Tree app to read full this article<
Get Radiology Tree app to read full this article<
Get Radiology Tree app to read full this article<
References
1. Hung H.H., Chiou Y.Y., Hsia C.Y., et. al.: Survival rates are comparable after radiofrequency ablation or surgery in patients with small hepatocellular carcinomas. Clin Gastroenterol Hepatol 2011; 9: pp. 79-86.
2. Kang T.W., Rhim H., Lee M.W., et. al.: Terminology and reporting criteria for radiofrequency ablation of tumors in the scientific literature: systematic review of compliance with reporting standards. Korean J Radiol 2014; 15: pp. 95.
3. Goldberg S.N., Charboneau J.W., Dodd G.R., et. al.: Image-guided tumor ablation: proposal for standardization of terms and reporting criteria. Radiology 2003; 228: pp. 335-345.
4. Koike N., Cho A., Nasu K., et. al.: Role of diffusion-weighted magnetic resonance imaging in the differential diagnosis of focal hepatic lesions. World J Gastroenterol 2009; 15: pp. 5805-5812.
5. Miller F.H., Hammond N., Siddiqi A.J., et. al.: Utility of diffusion-weighted MRI in distinguishing benign and malignant hepatic lesions. J Magn Reson Imaging 2010; 32: pp. 138-147.
6. Kubota K., Yamanishi T., Itoh S., et. al.: Role of diffusion-weighted imaging in evaluating therapeutic efficacy after transcatheter arterial chemoembolization for hepatocellular carcinoma. Oncol Rep 2010; 24: pp. 727-732.
7. Yu J.S., Kim J.H., Chung J.J., et. al.: Added value of diffusion-weighted imaging in the MRI assessment of perilesional tumor recurrence after chemoembolization of hepatocellular carcinomas. J Magn Reson Imaging 2009; 30: pp. 153-160.
8. Le Bihan D., Breton E., Lallemand D., et. al.: Separation of diffusion and perfusion in intravoxel incoherent motion MR imaging. Radiology 1988; 168: pp. 497-505.
9. Le Bihan D., Breton E., Lallemand D., et. al.: MR imaging of intravoxel incoherent motions: application to diffusion and perfusion in neurologic disorders. Radiology 1986; 161: pp. 401-407.
10. Chiaradia M., Baranes L., Van Nhieu J.T., et. al.: Intravoxel incoherent motion (IVIM) MR imaging of colorectal liver metastases: are we only looking at tumor necrosis?. J Magn Reson Imaging 2014; 39: pp. 317-325.
11. Kang K.M., Lee J.M., Yoon J.H., et. al.: Intravoxel incoherent motion diffusion-weighted MR imaging for characterization of focal pancreatic lesions. Radiology 2014; 270: pp. 444-453.
12. Guo Z., Zhang Q., Li X., et. al.: Intravoxel incoherent motion diffusion weighted MR imaging for monitoring the instantly therapeutic efficacy of radiofrequency ablation in rabbit VX2 tumors without evident links between conventional perfusion weighted images. PLoS ONE 2015; 10: e127964
13. Miao Y., Ni Y., Mulier S., et. al.: Treatment of VX2 liver tumor in rabbits with “wet” electrode mediated radio-frequency ablation. Eur Radiol 2000; 10: pp. 188-194.
14. Budihardjo I., Oliver H., Lutter M., et. al.: Biochemical pathways of caspase activation during apoptosis. Annu Rev Cell Dev Biol 1999; 15: pp. 269-290.
15. Yang J., Ramnath N., Moysich K.B., et. al.: Prognostic significance of MCM2, Ki-67 and gelsolin in non-small cell lung cancer. BMC Cancer 2006; 6: pp. 203.
16. Sofocleous C.T., Nascimento R.G., Petrovic L.M., et. al.: Histopathologic and immunohistochemical features of tissue adherent to multitined electrodes after RF ablation of liver malignancies can help predict local tumor progression: initial results. Radiology 2008; 249: pp. 364-374.
17. Malayeri A.A., El K.R., Zaheer A., et. al.: Principles and applications of diffusion-weighted imaging in cancer detection, staging, and treatment follow-up. Radiographics 2011; 31: pp. 1773-1791.
18. Liu Y., Lu L., Jin H., et. al.: Radiofrequency ablation of liver VX2 tumor: experimental results with MR diffusion-weighted imaging at 3.0T. PLoS ONE 2014; 9: e104239
19. White M.L., Zhang Y., Robinson R.A.: Evaluating tumors and tumorlike lesions of the nasal cavity, the paranasal sinuses, and the adjacent skull base with diffusion-weighted MRI. J Comput Assist Tomogr 2006; 30: pp. 490-495.
20. Zhu L., Cheng Q., Luo W., et. al.: A comparative study of apparent diffusion coefficient and intravoxel incoherent motion-derived parameters for the characterization of common solid hepatic tumors. Acta Radiol 2015; 56: pp. 1411-1418.
21. Woo S., Lee J.M., Yoon J.H., et. al.: Intravoxel incoherent motion diffusion-weighted MR imaging of hepatocellular carcinoma: correlation with enhancement degree and histologic grade. Radiology 2014; 270: pp. 758-767.
22. Lemke A., Laun F.B., Klauss M., et. al.: Differentiation of pancreas carcinoma from healthy pancreatic tissue using multiple b-values: comparison of apparent diffusion coefficient and intravoxel incoherent motion derived parameters. Invest Radiol 2009; 44: pp. 769-775.
23. Re T.J., Lemke A., Klauss M., et. al.: Enhancing pancreatic adenocarcinoma delineation in diffusion derived intravoxel incoherent motion f-maps through automatic vessel and duct segmentation. Magn Reson Med 2011; 66: pp. 1327-1332.
24. Wang L.L., Lin J., Liu K., et. al.: Intravoxel incoherent motion diffusion-weighted MR imaging in differentiation of lung cancer from obstructive lung consolidation: comparison and correlation with pharmacokinetic analysis from dynamic contrast-enhanced MR imaging. Eur Radiol 2014; 24: pp. 1914-1922.
25. Luciani A., Vignaud A., Cavet M., et. al.: Liver cirrhosis: intravoxel incoherent motion MR imaging—pilot study. Radiology 2008; 249: pp. 891-899.
26. Parente D.B., Paiva F.F., Oliveira N.J., et. al.: Intravoxel incoherent motion diffusion weighted MR imaging at 3.0 T: assessment of steatohepatitis and fibrosis compared with liver biopsy in type 2 diabetic patients. PLoS ONE 2015; 10: e125653
27. Wagner M., Doblas S., Daire J.L., et. al.: Diffusion-weighted MR imaging for the regional characterization of liver tumors. Radiology 2012; 264: pp. 464-472.
28. Dyvorne H.A., Galea N., Nevers T., et. al.: Diffusion-weighted imaging of the liver with multiple b values: effect of diffusion gradient polarity and breathing acquisition on image quality and intravoxel incoherent motion parameters—a pilot study. Radiology 2013; 266: pp. 920-929.
29. Andreou A., Koh D.M., Collins D.J., et. al.: Measurement reproducibility of perfusion fraction and pseudodiffusion coefficient derived by intravoxel incoherent motion diffusion-weighted MR imaging in normal liver and metastases. Eur Radiol 2013; 23: pp. 428-434.
30. Kakite S., Dyvorne H., Besa C., et. al.: Hepatocellular carcinoma: short-term reproducibility of apparent diffusion coefficient and intravoxel incoherent motion parameters at 3.0T. J Magn Reson Imaging 2015; 41: pp. 149-156.
31. Yoshino N., Yamada I., Ohbayashi N., et. al.: Salivary glands and lesions: evaluation of apparent diffusion coefficients with split-echo diffusion-weighted MR imaging—initial results. Radiology 2001; 221: pp. 837-842.
32. Nasu K., Kuroki Y., Nawano S., et. al.: Hepatic metastases: diffusion-weighted sensitivity encoding versus SPIO-enhanced MR imaging. Radiology 2006; 239: pp. 122-130.
33. Kwee T.C., Takahara T., Koh D.M., et. al.: Comparison and reproducibility of ADC measurements in breathhold, respiratory triggered, and free-breathing diffusion-weighted MR imaging of the liver. J Magn Reson Imaging 2008; 28: pp. 1141-1148.