
Rationale and Objectives
To retrospectively compare resident adherence to checklist-style structured reporting for maxillofacial computed tomography (CT) from the emergency department (when required vs. suggested between two programs). To compare radiology resident reporting accuracy before and after introduction of the structured report and assess its ability to decrease the rate of undetected pathology.
Materials and Methods
We introduced a reporting checklist for maxillofacial CT into our dictation software without specific training, requiring it at one program and suggesting it at another. We quantified usage among residents and compared reporting accuracy, before and after counting and categorizing faculty addenda.
Results
There was no significant change in resident accuracy in the first few months, with residents acting as their own controls (directly comparing performance with and without the checklist). Adherence to the checklist at program A (where it originated and was required) was 85% of reports compared to 9% of reports at program B (where it was suggested). When using program B as a secondary control, there was no significant difference in resident accuracy with or without using the checklist (comparing different residents using the checklist to those not using the checklist).
Conclusions
Our results suggest that there is no automatic value of checklists for improving radiology resident reporting accuracy. They also suggest the importance of focused training, checklist flexibility, and a period of adjustment to a new reporting style. Mandatory checklists were readily adopted by residents but not when simply suggested.
Standardized radiology reporting aims to improve patient safety and accuracy by providing a clear and thorough template. The growing emphasis on structured reporting in the radiology community , which is internationally recognized , borrows from work in many areas . Universal protocols and checklists are taking hold throughout medicine: for bedside procedures, in the operating room, and for infection control in hospital units . The use of checklists has been found to decrease catheter-related septicemia by more than five-fold , surgical hospitalization complications by more than one-third to one-half , and overall anesthesia-related mortality . Such checklists, inspired by safety measures enacted in the airline industry, have been advocated for radiology reporting . Specific areas of radiology have benefited from efforts at standardizing terminology, recommendations and reporting, such as through the Breast Imaging Reporting and Data Systems, the developing Liver Imaging Reporting and Data Systems, and the Fleischner Society guidelines for pulmonary nodules . Similarly, there are ongoing efforts to standardize reporting language, for instance the RadLex database .
Although there is increasing evidence that radiologists and referrers prefer structured reporting , universal reporting standards are in variable states of maturity in the field of radiology, and the inconsistency of reporting style and language remains a concern. One study found 14 terms used to describe the same entity on chest radiographs . The clarity of reports is paramount in providing valuable information and ensuring safety .
Get Radiology Tree app to read full this article<
Get Radiology Tree app to read full this article<
Get Radiology Tree app to read full this article<
Get Radiology Tree app to read full this article<
Get Radiology Tree app to read full this article<
Get Radiology Tree app to read full this article<
Subjects and methods
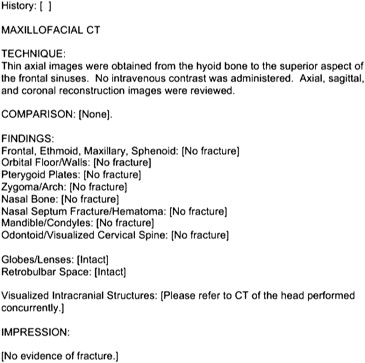
Checklist
Get Radiology Tree app to read full this article<
Get Radiology Tree app to read full this article<
Study Subjects
Get Radiology Tree app to read full this article<
Get Radiology Tree app to read full this article<
Get Radiology Tree app to read full this article<
Data Analysis
Get Radiology Tree app to read full this article<
Get Radiology Tree app to read full this article<
Table 1
Addendum Categories
Category 1: concur with interpretation, but with finding that some might have chosen not to report
Category 2: finding probably not affecting management
Category 3: finding that may affect non-ED management
Category 4: finding that may affect ED management
ED, emergency department.
Get Radiology Tree app to read full this article<
Get Radiology Tree app to read full this article<
Get Radiology Tree app to read full this article<
Get Radiology Tree app to read full this article<
Get Radiology Tree app to read full this article<
Results
Get Radiology Tree app to read full this article<
Adoption of the Checklist
Get Radiology Tree app to read full this article<
Get Radiology Tree app to read full this article<
Discrepancy Rates and Reporting Accuracy
Get Radiology Tree app to read full this article<
Table 2a
Total Percentage of Reports with Discrepancies by Category (Level of Importance)
Category 1 Category 2 Category 3 Category 4 Program A Before (11 months) 110/830 = 13.3% 51/830 = 6.1% 62/830 = 7.5% 33/830 = 4.0% After (6 months) 55/411 = 13.4% 25/411 = 6.1% 33/411 = 8.0% 19/411 = 4.6% Program B Before (12 months) 100/613 = 16.3% 31/613 = 5.1% 561/613 = 9.1% 19/613 = 3.1% After (4 months) 25/187 = 13.4% 7/187 = 3.7% 8/187 = 4.7% 3/187 = 1.6%
Table 2b
Average Discrepancy Rates Per Resident by Category
Category 1 (%) Category 2 (%) Category 3 (%) Category 4 (%) Program A Before (11 months) 10.8 6.1 7.7 3.0 After (6 months) 10.5 8.0 6.7 6.3 Program B Before (12 months) 16.2 2.7 9.1 2.3 After (4 months) 13.4 2.9 4.0 2.8
Get Radiology Tree app to read full this article<
Get Radiology Tree app to read full this article<
Table 2c
Total Percentage of Reports with Discrepancies by Category (Level of Importance, Including Only Adherent Reports after Introducing the Checklist at Program A Alone)
Program A Category 1 Category 2 Category 3 Category 4 Before (11 months) 104/792 = 13.1% 66/792 = 8.3% 58/792 = 7.3% 33/792 = 4.2% After (6 months) 52/385 = 13.5% 24/385 = 6.2% 33/385 = 8.6% 19/385 = 4.9%
Get Radiology Tree app to read full this article<
Background Discrepancy Rate
Get Radiology Tree app to read full this article<
Subgroup Analysis
Frequently missed entities
Get Radiology Tree app to read full this article<
Table 3
Miss Rates for Specific Entities
Program A Program B Before After Before After Category 4 Extraocular muscle distortion 4 = 0.49% 8 = 2.0% 2 = 0.30% 1 = 0.53% Nasal septum hematoma 3 = 0.37% 7 = 1.7% 4 = 0.60% 0 Pterygoid plate fracture 2 = 0.25% 2 = 0.5% 2 = 0.30% 0 Missed acute fracture 10 = 1.2% 9 = 0.2% 20 = 3.0% 2 = 1.1% Abscess 0 1 = 0.25% 1 = 0.15% 1 = 0.53% Foreign body 0 1 = 0.25% 0 0 Category 3 Questionable retrobulbar hematoma 1 = 0.12% 2 = 0.5% 1 = 0.15% 0 Additional acute fractures 26 = 3.2% 25 = 2.2% 19 = 2.9% 2 = 1.1% Nasal septum perforation 9 = 1.1% 0 8 = 1.2% 3 = 1.6% Nasal septum fracture 7 = 0.86% 8 = 2.0% 4 = 0.60% 0 Thyroid nodules 0 0 1 = 0.15% 0 Category 2 Acute nasal bone fracture 9 = 1.1% 11 = 2.7% 12 = 1.8% 1 = 1.1 Fracture extension 4 = 0.49% 4 = 1.0% 4 = 0.6% 0 Fracture extension into inferior orbital fissure 1 = 0.12% 1 = 0.25% 1 = 0.15% 0 Sinus ostiomeatal obstruction 5 = 0.62% 3 = 0.7% 0 0 Prominent lymph nodes 2 = 0.25% 4 = 1.0% 2 = 0.3% 2 = 1.1% Category 1 Healed nasal bone fractures 12 = 1.5% 1 = 0.25% 9 = 1.4% 2 = 1.1% Dental disease 3 = 0.37% 0 3 = 4.6% 0 Temporomandibular arthrosis 3 = 0.37% 2 = 0.5% 3 = 3.6% 2 = 1.1% Cervical spine degenerative disease 2 = 0.25% 1 = 0.25% 1 = 0.15% 1 = 0.53% Total 103 80 97 18 103/813 = 12.7% 80/404 = 19.8% ( P < .002) 97/659 = 14.7% 18/189 = 9.5%
Get Radiology Tree app to read full this article<
Soft tissue–related discrepancies
Get Radiology Tree app to read full this article<
Table 4
Soft Tissue Discrepancies
Program A Program B Before After Before After Total soft tissue discrepancies Total percentage of misses 54/128 = 42.2% 61/110 = 55.5% 47/109 = 43.1% 23/39 = 59% Total percentage of all reports 54/813 = 6.6% 61/404 = 15.1% 47/659 = 7.1% 23/189 = 12.2% Category 3 soft tissue discrepancies Category 3 percentage of all reports 11/813 = 1.4% 2/404 = 0.5% 11/659 = 1.7% 3/189 = 1.6% Category 4 soft tissue discrepancies Category 4 percentage of all reports 9/813 = 1.1% 17/404 = 4.2% ( P < .001) 7/659 = 1.1% 2/189 = 1.1%
Get Radiology Tree app to read full this article<
Get Radiology Tree app to read full this article<
Level of training
Get Radiology Tree app to read full this article<
Get Radiology Tree app to read full this article<
Discussion
Get Radiology Tree app to read full this article<
Get Radiology Tree app to read full this article<
Get Radiology Tree app to read full this article<
Get Radiology Tree app to read full this article<
Get Radiology Tree app to read full this article<
Get Radiology Tree app to read full this article<
Get Radiology Tree app to read full this article<
Get Radiology Tree app to read full this article<
Get Radiology Tree app to read full this article<
Get Radiology Tree app to read full this article<
Get Radiology Tree app to read full this article<
Get Radiology Tree app to read full this article<
Get Radiology Tree app to read full this article<
Get Radiology Tree app to read full this article<
References
1. Flanders A.E., Lakhani P.: Radiology reporting and communications: a look forward. Neuroimaging Clin N Am 2012; 22: pp. 477-496.
2. Bosmans J.M., Peremans L., Menni M., et. al.: Structured reporting: if, why, when, how-and at what expense? Results of a focus group meeting of radiology professionals from eight countries. Insights Imaging 2012; 3: pp. 295-302.
3. Bosk C.L., Dixon-Woods M., Goeschel C.A., et. al.: Reality check for checklists. Lancet 2009; 374: pp. 444-445.
4. Weiser T.G., Haynes A.B., Lashoher A., et. al.: Perspectives in quality: designing the WHO Surgical Safety Checklist. Int J Qual Health Care 2010; 22: pp. 365-370.
5. Berenholtz S.M., Pronovost P.J., Lipsett P.A., et. al.: Eliminating catheter-related bloodstream infections in the intensive care unit. Crit Care Med 2004; 32: pp. 2014-2020.
6. Pronovost P., Needham D., Berenholtz S., et. al.: An intervention to decrease catheter-related bloodstream infections in the ICU. N Eng J Med 2006; 355: pp. 2725-2732.
7. Weiser T.G., Haynes A.N., Dziekan G., et. al.: Effect of a 19-item surgical safety checklist during urgent operations in a global patient population. Ann Surg 2010; 251: pp. 976-980.
8. De Vries E.N., Prins H.A., Crolla R.M., et. al.: Effect of a comprehensive surgical safety system on patient outcomes. N Engl J Med 2010; 363: pp. 1928-1937.
9. Ziewacz J.E., Arriage A.F., Badar A.M., et. al.: Crisis checklists for the operating room: development and pilot testing. J Am Coll Surg 2011; 213: pp. 212-219.
10. Staender S.E.A., Mahajan R.P.: Anesthesia and patient safety: have we reached our limits?. Curr Opin Anesthesiol 2011; 24: pp. 349-353.
11. Levin D.C.: Checklists: from the cockpit to the radiology department. J Am Coll Radiol 2012; 9: pp. 388-390.
12. Burnside E.S., Sickles E.A., Bassett L.W., et. al.: The ACR BI-RADS experience: learning from history. J Am Coll Radiol 2009; 6: pp. 851-860.
13. LI-RADS enables standardized interpretation, reporting of HCC. RSNA News 2012; 22: pp. 13-14.
14. MacMahon H., Austin J.H., Gamsu G., et. al., Fleischner Society: Guidelines for management of small pulmonary nodules detected on CT scans: a statement from the Fleischner Society. Radiology 2005; 237: pp. 395-400.
15. Rubin D.L.: Creating and curating a terminology for radiology: ontology modeling and analysis. J Digit Imaging 2008; 21: pp. 355-362.
16. Sobel J., Pearson M., Gross K., et. al.: Information content and clarity of radiologists’ reports for chest radiography. Acad Radiol 1996; 3: pp. 709-717.
17. Dunnick N.R., Langlotz C.P.: The radiology report of the future: a summary of the 2007 Intersociety Conference. J Am Coll Radiol 2008; 5: pp. 626-629.
18. Kahn C.E., Langlotz C.P., Burnside E.S., et. al.: Towards best practices in radiology reporting. Radiology 2009; 252: pp. 852-856.
19. Graber M.L., Wachter R.M., Cassel C.K.: Bringing diagnosis into the quality and safety equations. JAMA 2012 26; 308: pp. 1211-1212.
20. Larson D.B., Towbin A.J., Pryor R.M., et. al.: Improving consistency in radiology reporting through the use of department-wide standardized structured reporting. Radiology 2013; 267: pp. 240-250.
21. Schwartz L.H., Panicek D.M., Berk A.R., et. al.: Improving communication of diagnostic radiology findings through structured reporting. Radiology 2011; 260: pp. 174-181.
22. Langlotz C.P.: Structured radiology reporting: are we there yet?. Radiology 2009; 253: pp. 23-25.
23. Weiss D.L., Langlotz C.P.: Structured reporting: patient care enhancement or productivity nightmare?. Radiology 2008; 249: pp. 739-747.
24. Sistrom C.L., Honeyman-Buck J.: Free text versus structured format: information transfer efficiency of radiology reports. AJR Am J Roentgenol 2005; 185: pp. 804-812.
25. Johnson A.J., Chen M.Y., Swan J.S., et. al.: Cohort study of structured reporting compared with conventional dictation. Radiology 2009; 253: pp. 74-80.
26. Martino A.: Sketching a new reality: what will the radiology report of the future look like?. ACR Bulletin 2012; pp. 14-16.
27. Chung J.H., Strigel R.M., Chew A.R., et. al.: Overnight resident interpretation of torso CT at a level 1 trauma center an analysis and review of the literature. Acad Radiol 2009; 16: pp. 1155-1160.
28. Jackson V.P., Cushing T., Abujudeh H.H., et. al.: RADPEER scoring white paper. J Am Coll Radiol 2009; 6: pp. 21-25.
29. Ruma J., Klein K.A., Chong S., et. al.: Cross-sectional examination interpretation discrepancies between on-call diagnostic radiology residents and subspecialty faculty radiologists: analysis by imaging modality and subspecialty. J Am Coll Radiol 2011; 8: pp. 409-414.
30. Maloney E., Lomasney L.M., Schomer L.: Application of the RADPEER™ scoring language to interpretation discrepancies between diagnostic radiology residents and faculty radiologists. J Am Coll Radiol 2012; 9: pp. 264-269.
31. DeCorato D.R., Kagetsu N.J., Ablow R.C.: Off-hours interpretation of radiologic images of patients admitted to the emergency department: efficacy of teleradiology. AJR Am J Roentgenol 1995; 165: pp. 1293-1296.
32. Okuda Y., Bryson E.O., DeMaria S., et. al.: The utility of simulation in medical education: what is the evidence?. Mt Sinai J Med 2009; 76: pp. 330-343.