
Rationale and Objectives
We sought to determine the relationship between tumor blood flow and glucose uptake in head and neck tumors using perfusion computed tomography (PCT) and fluorine-18-fluorodeoxyglucose (FDG) positron emission tomography (PET).
Materials and Methods
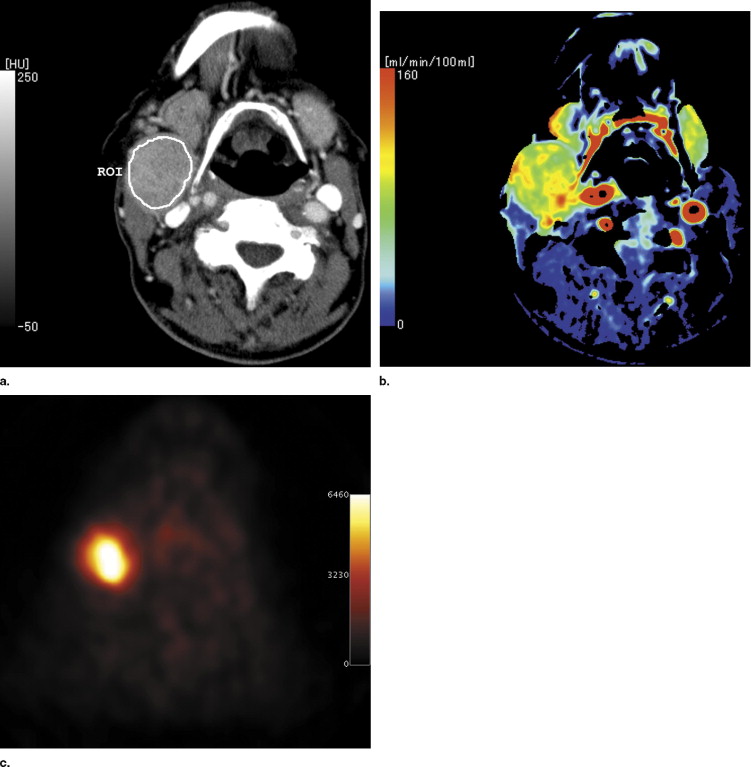
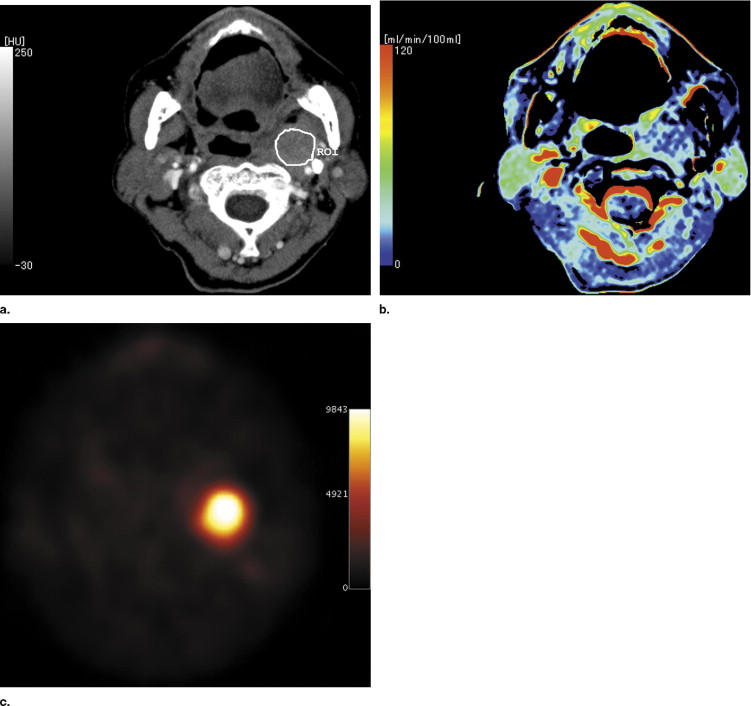
Institutional review board approval and informed consent were obtained for this study. Sixteen patients (mean age, 67 years; age range, 36–89 years) who had known or suspected head and neck tumors (15 malignant tumors and one schwannoma) underwent PCT and FDG PET examinations. Tumor area was measured on conventional CT images. The PCT data were postprocessed using maximum slope method analysis, and standardized uptake value (SUV) was measured on FDG PET.
Results
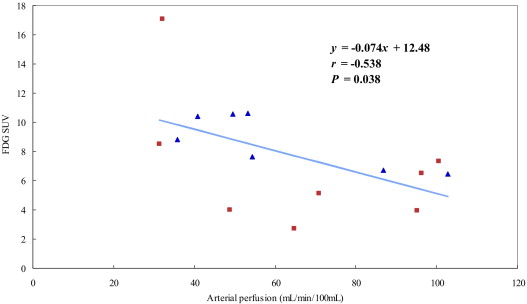
Mean arterial perfusion of the tumors was 61.56 mL/min/100 mL (range 22.17–102.7 mL/min/100 mL), and mean FDG SUV was 7.48 (range 2.74–17.1). A significant negative correlation between arterial perfusion and FDG SUV was found for malignant tumors ( r = −0.538, P = .04, n = 15).
Conclusion
There was an inverse relationship between arterial perfusion and glucose uptake of head and neck malignant tumors, suggesting that the malignant tumors may depend on anaerobic glycolysis.
Computed tomography (CT) is widely used as a noninvasive method to evaluate head and neck tumors. CT is based on anatomic information. Besides an anatomical analysis, a functional analysis of CT is also possible with use of perfusion CT (PCT) technique. Contrast-enhanced dynamic CT provides quantitative information about blood flow noninvasively. In general, the active portion of malignant tumors exhibit increases perfusion because of their neovascularization. PCT has been used to measure in vivo blood flow in various types of tumors ( ).
Positron emission tomography (PET) is also a functional imaging method. There are various PET tracers including, but not limited to, fluorine-18-fluorodeoxyglucose (FDG; 8, 9), to measure glucose uptake; fluorine-18-fluoroerythronitroimidazole (FETNIM; 10, 11) and fluorine-18-fluoromisonimidazole (FMISO; 12, 13), to measure tissue oxygenation; and [ 15 O]H 2 O ( ) to measure blood flow. Malignant tissues are hypermetabolic compared to normal tissue, and the metabolic rate of glucose is not an exception. FDG, an analog of glucose that is metabolized in viable cells by the same pathways as glucose, is known to have a higher uptake in various malignant tumors compared to normal tissue ( ).
Get Radiology Tree app to read full this article<
Materials and methods
Patients
Get Radiology Tree app to read full this article<
Get Radiology Tree app to read full this article<
CT Imaging
Get Radiology Tree app to read full this article<
Get Radiology Tree app to read full this article<
Arterial perfusion(mL/min/100mL)=Peak gradientof the tumortime-attenuationcurve/Peakarterial CT number increase Arterial perfusion
(
mL
/
min
/
100
mL
)
=
Peak gradient
of the tumor
time-attenuation
curve
/
Peak
arterial CT number increase
Get Radiology Tree app to read full this article<
Get Radiology Tree app to read full this article<
FDG PET Imaging
Get Radiology Tree app to read full this article<
Get Radiology Tree app to read full this article<
SUV=radioactivity concentration inthe ROI(MBq/g)/[injected dose(MBq)/patient’s body weight(g)] SUV
=
radioactivity concentration in
the ROI
(
MBq
/
g
)
/
[
injected dose
(
MBq
)
/
patient’s body weight
(
g
)
]
Get Radiology Tree app to read full this article<
Get Radiology Tree app to read full this article<
Statistical Analysis
Get Radiology Tree app to read full this article<
Results
Get Radiology Tree app to read full this article<
Table 1
Values for Head and Neck Tumors
Tumor Arterial Perfusion (mL/min/100 mL) FDG SUV Area (cm 2 ) All tumors (n = 16) 61.56 ± 27.3 7.48 ± 3.61 7.00 ± 5.65 Malignant tumors (n = 15) 64.18 ± 26.04 7.57 ± 2.99 ⁎ 7.45 ± 5.88 †
Data are given as mean ± SD.
Get Radiology Tree app to read full this article<
Get Radiology Tree app to read full this article<
Get Radiology Tree app to read full this article<
Get Radiology Tree app to read full this article<
Get Radiology Tree app to read full this article<
Get Radiology Tree app to read full this article<
Get Radiology Tree app to read full this article<
Discussion
Get Radiology Tree app to read full this article<
Table 2
Correlation Between Arterial Perfusion and Glucose Uptake Measurement of Malignant Tumors
Study Method to Calculate Perfusion (method) Species, Organ Size No. of Cases Negative correlation Stewart et al., 2006 ( ) Dynamic CT (deconvolusion) Rabbit, liver 2.99 ± 0.9 cm 20 Fukuda et al., 2004 ( ) 15 O-PET (one-compartment model) Human, liver NA 13 Current study Dynamic CT (maximum slope) Human, head or neck 7.45 ± 5.88 cm 2 15 Positive correlation Mankoff et al., 2002 ( ) 15 O-PET (one-compartment model) Human, breast 4.9 cm, range, 1.9–11 cm 37 Tateishi et al., 2002 ( ) Dynamic CT (gamma curve fitting) Human, lung 2.6 ± 0.2 cm 40
NA, not applicable.
Get Radiology Tree app to read full this article<
Get Radiology Tree app to read full this article<
Get Radiology Tree app to read full this article<
Get Radiology Tree app to read full this article<
Get Radiology Tree app to read full this article<
Get Radiology Tree app to read full this article<
Conclusion
Get Radiology Tree app to read full this article<
References
1. Hermans R., Lambin Ph, Van der Goten A., et. al.: Tumoural perfusion as measured by dynamic computed tomography in head and neck carcinoma. Radiother Oncol 1999; 53: pp. 105-111.
2. Tateishi U., Nishimura H., Tsukamoto E., Morikawa T., Tamaki N., Miyasaka K.: Lung tumors evaluated with FDG-PET and dynamic CT: the relationship between vascular density and glucose metabolism. J Comput Assist Tomogr 2002; 26: pp. 185-190.
3. Tsushima Y., Funabasama S., Aoki J., Sanada S., Endo K.: Quantitative perfusion map of malignant liver tumors, created from dynamic computed tomography data. Acad Radiol 2004; 11: pp. 215-223.
4. Stewart E.E., Chen X., Hadway J., Lee T.Y.: Correlation between hepatic tumor blood flow and glucose utilization in a rabbit liver tumor model. Radiology 2006; 239: pp. 740-750.
5. Hermans R., Meijerink M., Van den Bogaert W., Rijnders A., Weltens C., Lambin P.: Tumor perfusion rate determined noninvasively by dynamic computed tomography predicts outcome in head-and-neck cancer after radiotheraphy. Int J Radiat Oncol Biol Phys 2003; 57: pp. 1351-1356.
6. Quan-Sing Ng., Goh V., Fichte H., et. al.: Lung cancer perfusion at multi-detector row CT: reproducibility of whole tumor quantitative measurements. Radiology 2006; 239: pp. 547-553.
7. Meijerink M.R., van Cruijsen H., Hoekman K., et. al.: The use of perfusion CT for the evaluation of therapy combining AZD2171 with gefitinib in cancer patients. Eur Radiol 2006; Epub ahead of print
8. Keyes J.W., Watson N.E., Williams D.W., Greven K.M., McGuirt W.F.: FDG PET in head and neck cancer. AJR Am J Roentgenol 1997; 169: pp. 1663-1669.
9. Fukuda K., Taniguchi H., Koh T., Kunishima S., Yamagishi H.: Relationships between oxygen and glucose metabolism in human liver tumours: Positron emission tomography using 15 O and 18 F-deoxyglucose. Nucl Med Commun 2004; 25: pp. 577-583.
10. Lehtiö K., Oikonen V., Grönroos T., et. al.: Imaging of blood flow and hypoxia in head and neck cancer: initial evaluation with [ 15 O]H 2 O and [ 18 F]fluoroerythronitromidazole PET. J Nucl Med 2001; 42: pp. 1643-1652.
11. Lehtiö K., Eskola O., Viljanen T., et. al.: Imaging perfusion and hypoxia with PET to predict radiotherapy response in head-and-neck cancer. Int J Radiat Oncol Biol Phys 2004; 59: pp. 971-982.
12. Sorensen M., Horsman M.R., Cumming P., Munk O.L., Keiding S.: Effect of intratumoral heterogeneity in oxygenation status on FMISO PET, autoradiography, and electrode PO 2 measurements in murine tumors. Int J Radiat Onol Biol Phys 2005; 62: pp. 854-861.
13. Rajendran J.G., Schwartz D.L., O’Sullivan J., et. al.: Tumor hypoxia imaging with [F-18]fluoromisonidazole positron emission tomography in head and neck cancer. Clin Cancer Res 2006; 12: pp. 5435-5441.
14. Delbeke D.: Oncological applications of FDG PET imaging. J Nucl Med 1999; 40: pp. 1706-1715.
15. McGuirt W.F., Greven K., Williams D., et. al.: PET scanning in head and neck oncology: A review. Head Neck 1998; 20: pp. 208-215.
16. Miles K.A., Hayball M., Dixon A.K.: Colour perfusion imaging: A new application of computed tomography. Lancet 1991; 337: pp. 643-645.
17. Tsushima Y., Funabasama S., Sanada S., Aoki J., Endo K.: Development of perfusion CT software for personal computers. Acad Radiol 2002; 9: pp. 922-926.
18. Nakashige A., Horiguchi J., Tamura A., Asahara T., Shimamoto F., Ito K.: Quantitative measurement of hepatic portal perfusion by multidetector row CT with compensation for respiratory misregistration. Br J Radiol 2004; 77: pp. 728-734.
19. Mankoff D.A., Dunwald L.K., Gralow J.R., et. al.: Blood flow and metabolism in locally advanced breast cancer: Relationship to response of therapy. J Nucl Med 2002; 43: pp. 500-509.
20. Kallinowski F., Schlenger K.H., Kloes M., Stohrer M., Vaupel P.: Tumor blood flow: The principal modulator of oxidative and glycolytic metabolism, and of the metabolic micromilieu of human tumor xenografts in vivo. Int J Cancer 1989; 44: pp. 266-272.
21. Chapman J.D., Zanzonico P., Ling C.C.: On measuring hypoxia in individual tumors with radiolabeled agents. J Nucl Med 2001; 42: pp. 1653-1655.
22. Branstetter B.F.4th, Blodgett T.M., Zimmer L.A., et. al.: Head and neck malignancy: Is PET/CT more accurate than PET or CT alone?. Radiology 2005; 235: pp. 580-586.
23. Schöder H., Yeung H.W., Gonen M., Kraus D., Larson S.M.: Head and neck cancer: Clinical usefulness and accuracy of PET/CT image fusion. Radiology 2004; 231: pp. 65-72.
24. Jeong H.S., Baek C.H., Son Y.I., et. al.: Use of integrated 18 F-FDG PET/CT to improve the accuracy of initial cervical nodal evaluation in patients with head and neck squamous cell carcinoma. Head Neck 2006; Epub ahead of print
25. Rumboldt Z., Al-Okaili R., Deveikis J.P.: Perfusion CT for head and neck tumors: Pilot study. AJNR Am J Neuroradiol 2005; 26: pp. 1178-1185.