
Rationale and Objectives
In general functional magnetic resonance imaging (fMRI) analysis, the task onset time of the statistical model is typically set according to the timing of stimulation. In this study, using a high temporal resolution fMRI data, we examined the way of dynamically visualizing the difference in the activation timing between the brain activation areas by analyzing the task onset time of the statistical model shifted from the actual stimulation timing.
Materials and Methods
fMRI data with high temporal resolution was acquired using 3 T magnetic resonance imaging for 10 right-handed healthy volunteers. While being scanned, the volunteers completed a task that comprised two sets of a rest and right hand grip movement task. Statistical Parametric Mapping 12 (SPM12) software was used to analyze fMRI data. After preprocessing, statistical analyses were performed by shifting the task onset time on the statistical model by about 1 second forward or backward from the actual stimulation timing. Activation maps of multiple time phases were then created.
Results
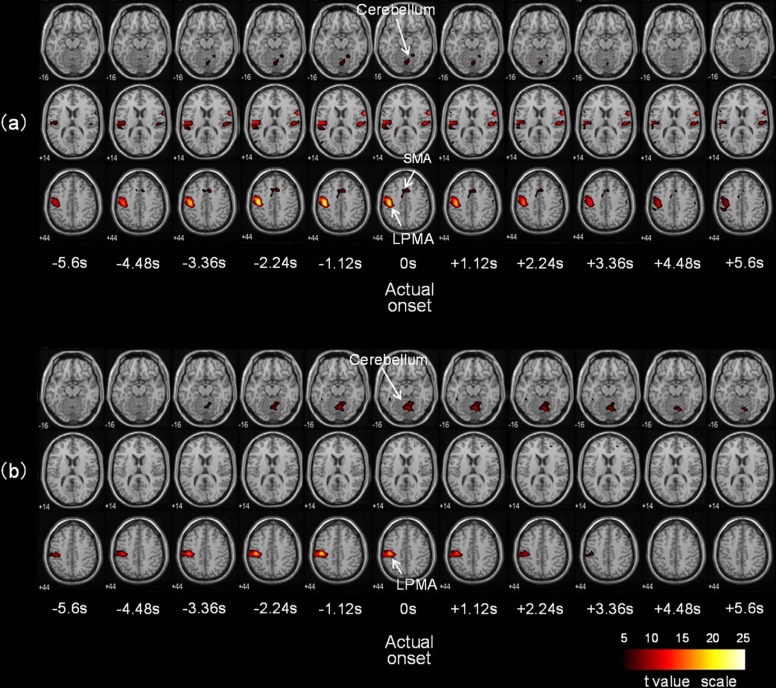
Activity was observed to the left of the primary motor area and the supplementary motor area and to the right of the cerebellum (familywise error rate, P < .05). In the right hand grip movement, the primary motor area and the supplementary motor area were activated from 1.12 to 4.48 seconds earlier than the cerebellum.
Conclusions
Using this analysis method, we visualized the differences in activation timings of different areas of the brain.
Introduction
Blood-oxygen-level-dependent functional magnetic resonance imaging (fMRI) is used as a method for noninvasively observing brain activity . Compared to other brain function measurement methods such as positron emission computed tomography and near-infrared spectroscopy , fMRI holds certain advantages. These include the absence of radiation exposure, good tissue contrast, and a high spatial resolution. However, as fMRI takes at least about 2–3 seconds to image the whole brain, the time resolution is inferior to that of near-infrared spectroscopy (10 Hz), magnetoencephalography, and electroencephalography (on the order of milliseconds) . For this reason, in conventional fMRI, activated areas can be identified while an activity is performed; however, it is not possible to detect the difference between activation timings of multiple brain areas. In recent years, the three-dimensional (3D) Principle of Echo Shifting with a Train of Observations (PRESTO) pulse sequence with sensitivity encoding (SENSE) has been developed . PRESTO allows for repetition time shorter than echo time by using echo shifting, and it can scan whole brain at about 500 milliseconds combined with SENSE. Because of this development, it may be possible to analyze temporal changes of brain activation areas using fMRI.
Statistical analysis of fMRI information is generally performed using time series data, following the application of a stimulus (a task) and a rest phase. This information is then used to model the signal changes, which are estimated from the timing of the stimulus (task onset time ). The task onset time is generally set according to the timing at which the task was applied. In this paper, we investigated whether the activation dynamics of brain function can be evaluated using multiple time phase activation maps obtained from high temporal resolution fMRI data. We propose a method for data analysis by shifting the task onset time away from the actual stimulus input timing. By creating activation maps of multiple time phases, we attempted to trace the activation dynamics.
Materials and Methods
Subjects
Get Radiology Tree app to read full this article<
Image Acquisition
Get Radiology Tree app to read full this article<
Get Radiology Tree app to read full this article<

Get Radiology Tree app to read full this article<
Image Analysis
Get Radiology Tree app to read full this article<
Get Radiology Tree app to read full this article<
Get Radiology Tree app to read full this article<
Results
Get Radiology Tree app to read full this article<
Get Radiology Tree app to read full this article<
TABLE 1
The Maximum T Values of Each Region for Two Typical Cases
Subject No. Area Location Shifted Time From Actual Task Onset Time (seconds) −6.7 −5.6 −4.5 −3.4 −2.2 −1.1 0 1.1 2.2 3.4 4.5 5.6 6.7 2 LPMA (−36,−16,64) 8.1 10.4 14.2 18.4 21.9 24.4 25.3 23.6 20.3 17.0 14.4 12.3 10.7 SMA (−8,−4,52) — 4.8 6.7 8.4 9.6 10.2 10.3 10.0 9.5 8.9 8.3 7.7 7.2 CER (20,-52,-20) — 4.8 6.0 7.0 7.6 7.8 7.7 7.3 6.8 6.3 5.7 5.1 — 7 LPMA (−46,−24,50) 6.8 8.4 10.6 13.6 17.4 20.1 18.6 14.4 10.4 7.4 5.1 — — SMA — — — — — — — — — — — — — CER (4,−66,−16) — — — 5.6 6.8 7.8 8.3 8.3 7.8 7.1 6.2 5.3 —
CER, right cerebellum; LPMA, left primary motor area left primary motor area; SMA, supplementary motor area; —, not detected in the activation.
Get Radiology Tree app to read full this article<
Get Radiology Tree app to read full this article<
Get Radiology Tree app to read full this article<
Discussion
Get Radiology Tree app to read full this article<
Get Radiology Tree app to read full this article<
Get Radiology Tree app to read full this article<
Get Radiology Tree app to read full this article<
Get Radiology Tree app to read full this article<
Conclusions
Get Radiology Tree app to read full this article<
Acknowledgments
Get Radiology Tree app to read full this article<
References
1. Ogawa S., Lee T.M., Kay A.R., et. al.: Brain magnetic resonance imaging with contrast dependent on blood oxygenation. Proc Natl Acad Sci USA 1990; 87: pp. 9868-9872.
2. Duyn J.H., Yang Y., Frank J.A., et. al.: Functional magnetic resonance neuroimaging data acquisition techniques. Neuroimage 1996; 4: pp. S76-S83.
3. Kollias S.S., Valavanis A., Golay X., et. al.: Functional magnetic resonance imaging of cortical activation. Int J Neuroradiol 1996; 2: pp. 450-472.
4. Villringera A., Plancka J., Hockb C., et. al.: Near infrared spectroscopy (NIRS): a new tool to study hemodynamic changes during activation of brain function in human adults. Neurosci Lett 1993; 154: pp. 101-104.
5. George J.S., Aine C.J., Mosher J.C., et. al.: Mapping function in the human brain with magnetoencephalography, anatomical magnetic resonance imaging, and functional magnetic resonance imaging. J Clin Neurophysiol 1995; 12: pp. 406-431.
6. Golay X., Pruessmann K.P., Weiger M., et. al.: PRESTO-SENSE: an ultrafast whole-brain fMRI technique. Magn Reson Med 2000; 43: pp. 779-786.
7. Klarhofer M., Dilharreguy B., van Gelderen P., et. al.: A PRESTO-SENSE sequence with alternating partial-Fourier encoding for rapid susceptibility weighted 3D MRI time series. Magn Reson Med 2003; 50: pp. 830-838.
8. Neggers S.F., Hermans E.J., Ramsey N.F.: Enhanced sensitivity with fast three dimensional blood-oxygen-level-dependent functional MRI: comparison of SENSEPRESTO and 2D-EPI at 3 T. NMR Biomed 2008; 21: pp. 663-676.
9. Ashburner J., Barnes G., Chen C.C., et. al.: SPM12 manual.2016.Functional Imaging Laboratory Wellcome Trust Centre for Neuroimaging Institute of Neurology, UCLLondon, UK
10. Maldjian J.A., Laurienti P.J., Kraft R.A., et. al.: An automated method for neuroanatomic and cytoarchitectonic atlas-based interrogation of fMRI data sets. Neuroimage 2003; 19: pp. 1233-1239.
11. Oldfield R.C.: The assessment and analysis of handedness: the Edinburgh Inventory. Neuropsychologia 1971; 9: pp. 97-113.
12. Van Gelderen P., Duyn J.H., Ramsey N.F., et. al.: The PRESTO technique for fMRI. Neuroimage 2012; 62: pp. 676-681.
13. Vallée E., Håberg A.K., Kristoffersen A.: Three-dimensional functional MRI with parallel acceleration: balanced SSFP versus PRESTO. J Magn Reson Imaging 2014; 39: pp. 656-664.
14. Lotze M., Montoya P., Erb M., et. al.: Activation of cortical and cerebellar motor areas during executed and imagined hand movements: an fMRI study. J Cogn Neurosci 1999; 11: pp. 491-501.
15. Allison J.D., Meador K.J., Loring D.W., et. al.: Functional MRI cerebral activation and deactivation during finger movement. Neurology 2000; 54: pp. 135-142.
16. Nair D.G., Purcott K.L., Fuchs A., et. al.: Cortical and cerebellar activity of the human brain during imagined and executed unimanual and bimanual action sequences: a functional MRI study. Brain Res Cogn Brain Res 2003; 15: pp. 250-260.
17. Toma K., Honda M., Hanakawa T., et. al.: Activities of the primary and supplementary motor areas increase in preparation and execution of voluntary muscle relaxation: an event-related fMRI study. J Neurosci 1999; 19: pp. 3527-3534.
18. Cunnington R., Windischberger C., Deecke L., et. al.: The preparation and execution of self-initiated and externally-triggered movement: a study of event-related fMRI. Neuroimage 2002; 15: pp. 373-385.
19. Richter W., Andersen P.M., Georgopoulos A.P., et. al.: Sequential activity in human motor areas during a delayed cued finger movement task studied by time-resolved fMRI. Neuroreport 1997; 8: pp. 1257-1261.
20. Larkman D.J., Hajnal J.V., Herlihy A.H., et. al.: Use of multicoil arrays for separation of signal from multiple slices simultaneously excited. J Magn Reson Imaging 2001; 13: pp. 313-317.