
Rationale and Objectives
The aim of this study was to investigate the effects of relative sensitivity (reader without computer-aided detection [CAD] vs stand-alone CAD) and reading mode on reader performance when using CAD software.
Materials and Methods
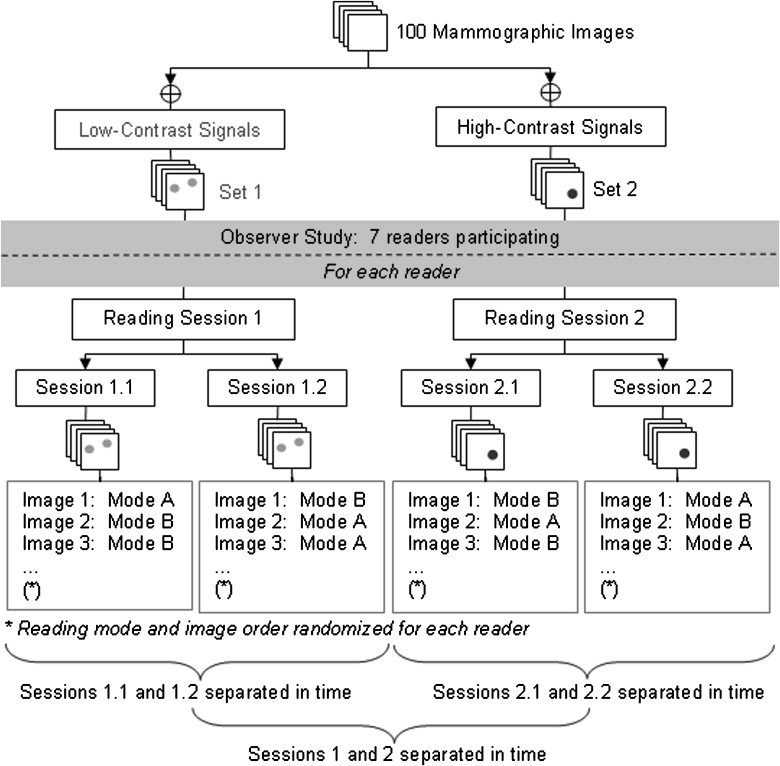
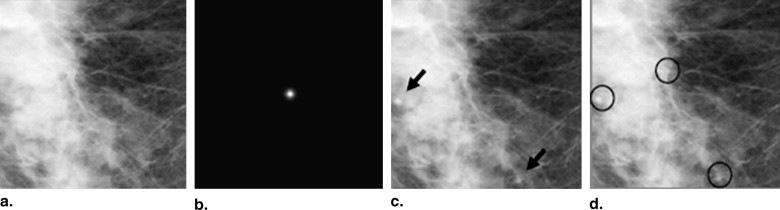
Two sets of 100 images (low-contrast and high-contrast sets) were created by adding low-contrast or high-contrast simulated masses to random locations in 100 normal mammograms. This produced a relative sensitivity, substantially less for the low-contrast set and similar for the high-contrast set. Seven readers reviewed every image in each set and specified location and probability scores using three reading modes (without CAD, second read with CAD, and concurrent read with CAD). Reader detection accuracy was analyzed using areas under free-response receiver operating characteristic curves, sensitivity, and the number of false-positive findings per image.
Results
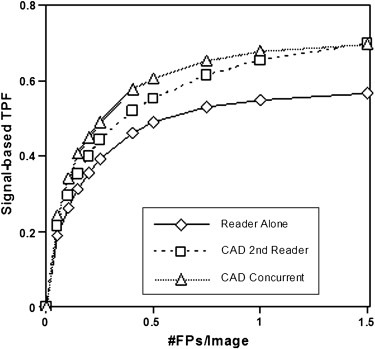
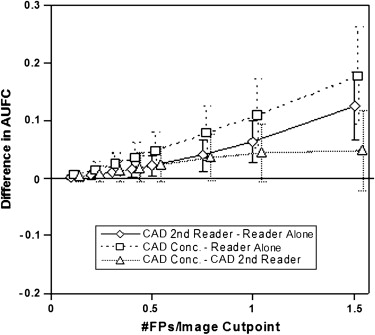
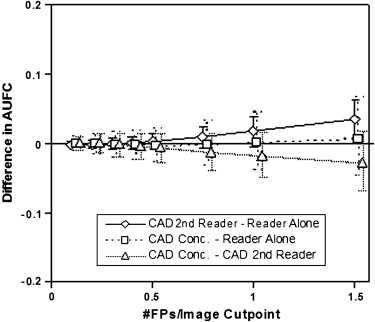
For the low-contrast set, average differences in areas under free-response receiver operating characteristic curves, sensitivity, and false-positive findings per image without CAD were 0.02, 0.12, and 0.11, respectively, compared to second read and 0.05, 0.17, and 0.09 (not statistically significant), respectively, compared to concurrent read. For the high-contrast set, average differences were 0.002 (not statistically significant), 0.04, and 0.05, respectively, compared to second read and −0.004 (not statistically significant), 0.04, and 0.08 (not statistically significant), respectively, compared to concurrent read (all differences were statistically significant except as noted). Differences were greater in the low-contrast set than the high-contrast set. Differences between second read and concurrent read were not significant.
Conclusions
Relative sensitivity is a critical factor that determines incremental improvement in reader performance when using CAD and appears to be more important than reading mode. Relative sensitivity may determine the clinical usefulness of CAD in different clinical applications and for different types of users.
Mammographic interpretation is a difficult and complex task that essentially determines the need for follow-up or biopsy . When interpreting screening mammograms, the task of the radiologist is to detect and analyze findings rapidly and only spend significant time analyzing difficult findings, if any. On average, in approximately 20% of patients with breast cancer, the cancer will be “missed” on mammographic examination . Some breast cancers are simply not mammographically visible, and breast cancers that are mammographically visible can still be missed by radiologists because of cognitive, perceptual, technical or administrative errors or some combination thereof . Even palpable breast cancers may not be mammographically visible . The limitations of mammography have been extensively discussed in the literature, including the fact that interpretive variability among radiologists represents a significant factor in breast cancer detection. The sensitivity of screening mammography ranges from approximately 60% to 100%, with specificity ranging from 35% to 98% . Small masses (particularly in patients with dense breasts) account for the vast majority of “missed cancers,” and the detection sensitivity for lesions of all types will be lower for less experienced radiologists .
Computer-aided detection (CAD) systems were introduced in mammography practice in 1998. These systems were developed to reduce errors of detection by drawing readers’ attention to areas that the software identifies as containing potential abnormalities. CAD software operates by placing “prompts” or “marks” on the mammographic images. Many studies have been conducted to determine the sensitivity of CAD software in the absence of a radiologist to correctly place marks over true abnormalities (i.e., stand-alone CAD sensitivity) as well as the stand-alone false-positive (FP) mark rate. Stand-alone testing of mammographic CAD devices has revealed high sensitivity to mark microcalcifications (approximately 95% or higher) but much lower sensitivity (approximately 70%) to mark masses. At the same time, stand-alone testing of CAD devices has revealed an FP mark rate of between two and four marks per patient (i.e., 0.5 to 1.0 marks per view of a four-view mammogram). Stand-alone testing was initially used to estimate the potential reduction of detection errors by radiologists when using CAD in clinical practice.
Get Radiology Tree app to read full this article<
Get Radiology Tree app to read full this article<
Get Radiology Tree app to read full this article<
Get Radiology Tree app to read full this article<
Materials and methods
Get Radiology Tree app to read full this article<
Get Radiology Tree app to read full this article<
Simulated Images
Get Radiology Tree app to read full this article<
Get Radiology Tree app to read full this article<
Get Radiology Tree app to read full this article<
Get Radiology Tree app to read full this article<
Get Radiology Tree app to read full this article<
CAD Algorithm
Get Radiology Tree app to read full this article<
Get Radiology Tree app to read full this article<
Table 1
Stand-alone Computer-aided Detection Performance with 95% Confidence Intervals for the Two Sets of Simulated Images
Variable Low-contrast Set High-contrast Set Image-based sensitivity 85.2% (78.7%–92.5%) 87.1% (80.0%–93.3%) Signal-based sensitivity 73.5% (67.6%–81.7%) 70.7% (63.6%–77.3%) False-positive findings per image 1.49 (1.38–1.61) 1.34 (1.16–1.50)
Get Radiology Tree app to read full this article<
Observer Study Setting
Get Radiology Tree app to read full this article<
Get Radiology Tree app to read full this article<
Get Radiology Tree app to read full this article<
Get Radiology Tree app to read full this article<
Get Radiology Tree app to read full this article<
Get Radiology Tree app to read full this article<
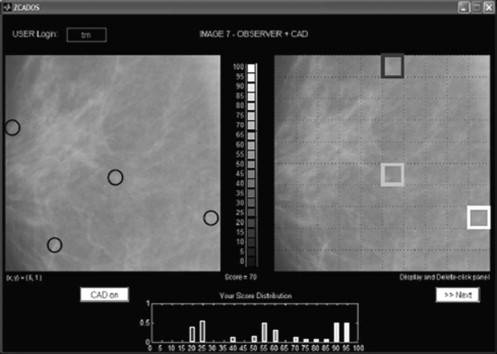
GUI
Get Radiology Tree app to read full this article<
Get Radiology Tree app to read full this article<
Get Radiology Tree app to read full this article<
Reading Conditions
Get Radiology Tree app to read full this article<
Statistical Analysis
Get Radiology Tree app to read full this article<
Get Radiology Tree app to read full this article<
Get Radiology Tree app to read full this article<
Get Radiology Tree app to read full this article<
Results
Low-contrast Set
Get Radiology Tree app to read full this article<
Table 2
Average Number of Signals Readers Identified with Scores >0 (A) and ≥ 50 (B) and the Number of Images without Any Signals (C) for the Low-contrast and High-contrast Sets
Low-contrast Set High-contrast Set Mode A B C A B C Reader alone 194.8 (112–363) 107.0 (37–204) 10.7 (0–30) 174.7 (128–226) 122.0 (94–171) 17.4 (9–27) Second reader 256.7 (175–435) 137.7 (38–227) 4.7 (0–15) 200.8 (146–262) 138.4 (105–185) 13.0 (5–20) Concurrent reader 227.4 (175–369) 139.3 (50–233) 6.8 (0–15) 192.0 (143–237) 143.6 (114–181) 15.3 (4–24)
Minimum and maximum values are given in parentheses.
Get Radiology Tree app to read full this article<
Get Radiology Tree app to read full this article<
Table 3
Detection Performance Accuracies for Reader Alone (Average Among the Seven Participating Readers), CAD Alone, and Reader with CAD as a Second Reader and as a Concurrent Reader for the Low-contrast Set
Mode Sensitivity False-positive Findings per Image Marks per Image Reader alone 42.2% (29.3%–55.5%) 0.43 (0.19–0.75) 0.96 (0.59–1.35) CAD alone 73.5% (66.5%–81.1%) 1.49 (1.38–1.60) 2.60 (2.39–2.84) Reader plus CAD Second reader 54.0% (40.4%–66.3%) 0.56 (0.28–0.88) 1.25 (0.83–1.65) Concurrent reader 59.4% (0.46%–0.72%) 0.50 (0.23–0.81) 1.31 (0.90–1.70)
CAD, computer-aided detection.
Only findings of reader alone and reader with CAD that were above the decision threshold of 50 were used in these performance estimates.
Table 4
Detection Performance Accuracies for Reader Alone (Average Among the Seven Participating Readers), CAD Alone, and Reader with CAD as a Second Reader and as a Concurrent Reader for the Low-contrast Set
Mode Sensitivity False-positive Findings per Image Marks per Image Reader alone 57.3% (48.0%–66.5%) 1.07 (0.68–1.64) 1.65 (1.24–2.18) CAD alone 73.5% (66.5%–81.1%) 1.49 (1.38–1.60) 2.60 (2.39–2.84) Reader plus CAD Second reader 71.0% (62.2%–79.5%) 1.48 (1.04–2.08) 2.21 (1.77–2.76) Concurrent reader 70.3% (62.3%–78.4%) 1.21 (0.85–1.67) 2.03 (1.63–2.56)
CAD, computer-aided detection.
All findings of reader alone and reader with CAD were used in these performance estimates.
Get Radiology Tree app to read full this article<
Get Radiology Tree app to read full this article<
Table 5
Multiple-reader Multiple-case Analysis for the Low-contrast Set (When Average Reader Sensitivity Is Less Than Stand-alone CAD Sensitivity) Using the Overall AUFC Using a Cut Point of 0.5 FP Findings per Image on the Curve and Reader Operating Point (Using 50 as the Score Threshold) as the Figures of Merit
Mode Difference in AUFC Difference in Signal-based Sensitivity Difference in Average Number of FPs per Image CAD second reader–reader alone 0.02 (0.00 to 0.04) 0.12 (0.06 to 0.18) 0.11 (0.05 to 0.18) CAD concurrent reader–reader alone 0.05 (0.01 to 0.08) 0.17 (0.11 to 0.24) 0.09 (−0.03 to 0.21) CAD concurrent reader–CAD second reader 0.02 (−0.01 to 0.05) 0.05 (0.01 to 0.10) −0.02 (−0.13 to 0.09)
AUFC, area under the free-response receiver operating characteristic curve; CAD, computer-aided detection; FP, false-positive.
Ninety-five percent confidence intervals are given in parentheses.
Get Radiology Tree app to read full this article<
High-contrast Set
Get Radiology Tree app to read full this article<
Get Radiology Tree app to read full this article<
Get Radiology Tree app to read full this article<
Table 6
Detection Performance Accuracies for Reader Alone (Average Among the Seven Participating Readers), CAD Alone, and Reader with CAD as a Second Reader and as a Concurrent Reader for the High-contrast Set
Mode Sensitivity False-positive Findings per Image Marks per Image Reader alone 75.3% (65.9%–83.8%) 0.16 (0.07–0.27) 1.22 (0.94–1.51) CAD alone 70.9% (64.0%–77.6%) 1.34 (1.19–1.50) 2.39 (2.20–2.58) Reader plus CAD Second reader 78.9% (70.4%–86.8%) 0.22 (0.11–0.34) 1.32 (1.03–1.62) Concurrent reader 79.7% (71.7%–86.5%) 0.26 (0.13–0.40) 1.37 (1.10–1.64)
CAD, computer-aided detection.
Only findings of reader alone and reader with CAD that were above the decision threshold of 50 were used in these performance estimates.
Table 7
Detection Performance Accuracies for Reader Alone (Average Among the Seven Participating Readers), CAD Alone, and Reader with CAD as a Second Reader and as a Concurrent Reader for the High-contrast Set
Mode Sensitivity False-positive Findings per Image Marks per Image Reader alone 85.2% (78.0%–91.2%) 0.49 (0.29–0.73) 1.57 (1.23–1.89) CAD alone 70.9% (64.0%–77.6%) 1.34 (1.19–1.50) 2.39 (2.20–2.58) Reader plus CAD Second reader 88.7% (81. 9%–93.9%) 0.70 (0.44–0.98) 1.78 (1.43–2.15) Concurrent reader 86.4% (79.6%–92.2%) 0.64 (0.43–0.88) 1.75 (1.44–2.06)
CAD, computer-aided detection.
All findings of reader alone and reader with CAD were used in these performance estimates.
Get Radiology Tree app to read full this article<
Get Radiology Tree app to read full this article<
Table 8
Multiple-reader Multiple-case Analysis for the High-contrast Set (When Average Reader Sensitivity Is Similar to CAD Sensitivity) Using the Overall AUFC Using a Cut Point of 0.5 FP Findings per Image on the Curve and Reader Operating Point (Using 50 as the Score Threshold) as the Figures of Merit
Mode Difference in AUFC Difference in Signal-based Sensitivity Difference in Average Number of FPs per Image CAD second reader–reader alone 0.002 (−0.008 to 0.014) 0.04 (0.01 to 0.06) 0.05 (0.02 to 0.09) CAD concurrent reader–reader alone −0.004 (−0.029 to 0.019) 0.04 (0.00 to 0.09) 0.08 (−0.01 to 0.16) CAD concurrent reader–CAD second reader −0.006 (−0.027 to 0.015) 0.01 (−0.03 to 0.05) 0.04 (−0.03 to 0.11)
AUFC, area under the free-response receiver operating characteristic curve; CAD, computer-aided detection; FP, false-positive.
Get Radiology Tree app to read full this article<
Discussion
Get Radiology Tree app to read full this article<
Get Radiology Tree app to read full this article<
Get Radiology Tree app to read full this article<
Get Radiology Tree app to read full this article<
Get Radiology Tree app to read full this article<
Get Radiology Tree app to read full this article<
Acknowledgment
Get Radiology Tree app to read full this article<
Get Radiology Tree app to read full this article<
References
1. Helvie M.: Improving mammographic interpretation: double reading and computer-aided diagnosis. Radiol Clin N Am 2007; 45: pp. 801-811.
2. Bird R.E., Wallace T.W., Yankaskas B.C.: Analysis of cancers missed at screening mammography. Radiology 1992; 184: pp. 613-617.
3. Miglioretti D.L., Smith-Bindman R., Abraham L., et. al.: Radiologist characteristics associated with interpretive performance of diagnostic mammography. J Natl Cancer Inst 2007; 99: pp. 1854-1863.
4. Huynh P.T., Jarolimek A.M., Daye S.: The false-negative mammogram. Radiographics 1998; 18: pp. 1137-1154.
5. Durfee S.M., Selland D.G., Smith D.N., et. al.: Sonographic evaluation of clinically palpable breast cancers invisible on mammography. Breast J 2000; 6: pp. 247-251.
6. Beam C., Layde P.M., Sullivan D.C.: Variability in the interpretation of screening mammograms by US radiologists. Arch Intern Med 1996; 156: pp. 209-213.
7. Kerlikowske K., Carney P.A., Geller B., et. al.: Performance of screening mammography among women with and without a first-degree relative with breast cancer. Ann Intern Med 2000; 133: pp. 855-863.
8. Warren Burhenne L.J., Wood S.A., D’Orsi C.J., et. al.: Potential contribution of computer-aided detection to the sensitivity of screening mammography. Radiology 2000; 215: pp. 554-562.
9. Brem R.F., Baum J., Lechner M., et. al.: Improvement in sensitivity of screening mammography with computer-aided detection: a multiinstitutional trial. AJR Am J Roentgenol 2003; 181: pp. 687-693.
10. Ko J.M., Nicholas M.J., Mendel J.B., Slanetz P.J.: Prospective assessment of computer-aided detection in interpretation of screening mammography. AJR Am J Roentgenol 2006; 187: pp. 1483-1491.
11. Malich A., Fischer D.R., Bottcher J.: CAD for mammography: the technique, results, current role and further developments. Eur Radiol 2006; 16: pp. 1449-1490.
12. Freer T.W., Ulissey M.J.: Screening mammography with computer-aided detection: prospective study of 12,860 patients in a community breast center. Radiology 2001; 220: pp. 781-786.
13. Gur D., Sumkin J.H., Rockette H.E., et. al.: Changes in breast cancer detection and mammography recall rates after the introduction of a computer-aided detection system. J Natl Cancer Inst 2004; 96: pp. 185-190.
14. Birdwell R.L., Bandodkar P., Ikeda D.M.: Computer-aided detection with screening mammography in a university hospital setting. Radiology 2005; 236: pp. 451-457.
15. Helvie M.A., Hadjiiski L., Makariou E., et. al.: Sensitivity of noncommercial computer-aided detection system for mammographic breast cancer detection: pilot clinical trial. Radiology 2004; 231: pp. 208-214.
16. Khoo L.A., Taylor P., Given-Wilson R.M.: Computer-aided detection in the United Kingdom National Breast Screening Programme: prospective study. Radiology 2005; 237: pp. 444-449.
17. Fenton J.J., Taplin S.H., Carney P.A., et. al.: Influence of computer-aided detection on performance of screening mammography. N Engl J Med 2007; 356: pp. 1399-1409.
18. Gilbert F.J., Astley S.M., Gillan M.G.C., et. al.: Single reading with computer-aided detection for screening mammography. N Engl J Med 2008; 359: pp. 1675-1684.
19. Astley S.M.: Evaluation of computer-aided detection (CAD) prompting techniques for mammography. Br J Radiol 2005; 78: pp. S20-S25.
20. Krupinski E.A.: The importance of perception research in medical imaging. Radiat Med 2000; 18: pp. 329-334.
21. Krupinski E.A., Nodine C.F., Kundel H.L.: A perceptually based method for enhancing pulmonary nodule recognition. Invest Radiol 1993; 28: pp. 289-294.
22. Kobayashi T., Xu X.W., MacMahon H., Metz C.E., Doi K.: Effect of a computer-aided diagnosis scheme on radiologists’ performance in detection of lung nodules on radiographs. Radiology 1996; 199: pp. 843-848.
23. Paquerault S., Wade D.I., Petrick N., Myers K.J., Samuelson F.W.: Observer evaluation of computer-aided detection: second reader versus concurrent reader scenario. SPIE Med Imaging 2007; 6515: pp. 65151N-65158N.
24. Heath M., Bowyer K., Kopans D., Moore R., Kegelmeyer W.P.: The Digital Database for Screening Mammography.Yaffe M.J.Proceedings of the Fifth International Workshop on Digital Mammography.2001.Medical Physics PublishingMadison, WI:pp. 212-218.
25. Heath M., Bowyer K., Kopans D., et. al.: Current Status of the Digital Database for Screening Mammography.Proceedings of the Fourth International Workshop on Digital Mammography.1998.Kluwer AcademicNew York:pp. 457-460.
26. Freedman M., Osicka T., Lo S.C., et. al.: The effect of database content on machine performance and radiologist performance improvement with chest CAD. Int Congr Ser 2005; 1281: pp. 1087-1092.
27. Beiden S.V., Wagner R.F., Doi K., et. al.: Independent versus sequential reading in ROC studies of computer-assist modalities: analysis of components of variance. Acad Radiol 2002; 9: pp. 1036-1043.
28. Samuelson F.W., Petrick N.: Comparing image detection algorithms using resampling.Proceedings of the IEEE International Symposium on Biomedical Imaging.2006.IEEENew York:pp. 1312-1315.