
Rationale and Objectives
The objectives of this research study were to determine the magic-angle effect on different subregions of in vivo human femoral cartilage through the quantitative assessment of the effect of static magnetic field orientation ( B 0 ) on transverse (T 2 ) relaxation time at 3.0 T.
Materials and Methods
Healthy volunteers ( n = 5; mean age, 36.4 years) and clinical patients ( n = 5; mean age, 64 years) with early osteoarthritis (OA) were scanned at 3.0-T magnetic resonance using an 8-channel phased-array knee coil (transmit-receive).
Results
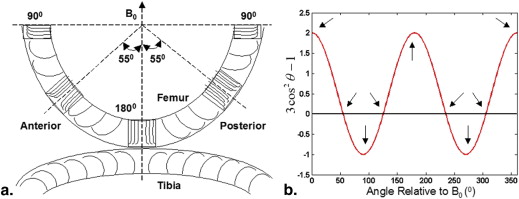
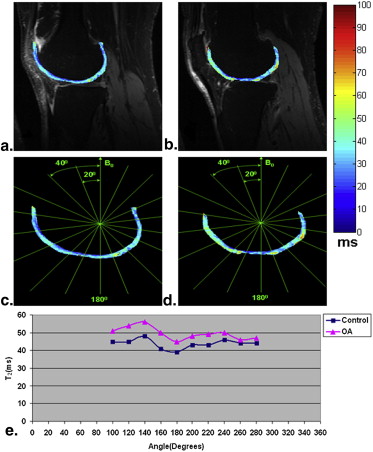
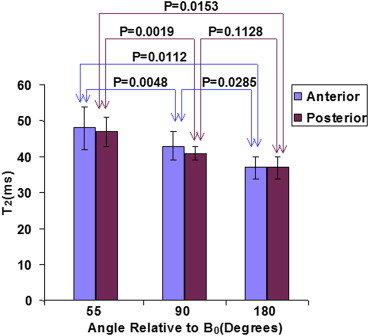
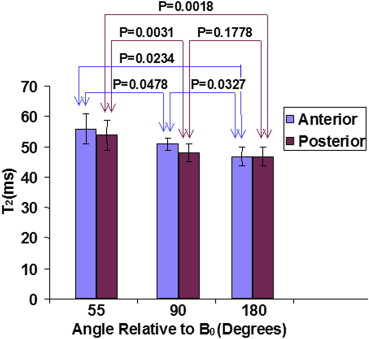
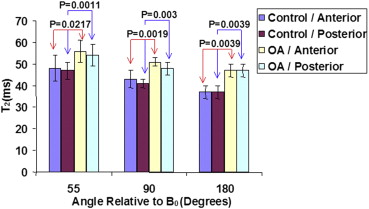
The T 2 maps revealed significantly greater values in anterior than in posterior regions. When the cartilage regions were oriented at 55° to B 0 (magic angle), the longest T 2 values were detected in comparison with the neighboring regions oriented 90° and 180° (0°) to B 0 . The subregions oriented 180° (0°) to B 0 showed the lowest T 2 values.
Conclusions
The differences in T 2 values of different subregions suggest that magic-angle effect needs to be considered when interpreting cartilage abnormalities in OA patients.
The primary macromolecules in human cartilage are collagen type II and proteoglycans. Proteoglycan is responsible for much of the compressive stiffness through electrostatic repulsion, whereas collagen provides the tensile and shear strength . The earliest biochemical changes in osteoarthritis (OA) are the modifications at the molecular level of cartilage matrix, which occur without obvious morphologic changes. The loss of glycosaminoglycan and the collagen breakdown are the typical characteristics of early OA .
Human articular cartilage is a highly ordered and depth-dependent ultrastructure and is essentially defined by the organization of the collagen fibrils . Collagen fibers in histology have three predominant organizational zones across the depth of the cartilage tissue. In the superficial (tangential) zone, the collagen fabrils are parallel to the cartilage surface, whereas in the radial (deep) zone, the fabrils are oriented perpendicular to the surface. However, in the transitional (middle/intermediate) zone, the arrangement of collagen fibers is almost random. The characteristic arrangement of collagen fibers results in the “magic-angle effect” and exhibits anisotropic properties when measured at different tissue depths and from different physical orientations in the proton magnetic resonance (MR) images .
Get Radiology Tree app to read full this article<
Get Radiology Tree app to read full this article<
Get Radiology Tree app to read full this article<
Get Radiology Tree app to read full this article<
Materials and methods
Human Subjects
Get Radiology Tree app to read full this article<
Imaging Hardware
Get Radiology Tree app to read full this article<
Imaging Protocol
Get Radiology Tree app to read full this article<
MR Images Analysis and Processing
Get Radiology Tree app to read full this article<
Get Radiology Tree app to read full this article<
Get Radiology Tree app to read full this article<
Results
Get Radiology Tree app to read full this article<
Get Radiology Tree app to read full this article<
Get Radiology Tree app to read full this article<
Get Radiology Tree app to read full this article<
Get Radiology Tree app to read full this article<
Get Radiology Tree app to read full this article<
Get Radiology Tree app to read full this article<
Get Radiology Tree app to read full this article<
Get Radiology Tree app to read full this article<
Get Radiology Tree app to read full this article<
Discussion
Get Radiology Tree app to read full this article<
Get Radiology Tree app to read full this article<
Get Radiology Tree app to read full this article<
Get Radiology Tree app to read full this article<
Get Radiology Tree app to read full this article<
Get Radiology Tree app to read full this article<
Get Radiology Tree app to read full this article<
Get Radiology Tree app to read full this article<
Get Radiology Tree app to read full this article<
Get Radiology Tree app to read full this article<
Conclusions
Get Radiology Tree app to read full this article<
Acknowledgments
Get Radiology Tree app to read full this article<
References
1. Regatte R.R., Akella S.V., Borthakur A., et. al.: Proteoglycan depletion-induced changes in transverse relaxation maps of cartilage: comparison of T2 and T1rho. Acad Radiol 2002; 9: pp. 1388-1394.
2. Menezes N.M., Gray M.L., Hartke J.R., et. al.: T2 and T1rho MRI in articular cartilage systems. Magn Reson Med 2004; 51: pp. 503-509.
3. Pakin S.K., Xu J., Schweitzer M.E., et. al.: Rapid 3D-T1rho mapping of the knee joint at 3.0T with parallel imaging. Magn Reson Med 2006; 56: pp. 563-571.
4. Borthakur A., Mellon E., Niyogi S., et. al.: Sodium and T1rho MRI for molecular and diagnostic imaging of articular cartilage. NMR Biomed 2006; 19: pp. 781-821.
5. Xia Y., Moody J.B., Alhadlaq H.: Orientational dependence of T2 relaxation in articular cartilage: a microscopic MRI (microMRI) study. Magn Reson Med 2002; 48: pp. 460-469.
6. Xia Y.: Magic-angle effect in magnetic resonance imaging of articular cartilage: a review. Invest Radiol 2000; 35: pp. 602-621.
7. Dardzinski B.J., Mosher T.J., Li S., et. al.: Spatial variation of T2 in human articular cartilage. Radiology 1997; 205: pp. 546-550.
8. David-Vaudey E., Ghosh S., Ries M., et. al.: T2 relaxation time measurements in osteoarthritis. Magn Reson Imaging 2004; 22: pp. 673-682.
9. Dunn T.C., Lu Y., Jin H., et. al.: T2 relaxation time of cartilage at MR imaging: comparison with severity of knee osteoarthritis. Radiology 2004; 232: pp. 592-598.
10. Li X., Benjamin Ma C., Link T.M., et. al.: In vivo T(1rho) and T(2) mapping of articular cartilage in osteoarthritis of the knee using 3 T MRI. Osteoarthritis Cartilage 2007; 15: pp. 789-797.
11. Erickson S.J., Prost R.W., Timins M.E.: The “magic angle” effect: background physics and clinical relevance. Radiology 1993; 188: pp. 23-25.
12. Mosher T.J., Dardzinski B.J.: Cartilage MRI T2 relaxation time mapping: overview and applications. Semin Musculoskelet Radiol 2004; 8: pp. 355-368.
13. Smith H.E., Mosher T.J., Dardzinski B.J., et. al.: Spatial variation in cartilage T2 of the knee. J Magn Reson Imaging 2001; 14: pp. 50-55.
14. Regatte R.R., Schweitzer M.E.: Ultra-high-field MRI of the musculoskeletal system at 7.0T. J Magn Reson Imaging 2007; 25: pp. 262-269.
15. Mosher T.J., Smith H., Dardzinski B.J., et. al.: MR imaging and T2 mapping of femoral cartilage: in vivo determination of the magic angle effect. AJR Am J Roentgenol 2001; 177: pp. 665-669.
16. Nieminen M.T., Menezes N.M., Williams A., et. al.: T2 of articular cartilage in the presence of Gd-DTPA2. Magn Reson Med 2004; 51: pp. 1147-1152.
17. Goodwin D.W., Dunn J.F.: High-resolution magnetic resonance imaging of articular cartilage: correlation with histology and pathology. Top Magn Reson Imaging 1998; 9: pp. 337-347.
18. Kurkijarvi J.E., Nissi M.J., Kiviranta I., et. al.: Delayed gadolinium-enhanced MRI of cartilage (dGEMRIC) and T2 characteristics of human knee articular cartilage: topographical variation and relationships to mechanical properties. Magn Reson Med 2004; 52: pp. 41-46.
19. Lammentausta E., Kiviranta P., Nissi M.J., et. al.: T2 relaxation time and delayed gadolinium-enhanced MRI of cartilage (dGEMRIC) of human patellar cartilage at 1.5 T and 9.4 T: relationships with tissue mechanical properties. J Orthop Res 2006; 24: pp. 366-374.
20. Kellgren J.H., Lawrence J.S.: Radiological assessment of osteo-arthrosis. Ann Rheum Dis 1957; 16: pp. 494-502.