
Rationale and Objectives
The aims of this study were to distinguish stents from iodinated contrast on the basis of spectral characteristics on dual-energy computed tomographic (DECT) imaging and to determine whether DECT imaging might provide a more accurate measurement of true stent lumen.
Materials and Methods
Three stainless steel stents and one cobalt chromium stent were scanned using a multidetector, single-source DECT scanner. Stents 2.5, 3.5, and 4.0 mm in diameter were filled with iodinated contrast, submerged in water, and scanned. Spectral analysis was performed to assess the separation of stents from iodinated contrast. Two independent reviewers measured stent lumen diameter and strut thickness on low-energy (L 0 ), high-energy (L 1 ), and combined-energy (L c ) images. Dual-energy full-width half-maximum edge detection analysis was used to provide an independent assessment of stent luminal diameter and strut thickness.
Results
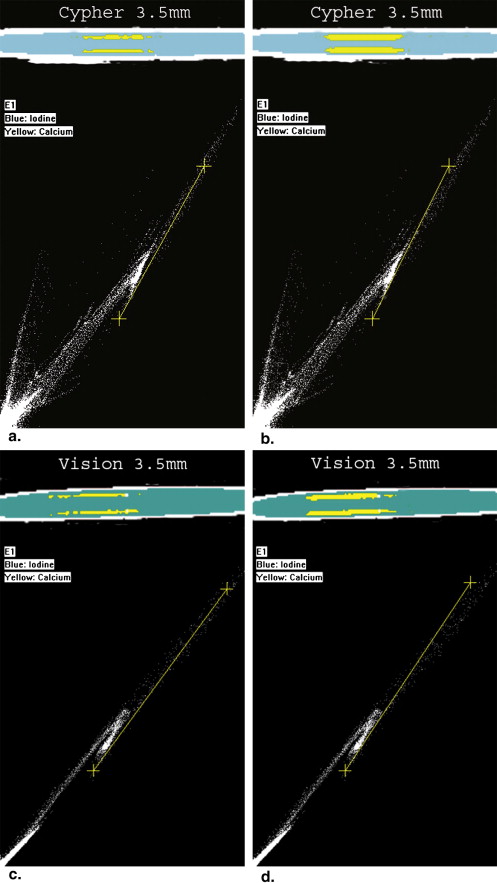
Two-dimensional graphical plots of computed tomographic attenuation for the L 0 and L 1 images did not demonstrate a sharp separation between the absorption characteristics of stents and iodinated contrast material. Stent lumens were underestimated by approximately 50% on L c images. Observer measurements on L 1 images demonstrated a 24% decrease in strut thickness and a 25% increase in stent luminal diameter compared to L 0 images ( P < .0001). Full-width half-maximum measurements did not demonstrate significant changes in stent luminal diameters or strut thicknesses between L 0 and L 1 images.
Conclusions
Spectral analysis did not clearly distinguish stents from iodinated contrast with the DECT system used in this study. The larger stent lumens visualized by the high-energy components of the x-ray spectrum were not related to improved computed tomographic delineation of stent thickness.
Computed tomographic (CT) evaluation of coronary stent restenosis is limited by blooming artifacts from high x-ray–attenuating materials, such as metal struts and mural calcium. Artifacts from high-density stent material lead to the overestimation of stent strut thickness and the underestimation of stent luminal diameter . In vitro evaluation on a four-slice scanner revealed that luminal narrowing of a stainless steel stent may be as great as 62% to 94.3% . The newer 64–detector row CT scanners provide near isotropic pixels with improved spatial resolution that can reduce blooming artifacts and minimize the importance of stent orientation compared to earlier 16-detector scanners . Nonetheless, imaging of coronary stents on computed tomography (CT) remains a technically challenging task.
Conventional CT scanners display an image on the basis of differences in the x-ray attenuation of different tissues. Dual-energy CT (DECT) imaging improves the differentiation of tissues on the basis of CT data obtained from synchronous CT acquisitions at two different energies . On the basis of the preferential absorption of photons by different materials, high-density structures such as calcium and iodine may be separated. Studies have suggested that the CT characterization of the coronary lumen , calcified coronary plaque , and the coronary stent lumen may be improved with DECT imaging. An additional advantage of DECT imaging may be related to decreases in beam-hardening and blooming artifacts in the high-energy component of DECT imaging. The present study was performed to assess in a phantom model the ability to separate stents from iodinated contrast on the basis of their distinct spectral characteristics and to determine whether DECT imaging might provide a more accurate measurement of the true stent lumen.
Materials and methods
Experimental Overview
Get Radiology Tree app to read full this article<
Data Acquisition
Stents
Get Radiology Tree app to read full this article<
Phantom Design
Get Radiology Tree app to read full this article<
DECT System
Get Radiology Tree app to read full this article<
Scanning Technique
Get Radiology Tree app to read full this article<
Data Analysis
Spectral Analysis
Get Radiology Tree app to read full this article<
Get Radiology Tree app to read full this article<
Quantitative Measurements of Stent Lumen and Strut Thickness
Get Radiology Tree app to read full this article<
Get Radiology Tree app to read full this article<
Get Radiology Tree app to read full this article<
Get Radiology Tree app to read full this article<
FWHM Measurement
Get Radiology Tree app to read full this article<
Get Radiology Tree app to read full this article<
Statistical Analysis
Get Radiology Tree app to read full this article<
Results
Spectral Analysis
Get Radiology Tree app to read full this article<
Quantitative Measurements
Get Radiology Tree app to read full this article<
Combined Conventional Imaging
Get Radiology Tree app to read full this article<
Table 1
Stent Lumen by Stent Size and Measurement Method
Stent Lumen (mm) Stent Size (mm) L c L 0 L 1 FWHM L c FWHM L 1 FWHM L 1 2.5 1.2–1.1 0.7–0.9 1.2 1.3 1.3 1.3 3.5 1.7–1.8 1.6 1.8 1.9 1.6 1.9 4 1.7 1.4 1.7 1.8 1.9 1.9
FWHM, full-width half-maximum; L c , combined-energy image; L 0 , low-energy image; L 1 , high-energy image.
Table 2
Strut Thickness by Stent Size and Measurement Method
Strut Thickness (mm) Stent Size (mm) L c L 0 L 1 FWHM L c FWHM L 1 FWHM L 1 2.5 0.9–1.0 1.1–1.3 0.8–0.9 1.0 1.0 0.9 3.5 1–1.2 1.2–1.3 0.9–1.1 1.0 1.3 1.1 4 1.0–1.1 1.1–1.4 0.9–1.0 1.2 1.2 1.1
FWHM, full-width half-maximum; L c , combined-energy image; L 0 , low-energy image; L 1 , high-energy image.
Get Radiology Tree app to read full this article<
Low-energy Versus High-energy Imaging
Get Radiology Tree app to read full this article<
Resolution Mode
Get Radiology Tree app to read full this article<
Imaging Plane
Get Radiology Tree app to read full this article<
Table 3
Stent Lumen by Stent Size and Stent Orientation Relative to Scan Plane
Stent Lumen (mm) Stent Size (mm) Imaging Plane L c L 0 L 1 2.5 Oblique 1.6 1.4 1.6 2.5 Parallel 1.1 0.6 0.9 2.5 Perpendicular 0.8 0.5 1.1 3.5 Oblique 1.8 1.7 1.8 3.5 Parallel 1.8 1.6 1.8 3.5 Perpendicular 1.7 1.5 1.8 4 Oblique 1.7 1.5 1.6 4 Parallel 1.7 1.3 1.7 4 Perpendicular 1.7 1.4 1.8
L c , combined-energy image; L 0 , low-energy image; L 1 , high-energy image.
Table 4
Strut Thickness by Stent Size and Stent Orientation Relative to Scan Plane
Strut Thickness (mm) Stent Size (mm) Imaging Plane L c L 0 L 1 2.5 Oblique 0.9 1.0 0.7 2.5 Parallel 0.9 1.2 0.9 2.5 Perpendicular 1.2 1.4 1.0 3.5 Oblique 1.0 1.2 1.0 3.5 Parallel 1.0 1.1 0.9 3.5 Perpendicular 1.3 1.5 1.2 4 Oblique 1.0 1.2 1.0 4 Parallel 1.0 1.2 0.9 4 Perpendicular 1.1 1.3 1.0
L c , combined-energy image; L 0 , low-energy image; L 1 , high-energy image.
Get Radiology Tree app to read full this article<
FWHM Measurement
Get Radiology Tree app to read full this article<
Get Radiology Tree app to read full this article<
Interobserver Correlation
Get Radiology Tree app to read full this article<
Table 5
Pearson’s Correlation Coefficients Between the Two Independent Reviewers
Variable L c L 0 L 1 Strut thickness 0.67 0.88 0.50 Stent luminal diameter 0.92 0.95 0.90 Outer stent diameter 0.90 0.93 0.95
L c , combined-energy image; L 0 , low-energy image; L 1 , high-energy image.
Get Radiology Tree app to read full this article<
Discussion
Get Radiology Tree app to read full this article<
Get Radiology Tree app to read full this article<
Get Radiology Tree app to read full this article<
Get Radiology Tree app to read full this article<
Get Radiology Tree app to read full this article<
Get Radiology Tree app to read full this article<
Get Radiology Tree app to read full this article<
Get Radiology Tree app to read full this article<
Get Radiology Tree app to read full this article<
Get Radiology Tree app to read full this article<
Get Radiology Tree app to read full this article<
References
1. Nieman K., Cademartiri F., Raaijmakers R., Pattynama P., de Feyter P.: Noninvasive angiographic evaluation of coronary stents with multi-slice spiral computed tomography. Herz 2003; 28: pp. 136-142.
2. Maintz D., Juergens K., Wichter T., Grude M., Heindel W., Fischbach R.: Imaging of coronary artery stents using multislice computed tomography: in vitro evaluation. Eur Radiol 2003; 13: pp. 830-835.
3. Mahnken A., Muhlenbruch G., Seyfarth T., et. al.: 64-slice computed tomography assessment of coronary artery stents: a phantom study. Acta Radiol 2006; 47: pp. 36-42.
4. Seifarth H., Ozgun M., Raupach R., et. al.: 64- versus 16-slice CT angiography for coronary artery stent assessment: in vitro experience. Invest Radiol 2006; 41: pp. 22-27.
5. Graser A., Johnson T.R., Chandarana H., Macari M.: Dual energy CT: preliminary observations and potential clinical applications in the abdomen. Eur Radiol 2009; 19: pp. 13-23.
6. Boll D.T., Hoffmann M.H., Huber N., Bossert A.S., Aschoff A.J., Fleiter T.R.: Spectral coronary multidetector computed tomography angiography: dual benefit by facilitating plaque characterization and enhancing lumen depiction. J Comput Assist Tomogr 2006; 30: pp. 804-811.
7. Boll D.T., Merkle E.M., Paulson E.K., Mirza R.A., Fleiter T.R.: Calcified vascular plaque specimens: assessment with cardiac dual-energy multidetector CT in anthropomorphically moving heart phantom. Radiology 2008; 249: pp. 119-126.
8. Boll D.T., Merkle E.M., Paulson E.K., Fleiter T.R.: Coronary stent patency: dual-energy multidetector CT assessment in a pilot study with anthropomorphic phantom. Radiology 2008; 247: pp. 687-695.
9. Carmi R., Naveh G., Altman A.: Material separation with dual-layer CT.Proceedings of IEEE Nuclear Science Symposium 2005.2005.IEEENew York:pp. 1876-1878.
10. Halpern E.J.: Coronary stents.Halpern E.J.Clinical cardiac CT: anatomy and function.2008.ThiemeNew York:pp. 115-129.
11. Joseph P.M., Spital R.D.: The exponential edge-gradient effect in x-ray computed tomography. Phys Med Biol 1981; 26: pp. 473-487.
12. Hong C., Chrysant G.S., Woodard P.K., Bae K.: Coronary artery stent patency assessed with in-stent contrast enhancement measured at multi-detector row CT angiography: initial experience. Radiology 2004; 233: pp. 286-291.
13. Mahnken A., Seyfarth T., Flohr T., et. al.: Flat-panel detector computed tomography for the assessment of coronary artery stents: phantom study in comparison with 16-slice spiral computed tomography. Invest Radiol 2005; 40: pp. 8-13.