
Rationale and Objectives
Cancer cells generate more lactate than normal cells under both aerobic and hypoxic conditions—exhibiting the so-called Warburg effect. However, the relationship between the Warburg effect and tumor metastatic potential remains controversial. We intend to investigate whether the higher lactate reflects higher tumor metastatic potential.
Materials and Methods
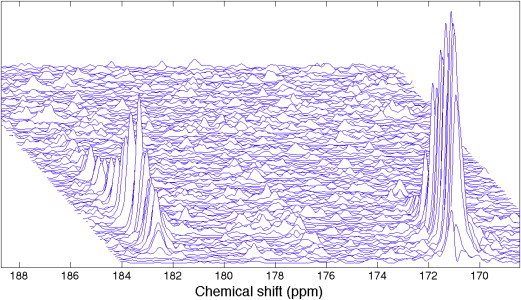
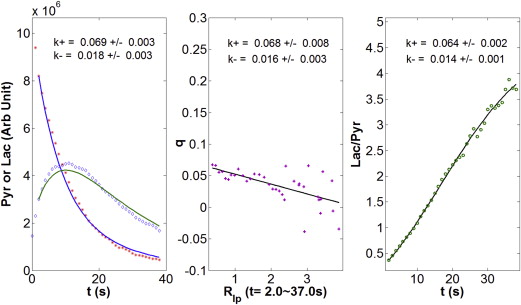
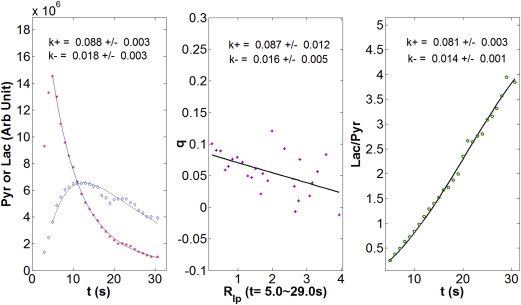
We used hyperpolarized 13 C-pyruvate magnetic resonance spectroscopy (MRS) to compare lactate 13 C-labeling in vivo in mouse xenografts of the highly metastatic (MDA-MB-231) and the relatively indolent (MCF-7) human breast cancer cell lines. We obtained the kinetic parameters of the lactate dehydrogenase (LDH)–catalyzed reaction by three methods of data analysis including the differential equation fit, q-ratio fit, and ratio fit methods.
Results
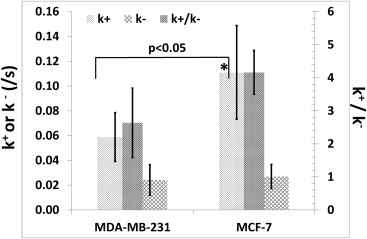
Consistent results from the three methods showed that the highly metastatic tumors exhibited a smaller apparent forward rate constant ( k + = 0.060 ± 0.004 s −1 ) than the relatively indolent tumors ( k + = 0.097 ± 0.013 s −1 ). The ratio fit generated the greatest statistical significance for the difference ( P = .02). No significant difference in the reverse rate constant was found between the two tumor lines.
Conclusions
The result indicates that the less metastatic breast tumors may produce more lactate than the highly metastatic ones from the injected 13 C-pyruvate and supports the notion that breast tumor metastatic risk is not necessarily associated with the high levels of glycolysis and lactate production. More studies are needed to confirm whether and how much the measured apparent rate constants are affected by the membrane transporter activity and whether they are primarily determined by the LDH activity.
Metastasis results in about 90% of cancer deaths. However, tumor metastatic risk determination remains one of the greatest clinical challenges because of the lack of reliable biomarkers of metastatic potential . In recent years, cancer metabolism has received increasing research attention, and abnormally high level of glycolysis and lactate production (the Warburg effect) has been recognized as the hallmark of cancer . The Warburg effect has been demonstrated by a variety of techniques in vitro, ex vivo, and in vivo with a large proportion of these studies performed with cell culture models. A few methods have been used to demonstrate the Warburg effect in tissues as well. For example, fluorodeoxyglucose–positron emission tomography (FDG-PET) detects the higher uptake and accumulation of FDG in tumors compared to normal tissue in vivo , and the magnetic resonance spectroscopy (MRS) and magnetic resonance imaging including hyperpolarized 13 C-MR techniques monitor higher 13 C-lactate production from 13 C-labeled hyperpolarized pyruvate in vivo.
It is clear that the Warburg effect discriminates cancer from nonmalignant tissues. However, it is less clear if it also accounts for the differences in cancer metastatic potential. Some studies using bioluminescence imaging of biopsies from human cancers indicate a positive correlation between tumor lactate concentration and incidence of metastasis in head and neck cancer and cervical cancer patients . Lactate levels measured by 1 H-MRS were also shown as strong indicators of tumor grade and poor prognosis in various cancers, such as brain , breast , lung , and liver cancers . In addition, a positive correlation between the hyperpolarized lactate level and prostate tumor histological grades has been observed in transgenic mouse models by hyperpolarized nuclear magnetic resonance (HP-NMR) . The hypothesis that lactate enhances tumor survival, invasiveness, and metastatic potential was supported by evidence that lactate stimulates HIF (hypoxia inducible factor)-1α accumulation and increases CD44 expression levels (associated with invasion) in both stromal fibroblasts and cancer cells . On the other hand, other studies showed that lactate levels did not correlate with the invasive/metastatic potential of the breast cancer cells or histopathologic grade of oligodendrogliomas .
Get Radiology Tree app to read full this article<
Materials and methods
Get Radiology Tree app to read full this article<
Get Radiology Tree app to read full this article<
Get Radiology Tree app to read full this article<
Get Radiology Tree app to read full this article<
Pyruvate↔k−k+Lactate Pyruvate
↔
k
−
k
+
Lactate
where k + and k − are the apparent forward and reverse rate constants. From the two-site exchange model, we have the following differential equations:
ⅆPⅆt=−ρP−k+P+k−L ⅆ
P
ⅆ
t
=
−
ρ
P
−
k
+
P
+
k
−
L
ⅆLⅆt=−ρL+k+P−k−L ⅆ
L
ⅆ
t
=
−
ρ
L
+
k
+
P
−
k
−
L
where P and L represent the NMR signals of the hyperpolarized pyruvate and lactate, respectively and ρ is the T 1 relaxation rate (assumed equal for pyruvate and lactate in vivo ).
Get Radiology Tree app to read full this article<
Get Radiology Tree app to read full this article<
q=−k−R+k+ q
=
−
k
−
R
+
k
+
where R ( t ) = L ( t )/ P ( t ) and q=(ⅆR/ⅆt)/(1+R) q
=
(
ⅆ
R
/
ⅆ
t
)
/
(
1
+
R
) . Method 3, the RF analysis, fits the time course of R ( t ). From the two-site exchange model shown by Equation 2 , we solve for P ( t ) and L ( t ), giving:
P(t)=P(0)[k−e−ρt+k+e−(ρ+k−+k+)t]/(k−+k+)+L(0)[k−e−ρt−k+e−(ρ+k−+k+)t]/(k−+k+) P
(
t
)
=
P
(
0
)
[
k
−
e
−
ρ
t
+
k
+
e
−
(
ρ
+
k
−
+
k
+
)
t
]
/
(
k
−
+
k
+
)
+
L
(
0
)
[
k
−
e
−
ρ
t
−
k
+
e
−
(
ρ
+
k
−
+
k
+
)
t
]
/
(
k
−
+
k
+
)
L(t)=P(0)[k+e−ρt−k+e−(ρ+k−+k+)t]/(k−+k+)+L(0)[k+e−ρt+k−e−(ρ+k−+k+)t]/(k−+k+) L
(
t
)
=
P
(
0
)
[
k
+
e
−
ρ
t
−
k
+
e
−
(
ρ
+
k
−
+
k
+
)
t
]
/
(
k
−
+
k
+
)
+
L
(
0
)
[
k
+
e
−
ρ
t
+
k
−
e
−
(
ρ
+
k
−
+
k
+
)
t
]
/
(
k
−
+
k
+
)
where L (0) and P (0) are the signal intensities at t = 0. Dividing Equation 4b by Equation 4a , we have
R(t)={r[1+R(0)]+[R(0)−r]e−st}/{1+R(0)+[r−R(0)]e−st} R
(
t
)
=
{
r
[
1
+
R
(
0
)
]
+
[
R
(
0
)
−
r
]
e
−
s
t
}
/
{
1
+
R
(
0
)
+
[
r
−
R
(
0
)
]
e
−
s
t
}
where r = k + / k − , s = k + + k − . By fitting the ratio time course R ( t ) to Equation 5 , we obtain the fitting parameters k + and k − as well as their ratio k + / k − .
Get Radiology Tree app to read full this article<
Get Radiology Tree app to read full this article<
Get Radiology Tree app to read full this article<
Results
Get Radiology Tree app to read full this article<
Get Radiology Tree app to read full this article<
Get Radiology Tree app to read full this article<
Table 1
The Apparent Rate Constants (s −1 ) and Rate Constant Ratios (Mean ± Standard Deviation) Quantified by the Three Analysis Methods
Method ∗ Tumor Phenotype_k_ + (s −1 )k − (s −1 )k + / k − Size (mm 3 ) DE MDA-MB-231 0.059 ± 0.020 0.024 ± 0.012 2.64 ± 1.03 611 ± 711 MCF-7 0.111 ± 0.038 0.027 ± 0.010 4.17 ± 0.67 283 ± 120 Both lines † 0.089 ± 0.040 0.026 ± 0.010 3.51 ± 1.12P value .068 .77 .11 .51 qR MDA-MB-231 0.063 ± 0.013 0.028 ± 0.011 2.63 ± 1.54 MCF-7 0.093 ± 0.006 0.022 ± 0.007 4.58 ± 1.27 Both lines † 0.080 ± 0.018 0.024 ± 0.009 3.75 ± 1.64P value .047 .44 .15 RF MDA-MB-231 0.057 ± 0.009 0.023 ± 0.009 2.83 ± 1.68 MCF-7 0.086 ± 0.005 0.019 ± 0.007 4.88 ± 1.32 Both lines † 0.074 ± 0.017 0.021 ± 0.007 4.00 ± 1.73P value .02 .52 .16
N = 3 for MDA-Mb-231 line and N = 4 for MCF-7 line.
The P values are from the Student t test comparing the results of two tumor lines using the same analysis method.
Get Radiology Tree app to read full this article<
Get Radiology Tree app to read full this article<
Get Radiology Tree app to read full this article<
Get Radiology Tree app to read full this article<
Get Radiology Tree app to read full this article<
Get Radiology Tree app to read full this article<
Table 2
Comparison of Different Analysis Methods with Various Initial Time Points after the Pyruvate Peak
Method ∗ Tumor First Second Third Fourth_k_ + (s −1 )k − (s −1 )k + (s −1 )k − (s −1 )k + (s −1 )k − (s −1 )k + (s −1 )k − (s −1 ) DE 231 0.061 ± 0.022 0.026 ± 0.011 0.056 ± 0.015 0.022 ± 0.006 0.062 ± 0.012 0.028 ± 0.010 0.069 ± 0.014 0.034 ± 0.016 MCF-7 0.109 ± 0.039 0.025 ± 0.011 0.108 ± 0.042 0.025 ± 0.012 0.101 ± 0.029 0.023 ± 0.011 0.101 ± 0.037 0.023 ± 0.012P value .096 .98 .081 .73 .067 .54 .18 .36 qR 231 0.065 ± 0.014 0.029 ± 0.010 0.062 ± 0.008 0.028 ± 0.012 0.067 ± 0.005 0.033 ± 0.017 0.072 ± 0.008 0.037 ± 0.021 MCF-7 0.093 ± 0.006 0.022 ± 0.007 0.090 ± 0.005 0.021 ± 0.008 0.086 ± 0.010 0.020 ± 0.011 0.087 ± 0.012 0.020 ± 0.012P value .060 .38 .010 .45 .028 .34 .12 .30 RF 231 0.057 ± 0.010 0.024 ± 0.008 0.054 ± 0.008 0.022 ± 0.011 0.058 ± 0.005 0.026 ± 0.015 0.060 ± 0.004 0.028 ± 0.018 MCF-7 0.086 ± 0.004 0.019 ± 0.007 0.084 ± 0.005 0.018 ± 0.007 0.081 ± 0.009 0.018 ± 0.009 0.060 ± 0.042 0.014 ± 0.014P value .029 .47 .012 .62 .0081 .48 .99 .32
The k + and k − refer to the forward and reverse rate constant of the lactate dehydrogenase reaction, respectively.
Get Radiology Tree app to read full this article<
Get Radiology Tree app to read full this article<
Discussion
Get Radiology Tree app to read full this article<
Get Radiology Tree app to read full this article<
Get Radiology Tree app to read full this article<
Get Radiology Tree app to read full this article<
Get Radiology Tree app to read full this article<
Get Radiology Tree app to read full this article<
Get Radiology Tree app to read full this article<
Get Radiology Tree app to read full this article<
Conclusions
Get Radiology Tree app to read full this article<
Acknowledgment
Get Radiology Tree app to read full this article<
Get Radiology Tree app to read full this article<
References
1. Sleeman J., Steeg P.S.: Cancer metastasis as a therapeutic target. Eur J Cancer 2010; 46: pp. 1177-1180.
2. Cairns R.A., Harris I.S., Mak T.W.: Regulation of cancer cell metabolism. Nat Rev Cancer 2011; 11: pp. 85-95.
3. Cantor J.R., Sabatini D.M.: Cancer cell metabolism: one hallmark, many faces. Cancer Discov 2012; 2: pp. 881-898.
4. Ward P.S., Thompson C.B.: Metabolic reprogramming: a cancer hallmark even warburg did not anticipate. Cancer cell 2012; 21: pp. 297-308.
5. Jadvar H., Alavi A., Gambhir S.S.: 18F-FDG uptake in lung, breast, and colon cancers: molecular biology correlates and disease characterization. J Nucl Med 2009; 50: pp. 1820-1827.
6. Gambhir S.S., Czernin J., Schwimmer J., et. al.: A tabulated summary of the FDG PET literature. J Nucl Med 2001; 42: pp. 1S-93S.
7. Tessem M.-B., Swanson M.G., Keshari K.R., et. al.: Evaluation of lactate and alanine as metabolic biomarkers of prostate cancer using 1H HR-MAS spectroscopy of biopsy tissues. Magn Reson Med 2008; 60: pp. 510-516.
8. Swanson M.G., Zektzer A.S., Tabatabai Z.L., et. al.: Quantitative analysis of prostate metabolites using 1H HR-MAS spectroscopy. Magn Reson Med 2006; 55: pp. 1257-1264.
9. Cornel E.B., Smits G.A., Oosterhof G.O., et. al.: Characterization of human prostate cancer, benign prostatic hyperplasia and normal prostate by in vitro 1H and 31P magnetic resonance spectroscopy. J Urol 1993; 150: pp. 2019-2024.
10. Park I., Larson P.E., Zierhut M.L., et. al.: Hyperpolarized 13 C magnetic resonance metabolic imaging: application to brain tumors. Neuro oncol 2010; 12: pp. 133-144.
11. Kurhanewicz J., Vigneron D.B., Brindle K., et. al.: Analysis of cancer metabolism by imaging hyperpolarized nuclei: prospects for translation to clinical research. Neoplasia 2011; 13: pp. 81-97.
12. Brindle K.M., Bohndiek S.E., Gallagher F.A., et. al.: Tumor imaging using hyperpolarized 13 C magnetic resonance spectroscopy. Magn Reson Med 2011; 66: pp. 505-519.
13. Walenta S., Wetterling M., Lehrke M., et. al.: High lactate levels predict likelihood of metastases, tumor recurrence, and restricted patient survival in human cervical cancers. Cancer Res 2000; 60: pp. 916-921.
14. Walenta S., Salameh A., Lyng H., et. al.: Correlation of high lactate levels in head and neck tumors with incidence of metastasis. Am J Pathol 1997; 150: pp. 409-415.
15. Schwickert G., Walenta S., Sundfor K., et. al.: Correlation of high lactate levels in human cervical cancer with incidence of metastasis. Cancer Res 1995; 55: pp. 4757-4759.
16. Brizel D.M., Schroeder T., Scher R.L., et. al.: Elevated tumor lactate concentrations predict for an increased risk of metastases in head-and-neck cancer. Int J Radiat Oncol Biol Phys 2001; 51: pp. 349-353.
17. Czernicki Z., Horsztynski D., Jankowski W., et. al.: Malignancy of brain tumors evaluated by proton magnetic resonance spectroscopy (1H-MRS) in vitro. Acta Neurochir Suppl 2000; 76: pp. 17-20.
18. Sharma U., Mehta A., Seenu V., et. al.: Biochemical characterization of metastatic lymph nodes of breast cancer patients by in vitro 1H magnetic resonance spectroscopy: a pilot study. Magn Reson Imaging 2004; 22: pp. 697-706.
19. Gribbestad I.S., Fjosne H.E., Haugen O.A., et. al.: In vitro proton NMR spectroscopy of extracts from human breast tumours and non-involved breast tissue. Anticancer Res 1993; 13: pp. 1973-1980.
20. Yamamoto N., Watanabe T., Katsumata N., et. al.: Construction and validation of a practical prognostic index for patients with metastatic breast cancer. J Clin Oncol 1998; 16: pp. 2401-2408.
21. Yokota H., Guo J., Matoba M., et. al.: Lactate, choline, and creatine levels measured by vitro 1H-MRS as prognostic parameters in patients with non-small-cell lung cancer. J Magn Reson Imaging 2007; 25: pp. 992-999.
22. Yang Y., Li C., Nie X., et. al.: Metabonomic studies of human hepatocellular carcinoma using high-resolution magic-angle spinning 1H NMR spectroscopy in conjunction with multivariate data analysis. J Proteome Res 2007; 6: pp. 2605-2614.
23. Albers M.J., Bok R., Chen A.P., et. al.: Hyperpolarized 13C Lactate, pyruvate, and alanine: noninvasive biomarkers for prostate cancer detection and grading. Cancer Res 2008; 68: pp. 8607-8615.
24. Lu H., Forbes R.A., Verma A.: Hypoxia-inducible factor 1 activation by aerobic glycolysis implicates the Warburg effect in carcinogenesis. J Biol Chem 2002; 277: pp. 23111-23115.
25. Stern R., Shuster S., Neudecker B.A., et. al.: Lactate stimulates fibroblast expression of hyaluronan and CD44: the Warburg effect revisited. Exp Cell Res 2002; 276: pp. 24-31.
26. Edward M., Gillan C., Micha D., et. al.: Tumour regulation of fibroblast hyaluronan expression: a mechanism to facilitate tumour growth and invasion. Carcinogenesis 2005; 26: pp. 1215-1223.
27. Aboagye E.O., Mori N., Bhujwalla Z.M.: Effect of malignant transformation on lactate levels of human mammary epithelial cells. Adv Enzyme Regul 2001; 41: pp. 251-260.
28. Aboagye EO, Bhujwalla ZM. Characterization of lactate levels in normal and malignant human mammary epithelial cells. Proc Intl Soc Magn Reson Med 1999;1359.
29. Jenkinson M.D., Smith T.S., Joyce K., et. al.: MRS of oligodendroglial tumors: correlation with histopathology and genetic subtypes. Neurology 2005; 64: pp. 2085-2089.
30. Xu H.N., Nioka S., Glickson J.D., et. al.: Quantitative mitochondrial redox imaging of breast cancer metastatic potential. J Biomed Opt 2010; 15: pp. 036010.
31. Xu H.N., Kadlececk S., Profka H., et. al.: Is higher lactate generation rate an indicator of tumor metastatic risk? A pilot study using hyperpolarized 13C-NMR. Proc Int Soc Mag Reson Med 2013; pp. 701.
32. Xu H.N., Kadlececk S., Pullinger B., et. al.: In vivo metabolic evaluation of breast tumor mouse xenografts for predicting aggressiveness using the hyperpolarized (13)C-NMR technique. Adv Exp Med Biol 2013; 789: pp. 237-242.
33. Li L.Z., Kadlececk S., Xu H.N., et. al.: Ratiometric analysis in hyperpolarized NMR (I): test of the two-site exchange model and the quantification of reaction rate constants. NMR Biomed 2013; 26: pp. 1308-1320.
34. Day S.E., Kettunen M.I., Gallagher F.A., et. al.: Detecting tumor response to treatment using hyperpolarized 13C magnetic resonance imaging and spectroscopy. Nat Med 2007; 13: pp. 1382-1387.
35. Nelson S.J., Kurhanewicz J., Vigneron D.B., et. al.: Metabolic imaging of patients with prostate cancer using hyperpolarized [1-13C]pyruvate. Sci Transl Med 2013; 5: pp. 198ra08.
36. Hussien R., Brooks G.A.: Mitochondrial and plasma membrane lactate transporter and lactate dehydrogenase isoform expression in breast cancer cell lines. Physiol Genomics 2011; 43: pp. 255-264.
37. Annarao S, Thakur S. Quantification of lactate concentrations in orthotopic breast tumors with different growth rates. Proc Intl Soc Magn Reson Med 2012;3057.
38. Robey I.F., Lien A.D., Welsh S.J., et. al.: Hypoxia-inducible factor-1α and the glycolytic phenotype in tumors. Neoplasia 2005; 7: pp. 324-330.
39. Sakamoto T., Niiya D., Seiki M.: Targeting the Warburg effect that arises in tumor cells expressing membrane type-1 matrix metalloproteinase. J Biol Chem 2011; 286: pp. 14691-14704.
40. Artemov D., Bhujwalla Z.M., Glickson J.D.: In vivo selective measurement of (1-13C)-glucose metabolism in tumors by heteronuclear cross polarization. Magn Reson Med 1995; 33: pp. 151-155.
41. Gillies R.J., Robey I., Gatenby R.A.: Causes and consequences of increased glucose metabolism of cancers. J Nucl Med 2008; 49: pp. 24S-42S.
42. Li L.Z., Zhou R., Zhong T., et. al.: Predicting melanoma metastatic potential by optical and magnetic resonance imaging. Adv Exp Med Biol 2007; 599: pp. 67-78.
43. Li L.Z., Zhou R., Xu H.N., et. al.: Quantitative magnetic resonance and optical imaging biomarkers of melanoma metastatic potential. Proc Natl Acad Sci U S A 2009; 106: pp. 6608-6613.
44. Xu H.N., Feng M., Moon L., et. al.: Redox imaging of the p53-dependent mitochondrial redox state in colon cancer ex vivo. J Innov Opt Health Sci 2013; 6: pp. 1350016.
45. Xu H.N., Nioka S., Chance B., et. al.: Heterogeneity of mitochondrial redox state in premalignant pancreas in a PTEN null transgenic mouse model. Adv Exp Med Biol 2011; 701: pp. 207-213.
46. Xu H.N., Nioka S., Li L.Z.: Imaging heterogeneity in the mitochondrial redox state of premalignant pancreas in the pancreas-specific PTEN-null transgenic mouse model. Biomark Res 2013; 1: pp. 6.
47. Xu H.N., Tchou J., Chance B., et. al.: Imaging the redox states of human breast cancer core biopsies. Adv Exp Med Biol 2013; 765: pp. 343-349.
48. Xu H.N., Tchou J., Li L.Z.: Redox imaging of human breast cancer core biopsies: a preliminary investigation. Acad Radiol 2013; 20: pp. 764-768.
49. Li L.Z.: Imaging mitochondrial redox potential and its possible link to tumor metastatic potential. J Bioenerg Biomembr 2012; 44: pp. 645-653.
50. Witney T.H., Kettunen M.I., Day S.E., et. al.: A comparison between radiolabeled fluorodeoxyglucose uptake and hyperpolarized (13)C-labeled pyruvate utilization as methods for detecting tumor response to treatment. Neoplasia 2009; 11: pp. 574-582.
51. Lodi A., Woods S.M., Ronen S.M.: Treatment with the MEK inhibitor U0126 induces decreased hyperpolarized pyruvate to lactate conversion in breast, but not prostate, cancer cells. NMR Biomed 2013; 26: pp. 299-306.
52. Harris T., Eliyahu G., Frydman L., et. al.: Kinetics of hyperpolarized 13C1-pyruvate transport and metabolism in living human breast cancer cells. Proc Natl Acad Sci U S A 2009; 106: pp. 18131-18136.
53. Halestrap A.P.: The monocarboxylate transporter family – structure and functional characterization. IUBMB life 2012; 64: pp. 1-9.
54. Witney T.H., Kettunen M.I., Brindle K.M.: Kinetic modeling of hyperpolarized 13C label exchange between pyruvate and lactate in tumor cells. J Biol Chem 2011; 286: pp. 24572-24580.
55. Slomiany M.G., Grass G.D., Robertson A.D., et. al.: Hyaluronan, CD44, and emmprin regulate lactate efflux and membrane localization of monocarboxylate transporters in human breast carcinoma cells. Cancer Res 2009; 69: pp. 1293-1301.
56. Gallagher S.M., Castorino J.J., Wang D., et. al.: Monocarboxylate transporter 4 regulates maturation and trafficking of CD147 to the plasma membrane in the metastatic breast cancer cell line MDA-MB-231. Cancer Res 2007; 67: pp. 4182-4189.
57. Weber G.: Carbohydrate metabolism in cancer cells and the molecular correlation concept. Naturwissenschaften 1968; 55: pp. 418-429.