
Rationale and Objectives
A variety of morphologic and kinetic signs of benign or malignant breast lesions contribute to a final diagnosis and differential diagnosis in magnetic resonance (MR) mammography (MRM). As a new sign, prepectoral edema (PE) in patients without any history of previous biopsy, operation, radiation, or chemotherapy was detected during routine breast MR examinations. The purpose of this study was to retrospectively evaluate the role of this morphologic sign in the differential diagnosis of breast lesions.
Materials and Methods
Between January 2005 and October 2006, a total of 1109 consecutive MRM examinations have been performed in our institution. In this study, only patients who would later be biopsied or operated in our own hospital were included. They had no previous operation, biopsy, intervention, chemotherapy, hormone replacement therapy, or previous mastitis. In total, 162 patients with 180 lesions were included, histologically correlated later-on by open biopsy (124 patients and 136 lesions) or core biopsy (38 patients and 44 lesions). The evaluations were performed by four experienced radiologists in consensus.
Results
One hundred eighty evaluated lesions included 104 malignant lesions (93 invasive and 11 noninvasive cancers) and 76 benign lesions. PE was detected in 2.6% of benign lesions (2 of 76), in none of the Ductal cacinoma in situ (DCIS) cases (0 of 11), and in 25.8% of malignant lesions (24 of 93; P < .000). PE was found significantly more frequently in presence of malignant tumors >2 cm in diameter (48.5%, 17 of 35 vs. 13.8%, 8 of 58; P < .001). PE was not statistically associated to malignant tumor type, presence or absence of additional DCIS, and number of lesions. This resulted in the following diagnostic parameters for PE as an indicator for malignancy: sensitivity of 19.3%, specificity of 97.3%, positive predictive value (PPV) of 92.3%, negative predictive value of 48%, and accuracy of 57.7%.
Conclusions
In case of occurrence, the “PE sign” seems to be a specific indicator for malignant tumors with a high PPV, independent from its entity.
The role of magnetic resonance (MR) imaging (MRI) as an imaging modality of the breast (MR mammography [MRM]) has evolved to be increasingly important over the last 30 years. So far, current guidelines of the American College of Radiology (ACR) list among the specific indications for breast MR mainly the following :
1) Patients after operation or radiation
Get Radiology Tree app to read full this article<
Get Radiology Tree app to read full this article<
Get Radiology Tree app to read full this article<
Get Radiology Tree app to read full this article<
Get Radiology Tree app to read full this article<
 Open full size image
Figure 1
Top left : T1 native; top right : 1 minute subtraction; low left : 7 minutes subtraction; low right : T2-weighted TSE-Turbo Soin Echo G3 ductal invasive carcinoma, showing as enhancing lesions in the left breast in S1. The multiple cancers reveal type 3 kinetic curves as well and appear dark in T2. Accompanying prepectoral edema are clearly visible in T2, displaying as hyperintense fluid spatters.
 Open full size image
Figure 2
T2-weighted TSE-Turbo Soin Echo image. CA- Cancer Ductal invasive carcinoma, G3 ( orange circle ). Mild amounts of prepectoral edema in the right breast ( blue arrows ). (Color version of figure is available online.)
 Open full size image
Figure 3
T2-weighted TSE-Turbo Soin Echo image. Ductal invasive carcinoma, G3 ( orange circle ). Extensive amounts of prepectoral edema in the left breast ( blue arrows ). (Color version of figure is available online.)
Get Radiology Tree app to read full this article<
Material and methods
Study Design
Get Radiology Tree app to read full this article<
Get Radiology Tree app to read full this article<
Get Radiology Tree app to read full this article<
Get Radiology Tree app to read full this article<
Get Radiology Tree app to read full this article<
Image Acquisition and Interpretation
Get Radiology Tree app to read full this article<
Statistical Evaluation
Get Radiology Tree app to read full this article<
Get Radiology Tree app to read full this article<
Sensitivity:TP(TP+FN) Sensitivity
:
TP
(
TP
+
FN
)
Specificity:TN(TN+FP) Specificity
:
TN
(
TN
+
FP
)
Positivepredictivevalue(PPV):TP(TP+FP) Positive
predictive
value
(
PPV
)
:
TP
(
TP
+
FP
)
Negativepredictivevalue(NPV):TN(TN+FN) Negative
predictive
value
(
NPV
)
:
TN
(
TN
+
FN
)
Accuracy:(TP+TN)(TP+TN+FP+FN) Accuracy
:
(
TP
+
TN
)
(
TP
+
TN
+
FP
+
FN
)
Get Radiology Tree app to read full this article<
MR Scanner
Get Radiology Tree app to read full this article<
Table 1
Examination Protocol
Sequences Native Dynamic ∗ Post-CM T2w-TSE Weighting T1 T1 T1 T2 Pulse sequence FLASH FLASH † FLASH TSE Orientation Coronal Transversal Coronal Transversal Time of repetition (ms) 113 113 113 8900 Echo time (ms) 4.6 4.6 4.6 207 Flip angle (°) 80 80 80 90 Slice thickness (mm) 3 3 3 3 Gap (mm) 0.3 0.3 0.3 0.3 Field of view (mm) 350 350 350 350 Number of slices 33 33 33 33 Matrix (pixel) 384 × 384 384 × 384 384 × 384 512 × 512
Get Radiology Tree app to read full this article<
Get Radiology Tree app to read full this article<
Get Radiology Tree app to read full this article<
Institutional Review Board Approval Statement
Get Radiology Tree app to read full this article<
Results
Get Radiology Tree app to read full this article<
Table 2
Malignant Lesions in the Patient Collective
Invasive carcinoma % ( n ) Invasive ductal carcinoma 78.5 (73/93) Invasive lobular carcinoma 12.9 (12/93) Invasive medullary carcinoma 2.2 (2/93) Invasive mucinous carcinoma 1.1 (1/93) Invasive tubular carcinoma 1.1 (1/93) Invasive tubulolobular carcinoma 1.1 (1/93) Invasive ductal and lobular carcinoma 3.2 (3/93) Total 100 (93) Noninvasive carcinoma DCIS 90.9 (10/11) LCIS 9.1 (1/11) Total 100 (11) Total malignant lesions 57.8 (104/180)
DCIS, Ductal carcinoma in situ; LCIS, Lobular carcinoma in situ.
Table 3
Benign Lesions in the Patient Collective
% ( n ) Neoplasia Papilloma 30.3 (23/76) Fibroadenoma 17.1 (13/76) Phyllodes tumor/hamartoma 2.6 (2/76) Hemangioma 1.3 (1/76) Total 51.3 (39/76) Mastopathic changes Fibrocystic changes 38.2 (29/76) Atypical ductal hyperplasia 10.5 (8/76) Total 48.7 (37/76) Total benign lesions 42.2 (76/180)
Get Radiology Tree app to read full this article<
Get Radiology Tree app to read full this article<
Table 4
PE in Malignant versus Benign Tumors ( P < .000)
No PE, % ( n ) PE, % ( n ) Total Benign lesions 97 (74/76) 2.6 (2/76) 76 Noninvasive cancers 100 (11/11) 0 (0/11) 11 Invasive cancers 74 (69/93) 25.8 (24/93) 93 Total 154 26 180
PE, prepectoral edema.
Table 5
Statistical Results for Prepectoral Edema as an Indicator for Malignancy
% Sensitivity 19.3 Specificity 97.3 Positive predictive value 92.3 Negative predictive value 48 Accuracy 58
Get Radiology Tree app to read full this article<
Get Radiology Tree app to read full this article<
Table 6
PE in Correlation to the Type of Carcinoma ( P = 1.000)
No PE, % ( n ) PE, % ( n ) Total IDC 74.0 (54/73) 26.0 (19/73) 73 Other CA types 75.0 (15/20) 25.0 (5/20) 20 Total 74.2 (69) 25.8 (24) 93
PE, prepectoral edema; CA, Cancer; IDC, Invasive ductal cancer.
Get Radiology Tree app to read full this article<
Get Radiology Tree app to read full this article<
Table 7
PE in Correlation to Tumor Size ( P < .001)
No PE, % ( n ) PE, % ( n ) Total Tumor ≤ 2 cm 86.2 (50/58) 13.8 (8/58) 58 Tumor > 2 cm 51.4 (18/35) 48.5 (17/35) 35 Total 73.1 (68) 26.8 (25) 93
PE, prepectoral edema.
Get Radiology Tree app to read full this article<
Get Radiology Tree app to read full this article<
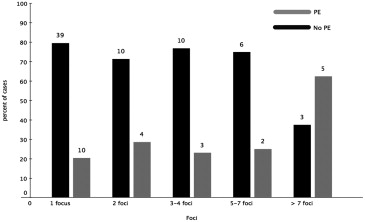
Table 8
PE in Correlation to the Number of Foci
No PE, % ( n ) PE, % ( n ) Total 1 focus 79.6 (39/49) 20.4 (10/49) 49 2 foci 71.4 (10/14) 28.6 (4/14) 14 3–4 foci 76.9 (10/13) 23.1 (3/13) 13 5–7 foci 75.0 (6/8) 25.0 (2/8) 8 >7 foci 37.5 (3/8) 62.5 (5/8) 8 Total 73.9 (68) 26.1 (24) 92
PE, prepectoral edema.
Table 9
PE in Correlation to Accompanying DCIS/LCIS ( P = .811)
No PE PE Total DCIS not present 75.9 (41/54) 24.1 (13/54) 54 DCIS present 71.8 (28/39) 28.2 (11/39) 39 Total 74.2 (69) 25.8 (24) 93
PE, prepectoral edema; DCIS, Ductal carcinoma in situ; LCIS, Lobular carcinoma in situ.
Get Radiology Tree app to read full this article<
Discussion
Get Radiology Tree app to read full this article<
Get Radiology Tree app to read full this article<
Get Radiology Tree app to read full this article<
Get Radiology Tree app to read full this article<
Get Radiology Tree app to read full this article<
Get Radiology Tree app to read full this article<
Get Radiology Tree app to read full this article<
Get Radiology Tree app to read full this article<
Get Radiology Tree app to read full this article<
Study Limitations
Get Radiology Tree app to read full this article<
Conclusions
Get Radiology Tree app to read full this article<
Get Radiology Tree app to read full this article<
References
1. Burnside E.S., Sickles E.A., Bassett L.W., et. al.: The ACR BI-RADS experience: learning from history. J Am Coll Radiol 2009; 6: pp. 851-860.
2. Kaiser W.A.: Magnetresonanztomographie der Mamma. Erfahrungen nach 253 Untersuchungen. Dtsch Med Wochenschr 1989; 114: pp. 1351-1357.
3. Folkman J.: Tumor angiogenesis: therapeutic implications. N Engl J Med 1971; 285: pp. 1182-1186.
4. Bick U.: Typical and unusual findings in MR mammography. RöFo Fortschritte Auf Dem Geb. Röntgenstrahlen Nukl 2000; 172: pp. 415-428.
5. Kuhl C.: The current status of breast MR imaging. Part I. Choice of technique, image interpretation, diagnostic accuracy, and transfer to clinical practice. Radiology 2007; 244: pp. 356-378.
6. Fischer D.R., Baltzer P., Malich A., et. al.: Is the “blooming sign” a promising additional tool to determine malignancy in MR mammography?. Eur Radiol 2004; 14: pp. 394-401.
7. Kuhl C.K., Klaschik S., Mielcarek P., et. al.: Do T2-weighted pulse sequences help with the differential diagnosis of enhancing lesions in dynamic breast MRI?. J Magn Reson Imaging 1999; 9: pp. 187-196.
8. Fischer D.R., Wurdinger S., Boettcher J., et. al.: Further signs in the evaluation of magnetic resonance mammography: a retrospective study. Invest Radiol 2005; 40: pp. 430-435.
9. Baltzer P.A.T., Yang F., Dietzel M., et. al.: Sensitivity and specificity of unilateral edema on T2w-TSE sequences in MR-mammography considering 974 histologically verified lesions. Breast J 2010; 16: pp. 233-239.
10. Kaiser WA. Signs in MR-mammography. 1st ed. 2008. Corr. 2nd printing. Springer; 2009.
11. Dvorak H.F.: Tumors: wounds that do not heal. Similarities between tumor stroma generation and wound healing. N Engl J Med 1986; 315: pp. 1650-1659.
12. Horst H.A., Horny H.P.: Characterization and frequency distribution of lymphoreticular infiltrates in axillary lymph node metastases of invasive ductal carcinoma of the breast. Cancer 1987; 60: pp. 3001-3007.
13. van Ravenswaay Claasen H.H., Kluin P.M., Fleuren G.J.: Tumor infiltrating cells in human cancer. On the possible role of CD16+ macrophages in antitumor cytotoxicity. Lab Investig J Tech Methods Pathol 1992; 67: pp. 166-174.
14. Leek R.D., Talks K.L., Pezzella F., et. al.: Relation of hypoxia-inducible factor-2 alpha (HIF-2 alpha) expression in tumor-infiltrative macrophages to tumor angiogenesis and the oxidative thymidine phosphorylase pathway in Human breast cancer. Cancer Res 2002; 62: pp. 1326-1329.
15. Sica A., Saccani A., Mantovani A.: Tumor-associated macrophages: a molecular perspective. Int Immunopharmacol 2002; 2: pp. 1045-1054.
16. 1997.SpringerBerlin
17. Dvorak H.F., Dickersin G.R., Dvorak A.M., et. al.: Human breast carcinoma: fibrin deposits and desmoplasia. Inflammatory cell type and distribution. Microvasculature and infarction. J Natl Cancer Inst 1981; 67: pp. 335-345.
18. Hashizume H., Baluk P., Morikawa S., et. al.: Openings between defective endothelial cells explain tumor vessel leakiness. Am J Pathol 2000; 156: pp. 1363-1380.
19. Pettersson A., Nagy J.A., Brown L.F., et. al.: Heterogeneity of the angiogenic response induced in different normal adult tissues by vascular permeability factor/vascular endothelial growth factor. Lab Investig J Tech Methods Pathol 2000; 80: pp. 99-115.
20. Dvorak H.F.: Rous–Whipple Award Lecture. How tumors make bad blood vessels and stroma. Am J Pathol 2003; 162: pp. 1747-1757.
21. Sunderkötter C., Steinbrink K., Goebeler M., et. al.: Macrophages and angiogenesis. J Leukoc Biol 1994; 55: pp. 410-422.
22. Sherif H., Mahfouz A.E., Oellinger H., et. al.: Peripheral washout sign on contrast-enhanced MR images of the breast. Radiology 1997; 205: pp. 209-213.
23. Brown L.F., Guidi A.J., Schnitt S.J., et. al.: Vascular stroma formation in carcinoma in situ, invasive carcinoma, and metastatic carcinoma of the breast. Clin Cancer Res 1999; 5: pp. 1041-1056.
24. Uematsu T., Kasami M., Watanabe J.: Is evaluation of the presence of prepectoral edema on T2-weighted with fat-suppression 3 T breast MRI a simple and readily available noninvasive technique for estimation of prognosis in patients with breast cancer?. Breast Cancer 2014; 21: pp. 684-692.
25. Uematsu T., Kasami M., Watanabe J.: Can T2-weighted 3-T breast MRI predict clinically occult inflammatory breast cancer before pathological examination? A single-center experience. Breast Cancer 2014; 21: pp. 115-121.
26. Gilles R., Meunier M., Lucidarme O., et. al.: Clustered breast microcalcifications: evaluation by dynamic contrast-enhanced subtraction MRI. J Comput Assist Tomogr 1996; 20: pp. 9-14.
27. Westerhof J.P., Fischer U., Moritz J.D., et. al.: MR imaging of mammographically detected clustered microcalcifications: is there any value?. Radiology 1998; 207: pp. 675-681.
28. Hayes D.F., Isaacs C., Stearns V.: Prognostic factors in breast cancer: current and new predictors of metastasis. J Mammary Gland Biol Neoplasia 2001; 6: pp. 375-392.
29. Fischer U., Zachariae O., Baum F., et. al.: The influence of preoperative MRI of the breasts on recurrence rate in patients with breast cancer. Eur Radiol 2004; 14: pp. 1725-1731.
30. Carter C.L., Allen C., Henson D.E.: Relation of tumor size, lymph node status, and survival in 24,740 breast cancer cases. Cancer 1989; 63: pp. 181-187.
31. Folkman J., Shing Y.: Angiogenesis. J Biol Chem 1992; 267: pp. 10931-10934.
32. Macéa J.R., Fregnani J.H.T.G.: Anatomy of the thoracic wall, axilla and breast. Int J Morphol 2006; 24: pp. 691-704.
33. Baltzer P.A., Dietzel M., Gajda , et. al.: A systematic comparison of two pulse sequences for edema assessment in MR-mammography. Eur J Radiol 2012; 81: pp. 1500-1503.