
Rationale and Objectives
Water molecule motion has been shown to be isotropic in healthy liver as assessed by diffusion-weighted imaging (DWI). The purpose of this study was to investigate whether this assumption is still valid in the cirrhotic liver.
Materials and Methods
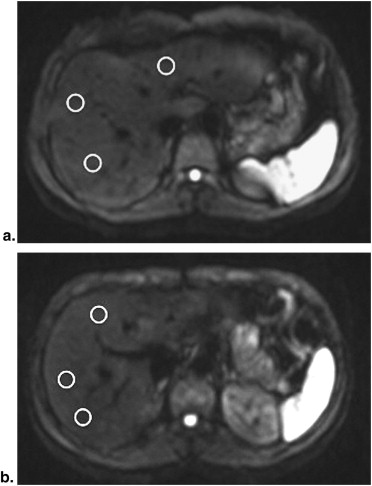
Twelve cirrhotic patients and 12 controls underwent DWI on a 3.0T-system. We used an echo-planar sequence independently applying unidirectional motion-probing gradients along read-(x), phase-(y), and slice-(z) directions, respectively. Liver apparent diffusion coefficient (ADC) and perfusion fraction ( f ) were calculated along each gradient direction, based on two b-values sets (0–400 and 0–800 seconds/mm 2 ). Measurement was repeated at two different axial slices of the liver.
Results
No significant difference among x, y, and z- ADC (and f ) of the liver was found within controls and cirrhotic patients ( P > .01), regardless of the set of b-values or the slice of measurement. ADC was lower in cirrhotic patients than in controls (difference of 0.24–0.39 × 10 −3 mm 2 /seconds at b = 800 seconds/mm 2 ; P = .000–.0139). Perfusion fraction f was lower in cirrhotics than in controls, irrespective of the b-values set or the slice of measurement (difference of 0.05–0.15; P < .0001–.0885).
Conclusion
The liver shows isotropic water diffusion in cirrhotics, despite fibrotic distortion leading to decreased ADC as compared to controls. Our results emphasize that the correlation between parenchymal changes in liver fibrosis and the ADC estimate remains an elusive goal based on the state-of-the-art DWI technique.
Over the last years, diffusion-weighted Imaging (DWI) has been investigated as a tool to provide noninvasive detection and quantification of liver fibrosis . Fibrosis results from the accumulation of extracellular matrix components, which causes distortion of the parenchymal architecture , and leads to the restriction of water diffusion . As expected, the hepatic apparent diffusion coefficient (ADC), measured by means of DWI, has been shown to decrease proportionally to the degree of fibrosis and/or inflammation . Nonetheless, the mechanism underlying the decrease of the ADC is not completely understood, and probably depends more on alterations in liver perfusion rather than in actual diffusion . Thus, the radiopathologic correlation of what DWI measures in liver fibrosis must be further elucidated.
In addition, several concerns still limit DWI clinical applications for liver fibrosis. Among them, technical issues like the choice of b-values, sequence design and ADC assessment optimization are those mainly affecting the reproducibility of results . In this scenario, the most appropriate direction of DWI motion-probing gradients is still undetermined. In previous studies, gradients have been applied multi- or mono-directionally, based on the assumption that the liver shows isotropic water diffusion . To our knowledge, this assumption has been investigated on humans only by Taouli et al on a 1.5-T system . No previous studies were aimed to assess liver isotropy at higher magnetic field strength, and whether isotropy is lost (or not) in liver fibrosis.
Get Radiology Tree app to read full this article<
Materials and methods
Patients
Get Radiology Tree app to read full this article<
Get Radiology Tree app to read full this article<
DWI Protocol
Get Radiology Tree app to read full this article<
Get Radiology Tree app to read full this article<
Get Radiology Tree app to read full this article<
Image Analysis and ADC Determination
Get Radiology Tree app to read full this article<
ADC=1/bi×ln(S0/Si) ADC
=
1
/
b
i
×
ln
(
S
0
/
S
i
)
Get Radiology Tree app to read full this article<
Get Radiology Tree app to read full this article<
Get Radiology Tree app to read full this article<
f=1−exp[−b(ADC−D)] f
=
1
−
exp
[
-
b
(
ADC
-
D
)
]
Get Radiology Tree app to read full this article<
Get Radiology Tree app to read full this article<
Data Analysis
Get Radiology Tree app to read full this article<
Get Radiology Tree app to read full this article<
Get Radiology Tree app to read full this article<
Results
Image Quality and Homogeneity of Measurements
Get Radiology Tree app to read full this article<
Get Radiology Tree app to read full this article<
Table 1
P Value of the Differences between Liver Apparent Diffusion Coefficient (ADC) and Perfusion Fraction f Along Each Diffusion Gradient Direction Applied (Unpaired t -Test)
ADC at 0–400 seconds/mm 2 ADC at 0–800 seconds/mm 2 Perfusion Fraction f x y z x y z x y z CONTROLS
Slice 1 vs. slice 2 ( P ) 0.7436 0.6975 0.8739 0.5768 0.3412 0.6274 0.9105 1.000 0.4599 CIRRHOTICS
Slice 1 vs. slice 2 ( P ) 0.2113 0.1912 0.0369 0.8156 0.4055 0.4164 0.1297 0.3097 0.0626
Measurements are consistent in our model. Range, mean, and standard deviation of ADC and f values are detailed in Tables 2 and 3 .
Get Radiology Tree app to read full this article<
Patterns of Water Diffusion within the Liver
Get Radiology Tree app to read full this article<
Table 2a
ADC and Perfusion Fraction f in Controls and Cirrhotic Patients Measured on slice 1 (1 cm Above the Level of the Hepatic Hilum)
Diffusion Gradient Direction_P_ x y z Controls ADC at 0–400 second/mm 2 Range 1.32–2.60 1.22–2.50 1.42–2.91 .990 Mean ± SD 1.95 ± 0.41 1.96 ± 0.34 1.97 ± 0.43 95% CI 1.69–2.21 1.74–2.17 1.69–2.25 ADC at 0–800 seconds/mm 2 P = .0001P = .0001P = .0001 Range 1.05–2.06 0.86–1.62 1.10–1.70 .597 Mean ± SD 1.42 ± 0.25 1.33 ± 0.24 1.40 ± 0.20 95% CI 1.26–1.59 1.18–1.48 1.27–1.53f Range 0.03–0.35 0.05–0.35 0.09–0.38 .635 Mean ± SD 0.18 ± 0.10 0.21 ± 0.08 0.20 ± 0.08 95% CI 0.11–0.24 0.16–0.26 0.15–0.25 Cirrhotics ADC at 0–400 seconds/mm 2 Range 0.96–1.91 0.99–1.75 0.89–1.46 .082 Mean ± SD 1.35 ± 0.25 1.27 ± 0.23 1.15 ± 0.17 95% CI 1.19–1.52 1.07–1.52 1.03–1.25 ADC at 0–800 seconds/mm 2 P = .0012P = .0039P = .0006 Range 0.63–1.69 0.63–1.48 0.64–1.31 .057 Mean ± SD 1.13 ± 0.28 1.06 ± 0.22 1.01 ± 0.19 95% CI 0.94–1.31 0.92–1.21 0.89–1.13f Range 0.01–0.21 0.01–0.23 0.01–0.13 .363 Mean ± SD 0.08 ± 0.06 0.07 ± 0.07 0.05 ± 0.03 95% CI 0.04–0.12 0.03–0.12 0.03–0.12
Table 2b
ADC and Perfusion Fraction f in Controls and Cirrhotic Patients Measured on slice 2 (1 cm Below the Level of the Hepatic Hilum)
Diffusion Gradient Direction_P_ x y z Controls ADC at 0–400 seconds/mm 2 Range 1.38–2.84 1.49–2.72 1.35–2.76 .857 Mean ± SD 2.00 ± 0.40 2.03 ± 0.40 1.94 ± 0.42 95% CI 1.75–2.26 1.78–2.29 1.65–2.21 ADC at 0–800 seconds/mm 2 P < .0001P < .0001P = .0001 Range 1.09–1.80 1.1–1.73 1.15–1.82 .719 Mean ± SD 1.48 ± 0.19 1.41 ± 0.17 1.44 ± 0.20 95% CI 1.35–1.60 1.30–1.52 1.31–1.57f Range 0.09–0.34 0.12–0.34 0.04–0.31 .662 Mean ± SD 0.18 ± 0.07 0.21 ± 0.07 0.16 ± 0.09 95% CI 0.13–0.22 0.16–0.26 0.12–0.23 Cirrhotics ADC at 0–400 seconds/mm 2 Range 1.10–2.11 1.04–2.12 1.00–1.89 .376 Mean ± SD 1.52 ± 0.35 1.43 ± 0.34 1.33 ± 0.23 95% CI 1.29–1.74 1.21–1.65 1.18–1.48 ADC at 0–800 seconds/mm 2 P = .0002P = .0001P = .0004 Range 0.43–1.54 0.80–1.57 0.77–1.35 .657 Mean ± SD 1.16 ± 0.31 1.14 ± 0.22 1.07 ± 0.16 95% CI 0.95–1.36 1.00–1.28 0.96–1.18f Range 0.03–0.24 0.01–0.20 0.01–0.27 .534 Mean ± SD 0.13 ± 0.11 0.10 ± 0.07 0.09 ± 0.07 95% CI 0.08–0.18 0.06–0.15 0.05–0.14
ADC, apparent diffusion coefficient; SD, standard deviation; x, read-encoding direction; y, phase-encoding direction; z, slice-select direction.
No significant difference in ADC and f was observed along different diffusion gradient directions x, y, and z within controls and cirrhotics. Both in controls and cirrhotic patients, ADCs decreased by increasing maximum b-value from 400 to 800 seconds/mm 2 ( P values shown across table cells). ADCs are expressed in × 10 −3 mm 2 /seconds.
Get Radiology Tree app to read full this article<
Get Radiology Tree app to read full this article<
Diagnosis of Cirrhosis
Get Radiology Tree app to read full this article<
Table 3
Difference between Liver ADC of Controls vs. Cirrhotics (Expressed in ×10 −3 mm 2 /second), with the Statistical Significance Expressed by the P Value
ADC at 0–400 seconds/mm 2 ADC at 0–800 seconds/mm 2 Perfusion Fraction f x y z x y z x y z Slice 1 Difference 0.60 0.69 0.82 0.29 0.27 0.39 0.10 0.14 0.15P .0003 <.0001 <.0001 .0139 .0107 .0001 .0106 .0002 <.0001 Slice 2 Difference 0.48 0.60 0.61 0.32 0.24 0.37 0.05 0.11 0.08P .0050 .0007 .0003 .0084 .0045 .0001 .0885 .0016 .0255
ADC, apparent diffusion coefficient; x, read-encoding direction; y, phase-encoding direction; z, slice-select direction.
Data are reported for every diffusion gradient direction, at both slices 1 and 2.
Get Radiology Tree app to read full this article<
Get Radiology Tree app to read full this article<
Discussion
Liver Isotropy at 3.0T
Get Radiology Tree app to read full this article<
Get Radiology Tree app to read full this article<
Get Radiology Tree app to read full this article<
Liver Isotropy in Cirrhotic Patients
Get Radiology Tree app to read full this article<
Get Radiology Tree app to read full this article<
Get Radiology Tree app to read full this article<
Limitations
Get Radiology Tree app to read full this article<
Conclusion
Get Radiology Tree app to read full this article<
References
1. Taouli B., Chouli M., Martin A.J., et. al.: Chronic hepatitis: role of diffusion-weighted imaging and diffusion tensor imaging for the diagnosis of liver fibrosis and inflammation. J Magn Resonon Imaging 2008; 28: pp. 89-95.
2. Talwalkar J.A., Yin M., Fidler J.L., et. al.: Magnetic resonance imaging of hepatic fibrosis: Emerging clinical applications. Hepatology 2008; 47: pp. 332-342.
3. Sandrasegaran K., Fatih M., Akisik F.M., et. al.: Value of diffusion-weighted MRI for assessing liver fibrosis and cirrhosis. AJR Am J Roentgenol 2009; 193: pp. 1556-1560.
4. Taouli B., Koh D.M.: Diffusion-weighted MR imaging of the liver. Radiology 2010; 254: pp. 47-66.
5. Girometti R., Furlan A., Esposito G., et. al.: Relevance of b-values in evaluating liver fibrosis: a study on healthy and cirrhotic subjects using two single-shot spin-echo echo-planar diffusion-weighted sequences. J Magn Reson Imaging 2008; 28: pp. 411-419.
6. Koinuma M.N., Ohashi I., Hanafusa K., et. al.: Apparent diffusion coefficient measurements with diffusion-weighted magnetic resonance imaging for evaluation of hepatic fibrosis. J Magn Reson Imaging 2005; 22: pp. 80-85.
7. Lewin M., Poujol-Robert A., Boelle P.Y., et. al.: Diffusion-weighted magnetic resonance imaging for the assessment of fibrosis in chronic hepatitis C. Hepatology 2007; 46: pp. 658-665.
8. Aubé C., Racineux P.X., Lebigot J., et. al.: Diagnosis and quantification of hepatic fibrosis with diffusion weighted MR imaging: preliminary results. J Radiol 2004; 85: pp. 301-306.
9. Taouli B., Tolia A.J., Losada M., et. al.: Diffusion-weighted MRI for quantification of liver fibrosis: preliminary experience. AJR Am J Roentgenol 2007; 189: pp. 799-806.
10. Annet L., Peeters F., Abarca-Quinones J., et. al.: Assessment of diffusion-weighted MR Imaging in liver fibrosis. J Magn Reson Imaging 2007; 25: pp. 122-128.
11. Luciani A., Vignaud A., Cavet M., et. al.: Liver cirrhosis: intravoxel incoherent motion MR imaging-pilot study. Radiology 2008; 249: pp. 891-899.
12. Boulanger Y., Amara M., Lepanto L., et. al.: Diffusion-weighted MR imaging of the liver of hepatitis C patients. NMR Biomed 2003; 16: pp. 132-136.
13. Girometti R., Furlan A., Bazzocchi M., et. al.: Diffusion-weighted MRI in evaluating liver fibrosis: a feasibility study in cirrhotic patients. Radiol Med 2007; 112: pp. 394-408.
14. Taouli B., Vilgrain V., Dumont E., et. al.: Evaluation of liver diffusion isotropy and characterization of focal hepatic lesions with two single-shot echo-planar MR imaging sequences: prospective study in 66 patients. Radiology 2003; 226: pp. 71-78.
15. Yoshikawa T., Kawamitsu H., Mitchell D.G., et. al.: ADC measurement of abdominal organs and lesions using parallel imaging technique. AJR Am J Roentgenol 2006; 187: pp. 1521-1530.
16. Merkle E.M., Dale B.M.: Abdomen MRI at 3.0T: the basic revisited. AJR Am J Roentgenol 2006; 186: pp. 1524-1532.
17. Le Bihan D., Breton E., Lallemand D., et. al.: Separation of diffusion and perfusion in intravoxel incoherent motion MR imaging. Radiology 1988; 168: pp. 497-505.
18. Rosenkrantz A.B., Oei M., Babb J.S., et. al.: Diffusion-weighted imaging of the abdomen at 3.0 Tesla: image quality and apparent diffusion coefficient reproducibility compared with 1.5 Tesla. J Magn Reson Imaging 2011; 33: pp. 128-135.
19. Dale B.D., Braithwaite A.C., Boll D.T., et. al.: Field strength and diffusion encoding technique affect the apparent diffusion coefficient measurements in diffusion-weighted imaging of the abdomen. Invest Radiol 2010; 45: pp. 104-108.
20. Schuppan D., Afdhal N.H.: Liver cirrhosis. Lancet 2008; 371: pp. 838-851.
21. Fauerholdt L., Schlichting P., Christensen E., et. al.: Conversion of micronodular cirrhosis into macronodular cirrhosis. Hepatology 1983; 3: pp. 928-931.
22. Cheung J.S., Fan S.J., Gao D.S., et. al.: Diffusion tensor imaging of liver fibrosis in an experimental model. J Magn Reson Imaging 2010; 32: pp. 1141-1148.
23. Van Beers B.E., Grandin C., Pauwels S., et. al.: Gd-EOB-DTPA enhancement pattern of hepatocellular carcinomas in rats: comparison with Tc-99m-IDA uptake. J Magn Reson Imaging 1994; 4: pp. 351-354.