
Rationale and Objectives
Efficiency is central to current radiology practice. Knowledge of report generation timing is essential for workload optimization and departmental staffing decisions. Yet little research evaluates the distribution of activities performed by neuroradiologists in daily work.
Materials and Methods
This observational study tracked radiologists interpreting 358 brain magnetic resonance imaging (MRI) in an academic practice over 9 months. We measured the total duration from study opening to report signing and times for five activities performed during this period: image viewing, report transcription, obtaining clinical data, education, and other. Attendings, fellows, and residents reading studies independently and attendings over-reading trainee-previewed studies were observed.
Results
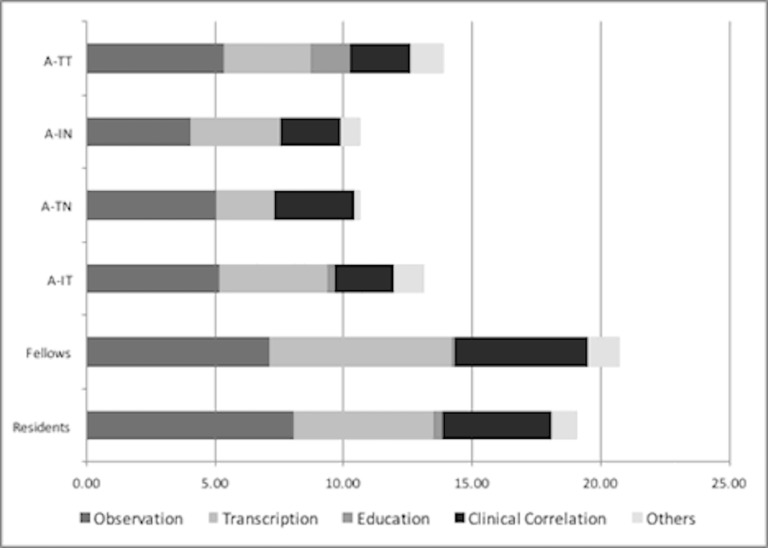
Ten attendings, 12 fellows, and 13 residents spent a mean of 11, 18, and 16 minutes reading brain MRIs independently. Mean duration was significantly different comparing attendings in all assignments to fellows (18.36 ± 1.05 minutes, p = 0.0001) or residents (16.31 ± 1.11 minutes, p = 0.001) but not between fellows/residents. Mean duration among attendings reading independently versus over-reading trainees was not statistically different. Attendings spent the same time on image viewing (4.07–5.33 minutes) with or without trainees. Attending transcription time was shortest when over-reading trainees (2.24 minutes) and longest when reading independently (4.20 minutes), demonstrating benefit of the draft report. Fellows and Residents spent longer on image viewing (7.14 minutes and 8.06 minutes, respectively) and transcription (7.02 minutes and 5.40 minutes, respectively) than attendings reading independently.
Conclusion
Neuroradiologist time/activity distributions for reading brain MRI studies were measured, setting the stage to establish a benchmark for future reference and suggesting opportunities for greater efficiency. Furthermore, report production time can be decreased when a draft report is available.
INTRODUCTION
There is constant pressure on radiologists’ productivity, with declining reimbursements for imaging in the United States and increasing demands for faster reporting times. For those practicing in an academic setting, educational commitments confound clinical productivity. Fortunately, these factors have been accompanied by technological advances to enhance productivity. Transition from film-based interpretation to picture archiving and communication system (PACS) allowed more rapid presentation and evaluation of images ( ). Adoption of voice recognition transcription and digital report transmission allows shorter reporting time ( ). Adoption of electronic medical records (EMRs) now provides new access to a wealth of clinical and laboratory history in real time. In short, what used to take several days from scan acquisition to the final report now can be completed in minutes to hours.
Although image interpretation remains the most fundamental activity of the radiologist, few studies have evaluated details of this process. Some studies have documented complete report turnaround time ( ), but have limitations and leave open questions. Reporting times for individual studies were estimated instead of directly measured and specific activities performed as part of generation of each report were not assessed. Further, in current academic practice there are several types of clinical assignments, ranging from teaching services with house staff to review of overnight studies, to shifts of independent reading akin to the private practitioner, each with different reporting demands. Lastly, direct comparison of reporting activities between attendings and trainees has not previously been reported.
Get Radiology Tree app to read full this article<
MATERIAL AND METHODS
Get Radiology Tree app to read full this article<
Get Radiology Tree app to read full this article<
Get Radiology Tree app to read full this article<
RESULTS
Total Reporting Duration
Get Radiology Tree app to read full this article<
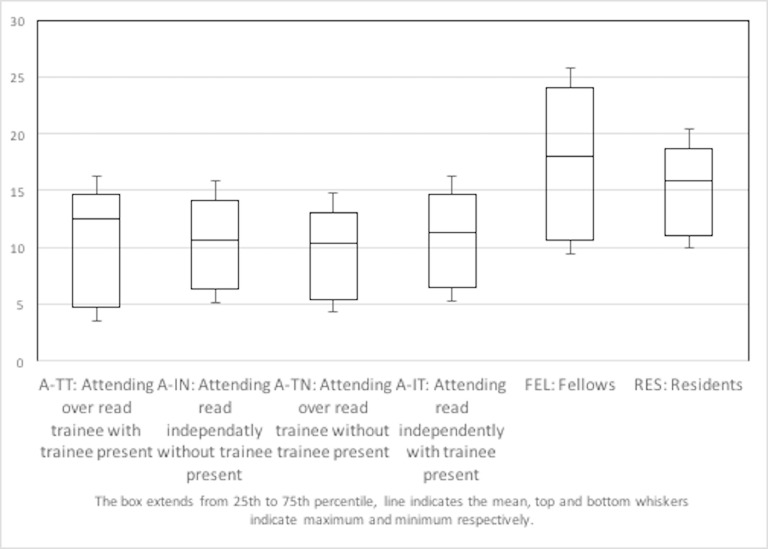
Table 1
Total Duration for Report Generation for Each Attending Radiologist Assignment
Group_n_ Mean Stand Error A-IN 44 11.01 0.87 A-IT 80 11.29 0.79 A-TN 33 10.41 1.42 A-TT 91 12.55 1.30
A-IN, attending independent read on nonteaching service; A-IT, attending independent read on teaching service; A-TN, attending review of trainees on nonteaching rotation; A-TT, attending review of trainees on a teaching service.
Get Radiology Tree app to read full this article<
Get Radiology Tree app to read full this article<
Table 2
Total Reporting Duration of Primary Reads (Cases with no Preliminary Report Available) for Attending Neuroradiologists, Fellows, and Residents Reading Independently on a Daytime Teaching Service
Group_n_ Mean Stand Error Attendings (A-IT) 80 11.29 0.79 Fellows 76 18.36 1.05 Residents 34 16.31 1.11
A-IT, attending independent read on teaching service.
Get Radiology Tree app to read full this article<
Activity/Time Distribution
Get Radiology Tree app to read full this article<
Get Radiology Tree app to read full this article<
Get Radiology Tree app to read full this article<
Interobserver Variability
Get Radiology Tree app to read full this article<
DISCUSSION
Get Radiology Tree app to read full this article<
Get Radiology Tree app to read full this article<
Get Radiology Tree app to read full this article<
Get Radiology Tree app to read full this article<
Get Radiology Tree app to read full this article<
CONCLUSION
Get Radiology Tree app to read full this article<
Funding
Get Radiology Tree app to read full this article<
Get Radiology Tree app to read full this article<
References
1. Kundel HL, Seshadri SB, Langlotz CP, et. al.: Prospective study of a PACS: information flow and clinical action in a medical intensive care unit. Radiology 1996; 199: pp. 143-149.
2. Mackinnon AD, Billington RA, Adam EJ, et. al.: Picture archiving and communication systems lead to sustained improvements in reporting times and productivity: results of a 5-year audit. Clin Radiol 2008; 63: pp. 796-804.
3. Redfern RO, Horii SC, Feingold E, et. al.: Radiology workflow and patient volume: effect of picture archiving and communication systems on technologists and radiologists. J Digit Imaging 2000; 13: pp. 97-100.
4. Twair AA, Torreggiani WC, Mahmud SM, et. al.: Significant savings in radiologic report turnaround time after implementation of a complete picture archiving and communication system (PACS). J Digit Imaging 2000; 13: pp. 175-177.
5. Mattern CW, King BF, Hangiandreou NJ, et. al.: Electronic imaging impact on image and report turnaround times. J Digit Imaging 1999; 12: pp. 155-159.
6. Hayt DB, Alexander S: The pros and cons of implementing PACS and speech recognition systems. J Digit Imaging 2001; 14: pp. 149-157.
7. Sokolovskaya E, Shinde T, Ruchman RB, et. al.: The effect of fasterreporting speed for imaging studies on the number of misses and interpretation errors: a pilot study. J Am Coll Radiol 2015; 12: pp. 683-688. Available from: http://www.ncbi.nlm.nih.gov/pubmed/26003588
8. McDonald RJ, Schwartz KM, Eckel LJ, et. al.: The effects of changes in utilization and technological advancements of cross-sectional imaging on radiologist workload. Acad Radiol 2015; 22: pp. 1191-1198. Available from: http://www.ncbi.nlm.nih.gov/pubmed/26210525
9. Cohen MD, Gunderman RB, Frank MS, et. al.: Challenges facing radiology educators. J Am Coll Radiol 2005; 2: pp. 681-687.
10. England E, Collins J, White RD, et. al.: Radiology report turnaround time: effect on resident education. Acad Radiol 2015; 22: pp. 662-667.
11. Boland GWL.: Stakeholder expectations for radiologists: obstacles or opportunities?. JACR J Am Coll Radiol 2006; 3: pp. 156-163.
12. Boland GWL: Government reform of the national health service: implications for radiologists and diagnostic services. Br J Radiol 2006; 79: pp. 861-865.