
Rationale and Objectives
To compare adaptive statistical iterative reconstruction (ASIR) and model-based iterative reconstruction (MBIR) algorithms for reduced-dose computed tomography (CT).
Materials and Methods
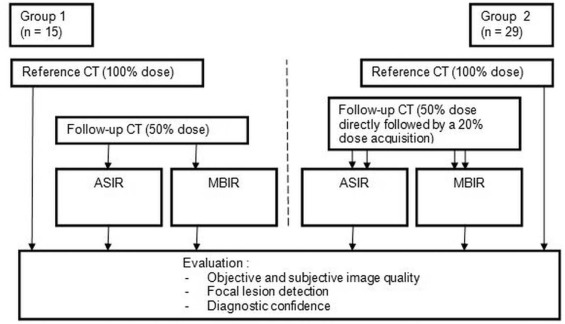
Forty-four young oncology patients (mean age 30 ± 9 years) were included. After routine thoraco-abdominal CT (dose 100%, average CTDI vol 9.1 ± 2.4 mGy, range 4.4–16.9 mGy), follow-up CT was acquired at 50% (average CTDI vol 4.5 ± 1.2 mGy, range 2.2–8.4 mGy) in 29 patients additionally at 20% dose (average CTDI vol 1.9 ± 0.5 mGy, range 0.9–3.4 mGy). Each reduced-dose CT was reconstructed using both ASIR and MBIR. Four radiologists (two juniors and two seniors) blinded to dose and technique read each set of CT images regarding objective and subjective image qualities (high- or low-contrast structures), subjective noise or pixilated appearance, diagnostic confidence, and lesion detection.
Results
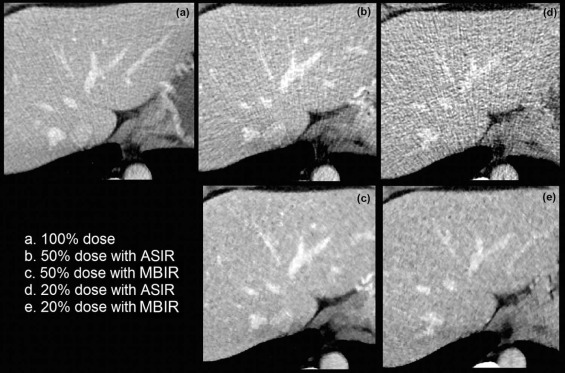
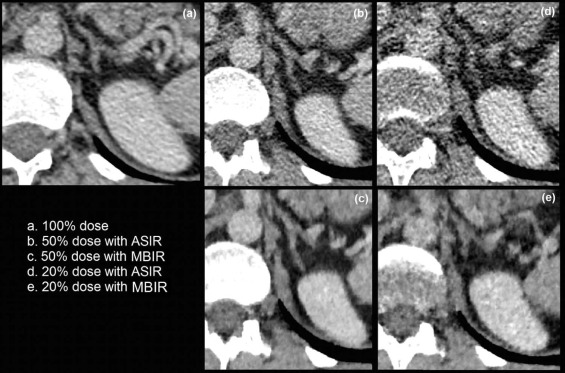
At all dose levels, objective image noise was significantly lower with MBIR than with ASIR ( P < 0.001). The subjective image quality for low-contrast structures was significantly higher with MBIR than with ASIR ( P < 0.001).
Reduced-dose abdominal CT images of patients with higher body mass index (BMI) were read with significantly higher diagnostic confidence than images of slimmer patients ( P < 0.001) and had higher subjective image quality, regardless of technique.
Although MBIR images appeared significantly more pixilated than ASIR images, they were read with higher diagnostic confidence, especially by juniors ( P < 0.001).
Conclusions
Reduced-dose CT during the follow-up of young oncology patients should be reconstructed with MBIR to ensure diagnostic quality. Elevated body mass index does not hamper the quality of reduced-dose CT.
Introduction
Get Radiology Tree app to read full this article<
Get Radiology Tree app to read full this article<
Get Radiology Tree app to read full this article<
Get Radiology Tree app to read full this article<
Materials and Methods
Patients
Get Radiology Tree app to read full this article<
Get Radiology Tree app to read full this article<
Get Radiology Tree app to read full this article<
CT Examinations and Image Reconstruction
Get Radiology Tree app to read full this article<
Get Radiology Tree app to read full this article<
Get Radiology Tree app to read full this article<
Get Radiology Tree app to read full this article<
Get Radiology Tree app to read full this article<
Get Radiology Tree app to read full this article<
Table 1
Patients’ Exposition Dose
Type of Examination Reference CT (100% Dose) Follow-up CT (50% Dose) Follow-up CT (20% Dose) Patients’ CTDI vol Abdominal CT ( n = 10) 8.7 mGy (range 6.6–12.5 mGy) 4.4 mGy (range 3.1–6.2 mGy) 1.9 mGy (range 1.6–2.4 mGy) Thoracoabdominal CT ( n = 34) 9.2 mGy (range 4.4–17 mGy) 4.58 mGy (range 2.2–8.4 mGy) 1.9 mGy (range 0.9–3.4 mGy) Total CTDI vol 9.1 ± 2.4 mGy (range 4.4–16.9 mGy) 4.5 ± 1.2 mGy (range 2.2–8.4 mGy) 1.9 ± 0.5 mGy (range 0.9–3.4 mGy) Patients’ dose-length products (DLP) Abdominal CT ( n = 10) 675.6 mGy × cm (range 367–998) 311.8 mGy × cm (range 194–448) 115.2 mGy × cm (range 77–155) Thoraco-abdominal CT ( n = 34) 730.5 mGy × cm (range 310–1302) 355.3 mGy × cm (range 149–580) 134.4 mGy × cm (range 53–232) Total DLP 718.0 ± 225 mGy × cm (range 310–1302) 345.4 ± 102.5 mGy × cm (range 149–580) 131.1 ± 35.9 mGy × cm (range 53–232)
CT, computed tomography; CTDI, computed tomography dose index.
Get Radiology Tree app to read full this article<
Image Analysis
Get Radiology Tree app to read full this article<
Objective Image Quality
Get Radiology Tree app to read full this article<
Subjective Image Quality
Get Radiology Tree app to read full this article<
Get Radiology Tree app to read full this article<
Get Radiology Tree app to read full this article<
Get Radiology Tree app to read full this article<
Focal Lesion Detection
Get Radiology Tree app to read full this article<
Statistical Analysis
Get Radiology Tree app to read full this article<
Get Radiology Tree app to read full this article<
Results
Patients and Examination Types
Get Radiology Tree app to read full this article<
Get Radiology Tree app to read full this article<
Evaluation of Reference CT Images and Comparison to ASIR and MBIR Images at 50% Dose
Get Radiology Tree app to read full this article<
Table 2
Evaluation Scores According to the Dose Reduction and the Reconstruction Algorithm (Four Readers)
CT
Dose Reduction
Type of IR Reference 100% 50% ASIR 50% MBIR_P_ Value ( t Test) 20% ASIR 20% MBIR_P_ Value ( t Test)Objective image quality (in Hounsfield units) Average density 67.66 67.95 67.27 0.40 69.52 67.30 0.06 Standard deviation 18.68 25.80 13.34 <0.001 \* 40.82 16.94 <0.001 \* Subjective image quality__High-contrast structures (5-point scale, 1 = best, 5 = worst) Pericardium 1.22 1.61 1.65 0.58 2.76 2.77 0.95 Chest wall 1.51 2.18 2.21 0.72 3.72 3.57 0.10 Adrenal glands 1.51 2.35 2.27 0.37 3.66 2.88 <0.001 \* Superficial epigastric vessels 1.21 1.97 1.89 0.30 3.45 2.68 <0.001 \* Low- contrast structures (5-point scale, 1 = best, 5 = worst) Portal veins 1.55 2.45 2.15 <0.001 \* 3.98 3.08 <0.001 \* Hepatic veins 1.72 2.47 2.08 <0.001 \* 3.78 2.98 <0.001 \* Subjective image noise/pixilated appearance (5-point scale, 1 = best, 5 = worst) Chest noise 1.28 2.41 1.21 <0.001 \* 3.48 2.06 <0.001 \* Chest-pixilated appearance 1 1.01 2.27 <0.001 \* 1.48 2.62 <0.001 \* Abdomen noise 1.64 3.14 1.32 <0.001 \* 3.07 1.65 <0.001 \* Abdomen-pixilated appearance 1.01 1 2.64 <0.001 \* 1.72 3.08 <0.001 \* Overall diagnostic confidence (4-point scale, 1 = best, 4 = worst) Chest 1 1.53 1.5 0.73 2.47 2.45 0.85 Abdomen 1.12 2.08 1.76 <0.001 \* 3.06 2.24 <0.001 \*
ASIR, adaptive statistical iterative reconstruction; CT, computed tomography; IR, iterative reconstruction; MBIR, model-based iterative reconstruction.
Get Radiology Tree app to read full this article<
Get Radiology Tree app to read full this article<
Get Radiology Tree app to read full this article<
Get Radiology Tree app to read full this article<
Comparison Between Reduced-Dose ASIR and MBIR Images
Get Radiology Tree app to read full this article<
Get Radiology Tree app to read full this article<
Get Radiology Tree app to read full this article<
Get Radiology Tree app to read full this article<
Get Radiology Tree app to read full this article<
Get Radiology Tree app to read full this article<
Get Radiology Tree app to read full this article<
Influence of BMI on Quality of ASIR and MBIR Images
Get Radiology Tree app to read full this article<
Table 3
Influence of the BMI on the Image Evaluation (Four Readers)
Group of BMI BMI ≤ 24.7 BMI >24.7 BMI ≤ 24.7 BMI >24.7P Value † Dose Reduction
Type of IR 50%
ASIR 50%
MBIR 50%
ASIR 50%
MBIR 20%
ASIR 20%
MBIR 20%
ASIR 20%
MBIR_Objective image quality (in Hounsfield units)_ Average density 70.98 70.67 64.62 63.55 74.70 72.29 64.68 62.64 <0.001 \* Standard deviation 24.16 11.76 27.60 15.08 38.07 15.34 43.39 18.43 <0.001 \* Subjective image quality__High-contrast structures (5-point scale, 1 = best, 5 = worst) Pericardium 1.70 1.74 1.52 1.56 2.82 2.80 2.70 2.73 0.051 Chest wall 2.35 2.39 1.99 2.01 3.86 3.75 3.58 3.4 <0.001 \* Adrenal glands 2.62 2.48 2.05 2.05 3.91 3.05 3.43 2.72 <0.001 \* Superficial epigastric vessels 2.10 1.93 1.82 1.83 3.57 2.82 3.33 2.55 <0.001 \* Low-contrast structures (5-point scale, 1 = best, 5 = worst) Portal veins 2.48 2.14 2.42 2.17 3.88 3.00 4.08 3.15 0.441 Hepatic veins 2.38 1.99 2.56 2.18 3.66 2.93 3.88 3.03 <0.001 \* Subjective image noise/pixilated appearance (5-pointscale, 1 = best, 5 = worst) Chest noise 2.49 1.21 2.33 1.20 3.5 2.06 3.5 2.06 0.394 Chest-pixilated appearance 1.01 2.34 1 2.19 1.52 2.67 1.44 2.58 0.193 Abdomen noise 3.18 1.27 3.08 1.37 3.04 1.63 3.1 1.67 0.817 Abdomen-pixilated appearance 1 2.65 1 2.63 1.75 3.09 1.7 3.07 0.772Overall diagnostic confidence (4-point scale, 1 = best, 4 = worst) Chest 1.59 1.55 1.45 1.44 2.52 2.49 2.42 2.42 0.067 Abdomen 2.16 1.84 1.99 1.68 3.05 2.36 3.07 2.13 <0.001 \*
ANOVA, analysis of variance; ASIR, adaptive statistical iterative reconstruction; BMI, body mass index; IR, iterative reconstruction; MBIR, model-based iterative reconstruction.
Get Radiology Tree app to read full this article<
Get Radiology Tree app to read full this article<
Get Radiology Tree app to read full this article<
Get Radiology Tree app to read full this article<
Influence of Reader Experience on Evaluation of ASIR and MBIR Images
Get Radiology Tree app to read full this article<
Table 4
Influence of the Readers’ Experience on the Image Evaluation
Group of Reader Juniors Seniors Juniors Seniors_P_ Value † Dose Reduction
Type of IR 50%
ASIR 50%
VEO 50%
ASIR 50%
VEO 20%
ASIR 20%
VEO 20%
ASIR 20%
VEO_Objective image quality (in Hounsfield units)_ Average density 68.48 67.28 67.41 67.26 69.71 66.71 69.33 67.89 0.08 Standard deviation 25.49 14 26.11 12.68 41.16 17.71 40.48 16.17 0.18Subjective image quality__High-contrast structures (5-point scale, 1 = best, 5 = worst) Pericardium 1.81 1.97 1.42 1.34 3.17 3.26 2.34 2.28 <0.001 \* Chest wall 2.56 2.6 1.80 1.82 3.88 3.79 3.55 3.34 <0.001 \* Adrenal glands 2.38 2.32 2.32 2.23 3.76 2.57 3.58 3.19 0.55 Superficial epigastric vessels 2.13 2.09 1.81 1.68 3.72 2.45 3.17 2.91 <0.001 \* Low-contrast structures (5-point scale, 1 = best, 5 = worst) Portal veins 2.33 1.86 2.57 2.44 4.09 2.59 3.88 3.57 <0.001 \* Hepatic veins 2.42 1.84 2.51 2.32 3.78 2.57 3.78 3.49 <0.001 \* Subjective image noise/pixilated appearance (5-point scale, 1 = best, 5 = worst) Chest noise 2.64 1.41 2.19 1 3.54 3.12 3.42 1 <0.001 \* Chest-pixilated appearance 1 2.31 1.01 2.23 1.96 2.18 1 3.06 0.52 Abdomen noise 3.57 1.60 2.7 1.03 2.31 2.19 3.83 1.10 <0.001 \* Abdomen-pixilated appearance 1 2.69 1 2.59 2.43 2.55 1.02 3.60 0.11Overall diagnostic confidence (4-point scale, 1 = best, 4 = worst) Chest 1.99 1.84 1.07 1.16 2.78 2.76 2.16 2.14 <0.001 \* Abdomen 2.70 2.15 1.45 1.38 3.26 2.05 2.86 2.43 <0.001 \*
ANOVA, analysis of variance; ASIR, adaptive statistical iterative reconstruction; IR, iterative reconstruction.
Get Radiology Tree app to read full this article<
Get Radiology Tree app to read full this article<
Get Radiology Tree app to read full this article<
Get Radiology Tree app to read full this article<
Focal Lesion Detection According to Dose and Type of IR
Get Radiology Tree app to read full this article<
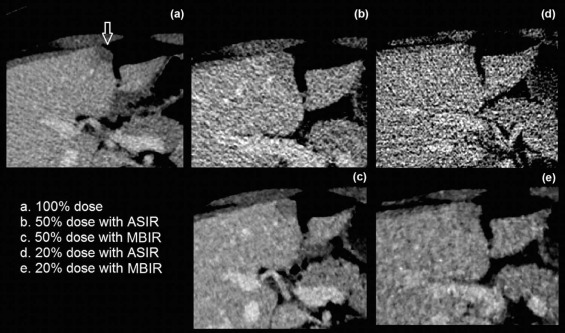
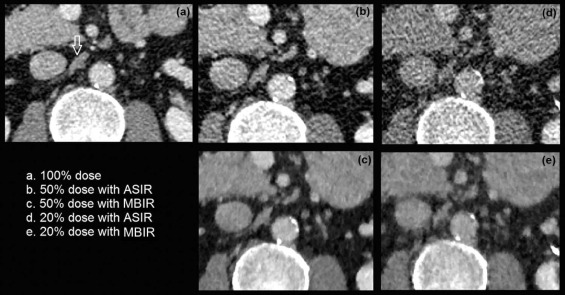
Table 5
Interobserver Agreement Between the Four Readers for Detecting Focal Lesions on Reduced Dose CT Examinations
Kappa Values Focal Parenchymal Lesions Lymphadenopathies Mean Median Mean Median ASIR 50% 0.59 0.61 0.51 0.51 VEO 50% 0.62 0.64 0.53 0.55 ASIR 20% 0.31 0.33 0.09 0 VEO 20% 0.33 0.37 0.031 0.01
ASIR, adaptive statistical iterative reconstruction; CT, computed tomography.
Get Radiology Tree app to read full this article<
Discussion
Get Radiology Tree app to read full this article<
Get Radiology Tree app to read full this article<
Get Radiology Tree app to read full this article<
Get Radiology Tree app to read full this article<
Get Radiology Tree app to read full this article<
Get Radiology Tree app to read full this article<
Get Radiology Tree app to read full this article<
Get Radiology Tree app to read full this article<
Get Radiology Tree app to read full this article<
Get Radiology Tree app to read full this article<
Get Radiology Tree app to read full this article<
References
1. Brenner D.J., Hall E.J.: Computed tomography–an increasing source of radiation exposure. N Engl J Med 2007; 357: pp. 2277-2284.
2. Samara E.T., Aroua A., Bochud F.O., et. al.: Exposure of the Swiss population by medical X-rays: 2008 review. Health Phys 2012; 102: pp. 263-270.
3. Hara A.K., Paden R.G., Silva A.C., et. al.: Iterative reconstruction technique for reducing body radiation dose at CT: feasibility study. AJR Am J Roentgenol 2009; 193: pp. 764-771.
4. Pearce M.S., Salotti J.A., Little M.P., et. al.: Radiation exposure from CT scans in childhood and subsequent risks of leukaemia and brain tumors: a retrospective study. Lancet 2012; 380: pp. 499-505.
5. Mathews J.D., Forsythe A.V., Brady Z., et. al.: Cancer risk in 680 000 people exposed to computed tomography scans in childhood or adolescence: data linkage study of 11 million Australians. BMJ 2013; 346: pp. 346. f2360
6. Patino M., Fuentes J.M., Singh S., et. al.: Iterative reconstruction techniques in abdominopelvic CT: technical concepts and clinical implementation. AJR Am J Roentgenol 2015; 205: pp. W19-W31.
7. Willemink M.J., de Jong P.A., Leiner T., et. al.: Iterative reconstruction techniques. Eur Radiol 2013; 23: pp. 1623-1631.
8. Vardhanabhuti V., Riordan R.D., Mitchell G., et. al.: Image comparative assessment using iterative reconstructions. Invest Radiol 2014; 49: pp. 209-216.
9. Pickhardt J., Lubner M.G., Kim D.H., et. al.: Abdominal CT with model-based iterative reconstruction (MBIR): initial results of a prospective trial comparing ultralow-dose with standard-dose. AJR Am J Roentgenol 2012; 199: pp. 1266-1274.
10. Ploussi A., Alexopoulou E., Economopoulos N., et. al.: Patient radiation exposure and image quality evaluation with the use of idose 4 iterative reconstruction algorithm in chest-abdomen-pelvis CT examinations. Radiat Prot Dosimetry 2014; 158: pp. 399-405.
11. Fontarensky M., Alfidja A., Perignon R., et. al.: Reduced radiation dose with model-based iterative reconstruction versus standard dose with adaptive statistical iterative reconstruction in abdominal CT for diagnosis of acute renal colic. Radiology 2015; 276: pp. 156-166.
12. Gervaise A., Naulet P., Beuret F., et. al.: Low-dose CT with automatic tube current modulation, adaptive statistical iterative reconstruction, and low tube voltage for the diagnosis of renal colic: impact of body mass index. AJR Am J Roentgenol 2014; 202: pp. 553-560.
13. Prakash P., Kalra M.K., Kambadakone A.K., et. al.: Reducing abdominal CT radiation dose with adaptive statistical iterative reconstruction technique. Invest Radiol 2010; 45: pp. 202-210.
14. Padole A., Ali Khawaja R.D., Kalra M.K., et. al.: CT radiation dose and iterative reconstruction techniques. AJR Am J Roentgenol 2015; 204: pp. W384-W392.
15. Singh S., Kalra M.K., Hsieh J., et. al.: Abdominal CT: comparison of adaptive statistical iterative and filtered back projection reconstruction techniques. Radiology 2010; 257: pp. 373-383.
16. May M.S., Wüst W., Brand M., et. al.: Dose reduction in abdominal computed tomography. Invest Radiol 2012; 46: pp. 465-470.
17. Schabel C., Fenchel M., Schmidt B., et. al.: Clinical evaluation and potential radiation dose reduction of the novel sinogram-affirmed iterative reconstruction technique (SAFIRE) in abdominal computed tomography angiography. Acad Radiol 2013; 20: pp. 165-172.
18. Hérin E., Gardavaud F., Charadia M., et. al.: Use of model-based iterative reconstruction (MBIR) in reduced-dose CT for routine follow-up of patients with malignant lymphoma: dose savings, image quality and phantom study. Eur Radiol 2015; 25: pp. 2362-2370.
19. Kalmar P.I., Quehenberger F., Steiner J., et. al.: The impact of iterative reconstruction on image quality and radiation dose in thoracic and abdominal CT. Eur J Radiol 2014; 83: pp. 1416-1420.
20. Arapakis I., Efstathopoulos E., Tsitsia V., et. al.: Using “iDose 4 ” iterative reconstruction algorithm in adults’ chest–abdomen–pelvis CT examinations: effect on image quality in relation to patient radiation exposure. Br J Radiol 2014; 87: pp. 20130613.
21. Meyer M., Klein S.A., Brix G., et. al.: Whole-body CT for lymphoma staging: feasibility of halving radiation dose and risk by iterative image reconstruction. Eur J Radiol 2014; 83: pp. 315-321.
22. Gonzalez-Guindalini F.D., Ferreira Botelho M.P., Töre H.G., et. al.: MDCT of chest, abdomen, and pelvis using attenuation-based automated tube voltage selection in combination with iterative reconstruction: an intrapatient study of radiation dose and image quality. AJR Am J Roentgenol 2013; 201: pp. 1075-1082.
23. Karpitschka M., Augart D., Becker H.-C., et. al.: Dose reduction in oncological staging multidetector CT: effect of iterative reconstructions. Br J Radiol 2013; 86: pp. 20120224.
24. Smith E., Dillman J.R., Goodsitt M.M., et. al.: Model-based iterative reconstruction: effect on patient radiation dose and image quality in pediatric body CT. Radiology 2014; 270: pp. 526-534.
25. Brenner D.J., Doll R., Goodhead D.T., et. al.: Cancer risks attributable to low doses of ionizing radiation: assessing what we really know. Proc Natl Acad Sci USA 2003; 100: pp. 13761-13766.
26. Padole A., Singh S., Lira D., et. al.: Assessment of filtered back projection, adaptive statistical and model-based iterative reconstruction for reduced dose abdominal computed tomography. J Comput Assist Tomogr 2015; 39: pp. 462-467.
27. Martinsen A.C.T., Saether H.K., Hol P.K., et. al.: Iterative reconstruction reduces abdominal CT dose. Eur J Radiol 2012; 81: pp. 1483-1487.
28. Thomas P., Hayton A., Beveridge T., et. al.: Evidence of dose saving in routine CT practice using iterative reconstruction derived from a national diagnostic reference level survey. Br J Radiol 2015; 88: pp. 20150380.
29. Klink T., Obmann V., Heverhagen J., et. al.: Reducing CT radiation dose with iterative reconstruction algorithms: the influence of scan and reconstruction parameters on image quality and CTDI vol . Eur J Radiol 2014; 83: pp. 1645-1654.
30. Ehman E.C., Yu L., Manduca A., et. al.: Methods for clinical evaluation of noise reduction techniques in abdominopelvic CT. Radiographics 2014; 34: pp. 849-862.
31. Solomon J., Mileto A., Nelson R.C., et. al.: Quantitative features of liver lesions, lung nodules, and renal stones at multi-detector row CT examinations. Radiology 2016; 279: pp. 185-194.
32. Minhas A., Patel S., Kazerooni E.A., et. al.: Iterative reconstruction results in larger computed tomography measurements of iliofemoral artery diameter in patients referred for transcatheter aortic valve replacement. J Comput Assist Tomogr 2016; 40: pp. 773-776.