
Rationale and Objectives
This study aimed to differentiate pathologically defined lepidic predominant lesions (LPL) from more invasive adenocarcinomas (INV) using three-dimensional (3D) volumetric density and first-order texture histogram analysis of surgically excised stage 1 lung adenocarcinomas.
Materials and Methods
This retrospective study was institutional review board approved and Health Insurance Portability and Accountability Act compliant. Sixty-four cases of pathologically proven stage 1 lung adenocarcinoma surgically resected between September 2006 and October 2015, including LPL ( n = 43) and INV ( n = 21), were evaluated using high-resolution computed tomography. Quantitative measurements included nodule volume, percent solid volume (% solid), and first-order texture histogram analysis including skewness, kurtosis, entropy, and mean nodule attenuation within each histogram quartile. Binomial logistic regression models were used to identify the best set of parameters distinguishing LPL from INV.
Results
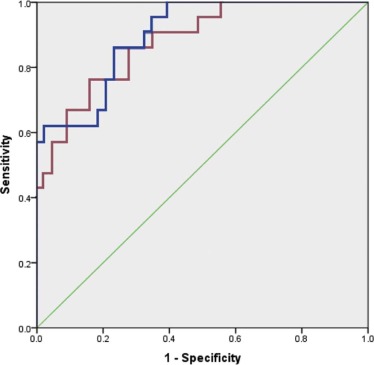
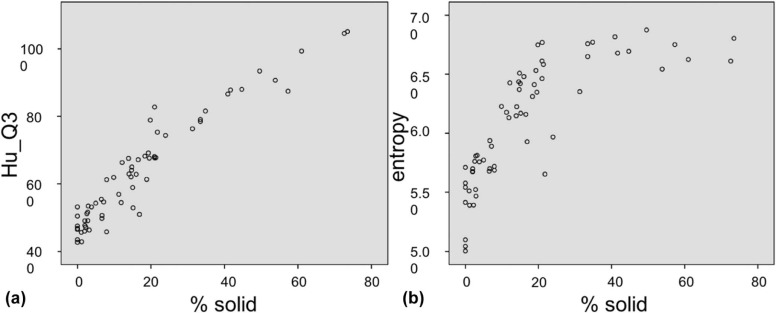
Univariate analysis of 3D volumetric density and histogram features was statistically significant between LPL and INV groups ( P < .05). Accuracy of a binomial logistic model to discriminate LPL from INV based on size and % solid was 85.9%. With optimized probability cutoff, the model achieves 81% sensitivity, 76.7% specificity, and area under the receiver operating characteristic curve of 0.897 (95% confidence interval, 0.821–0.973). An additional model based on size and mean nodule attenuation of the third quartile (Hu_Q3) of the histogram achieved similar accuracy of 81.3% and area under the receiver operating characteristic curve of 0.877 (95% confidence interval, 0.790–0.964).
Conclusions
Both 3D volumetric density and first-order texture analysis of stage 1 lung adenocarcinoma allow differentiation of LPL from more invasive adenocarcinoma with overall accuracy of 85.9%–81.3%, based on multivariate analyses of either size and % solid or size and Hu_Q3, respectively.
Introduction
To date, numerous publications have correlated the pathologic spectrum of lung adenocarcinoma with computed tomography (CT) findings . Although differentiation among these varying CT patterns has important management implications, morphologic distinctions along the spectrum of peripheral adenocarcinomas have shown considerable overlap, including pronounced inter- and intraobserver variability in visual differentiation of nodule features, rendering sole reliance on morphologic characterization problematic . Based on these limitations, recent efforts have moved toward quantitative CT methods of differentiating pathologic subtypes, specifically documenting a role for advanced, quantitative assessment of peripheral lung nodules, while taking into account previous evidence that nodule size positively correlates with tumor invasiveness . Most recently, quantitative CT assessment has included both two-dimensional and three-dimensional (3D) volumetric density and texture or histogram analysis to more precisely characterize these lesions. Encouraging preliminary results were obtained using a 3D volumetric model that emphasizes the proportion of solid component(s) of part-solid lung nodules to differentiate between three specimen groups: a combined group of preinvasive adenocarcinoma in situ (AIS) and minimally invasive adenocarcinoma (MIA), lepidic predominant adenocarcinoma (LPA), and more invasive forms of adenocarcinoma (INV); a statistically significant difference in percentage solid volume (% solid) was found between LPA and INV groups .
As defined by the International Association for the Study of Lung Cancer (IASLC) and the World Health Organization, LPA is a variant of invasive adenocarcinoma in which bland, non-malignant cells predominate, associated with at least one focus of invasion measuring >5 mm in largest dimension, with evidence of tumor necrosis, invasion of lymphatics, blood vessels or pleura, or spread through alveolar spaces . In distinction, more invasive subtypes include acinar, papillary, and micropapillary predominant subtypes, as well as the solid tumor subtype. Pathologic subtypes of lepidic predominant and more invasive lesions have shown to have clear prognostic implications . In a study of 210 postsurgical patients, a combined group of patients with AIS, MIA, and LPA had a 5-year survival of 93%, whereas patients with more invasive subtypes had a worse prognosis, with 71%, 68%, 39%, and 38% 5-year survivals for papillary, acinar, solid, and micropapillary-predominant types, respectively ( P < .0001) . More specifically, patients with AIS and MIA have been reported to have 5-year disease-free survival (DFS) near 100% following surgical resection, with non-mucinous LPA having DFS of 90%–94% . Furthermore, the cumulative incidence of recurrence was zero among patients with AIS and MIA, and disease in patients with LPA was significantly less likely to recur versus more invasive forms of adenocarcinoma (5-year cumulative incidence of recurrence of 8% vs 19%, P = .003) .
Get Radiology Tree app to read full this article<
Get Radiology Tree app to read full this article<
Materials and Methods
Patient and CT Data
Get Radiology Tree app to read full this article<
Get Radiology Tree app to read full this article<
Get Radiology Tree app to read full this article<
Get Radiology Tree app to read full this article<
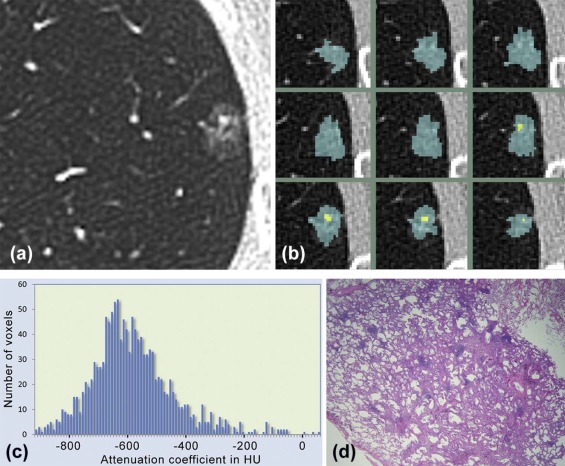
Automated 3D Nodule Segmentation, Volumetric Density, and First-order Texture Analysis
Get Radiology Tree app to read full this article<
%Solid=Vsol/(Vsol+Vsubs) %
Solid
=
Vsol
/
(
Vsol
+
Vsubs
)
Get Radiology Tree app to read full this article<
Get Radiology Tree app to read full this article<
Statistical Analyses
Get Radiology Tree app to read full this article<
Results
Get Radiology Tree app to read full this article<
TABLE 1
Quantitative imaging measurements of invasive adenocarcinoma (INV) and lepidic predominant lesions (LPL), a group that includes both lepidic predominant (LPA) and minimally invasive adenocarcinoma (MIA) ( P < .05)
Measure Mean INV SD INV Mean LPL SD LPL t_P_ Volume (mm 3 ) 3558.0 3680.8 1663.5 2597.4 −2.380 .020 Size (mm) 8.2 3.0 5.9 2.8 −3.008 .004 Solid vol (mm 3 ) 1627.3 2352.6 219.1 416.8 −3.834 <.001 % Solid 35.4 20.2 9.0 8.4 −7.426 <.001 Skewness 0.352 0.584 1.350 0.757 5.308 <.001 Kurtosis −0.419 0.839 2.938 5.977 2.552 .013 Entropy 6.516 0.279 5.896 0.462 −5.651 <.001 Mean HU −315 114 −479 82 −6.567 <.001 Hu_Q1 −598 51 −645 17 −5.436 <.001 Hu_Q2 −419 136 −568 56 −6.206 <.001 Hu_Q3 −237 159 −459 105 −6.660 <.001 Hu_Q4 −10 134 −247 154 −6.017 <.001
HU, Hounsfield unit; INV, invasive adenocarcinoma; LPL, lepidic predominant lesions; SD, standard deviation.
TABLE 2
Binomial regression models differentiating INV from LPL
Model Model 1 Model 2 Independent variables_Size__Size__%solid__Hu_Q3_ Chi-square 37.1 30.1 Log likelihood 43.9 50.9 Overall accuracy 85.9% 81.3%P Value <0.001 <0.001 Generalized R 2 0.440 0.375
INV, invasive adenocarcinoma; LPL, lepidic predominant lesions.
Get Radiology Tree app to read full this article<
Get Radiology Tree app to read full this article<
Get Radiology Tree app to read full this article<
Get Radiology Tree app to read full this article<
TABLE 3
Prediction of invasive adenocarcinoma for two models at varying probability cutoffs
Model M1 Model M2 Cutoff #FNeg Sens #Fpos Spec #Fneg Sens #Fpos Spec 0.50 8 61.9% 1 97.7% 8 61.9% 4 90.7% 0.45 8 61.9% 2 95.3% 8 61.9% 4 90.7% 0.40 8 61.9% 6 86.0% 7 66.7% 6 86.0% 0.35 7 66.7% 9 79.1% 6 71.4% 7 83.7% 0.30 6 71.4% 9 79.1% 5 76.2% 11 74.4% 0.25 \* 4 81.0% 10 76.7% 4 81.0% 12 72.1% 0.20 2 90.5% 15 65.1% 2 90.5% 15 65.1% 0.15 1 95.2% 16 62.8% 2 90.5% 16 62.8%
#F neg, number of false-negative cases; #F pos, number of false-positive cases; Sens, sensitivity; Spec, specificity.
Get Radiology Tree app to read full this article<
Get Radiology Tree app to read full this article<
Get Radiology Tree app to read full this article<
Get Radiology Tree app to read full this article<
Discussion
Get Radiology Tree app to read full this article<
Get Radiology Tree app to read full this article<
Get Radiology Tree app to read full this article<
Get Radiology Tree app to read full this article<
Get Radiology Tree app to read full this article<
Get Radiology Tree app to read full this article<
Get Radiology Tree app to read full this article<
Get Radiology Tree app to read full this article<
References
1. Noguchi M., Morikawa A., Kawasaki M., et. al.: Small adenocarcinoma of the lung. Histologic characteristics and prognosis. Cancer 1995; 75: pp. 2844-2852.
2. Jiang B., Takashima S., Miyake C., et. al.: Thin-section CT findings in peripheral lung cancer of 3 cm or smaller: are there any characteristic features for predicting tumor histology or do they depend only on tumor size?. Acta Radiol 2014; 55: pp. 302-308.
3. Honda T., Kondo T., Murakami S., et. al.: Radiographic and pathological analysis of small lung adenocarcinoma using the new IASLC classification. Clin Radiol 2013; 68: pp. e21-e26.
4. Kim H.Y., Shim Y.M., Lee K.S., et. al.: Persistent pulmonary nodular ground-glass opacity at thin-section CT: histopathologic comparisons. Radiology 2007; 245: pp. 267-275.
5. Lim H.J., Ahn S., Lee K.S., et. al.: Persistent pure ground-glass opacity lung nodules >/= 10 mm in diameter at CT scan: histopathologic comparisons and prognostic implications. Chest 2013; 144: pp. 1291-1299.
6. Zhang Y., Qiang J.W., Ye J.D., et. al.: High resolution CT in differentiating minimally invasive component in early lung adenocarcinoma. Lung Cancer 2014; 84: pp. 236-241.
7. Takahashi M., Shigematsu Y., Ohta M., et. al.: Tumor invasiveness as defined by the newly proposed IASLC/ATS/ERS classification has prognostic significance for pathologic stage IA lung adenocarcinoma and can be predicted by radiologic parameters. J Thorac Cardiovasc Surg 2014; 147: pp. 54-59.
8. Lee S.M., Park C.M., Goo J.M., et. al.: Invasive pulmonary adenocarcinomas versus preinvasive lesions appearing as ground-glass nodules: differentiation by using CT features. Radiology 2013; 268: pp. 265-273.
9. Lee K.H., Goo J.M., Park S.J., et. al.: Correlation between the size of the solid component on thin-section CT and the invasive component on pathology in small lung adenocarcinomas manifesting as ground-glass nodules. J Thorac Oncol 2014; 9: pp. 74-82.
10. Van Riel S., Sanchez C.L., Bankier A.A., et. al.: Observer variability for classification of pulmonary nodules on low-dose CT images and its effect on nodule management. Radiology 2015; 277: pp. 863-871.
11. Heidinger B.H., Anderson K.R., Nemec U., et. al.: Lung adenocarcinoma manifesting as pure ground-glass nodules: correlating CT size, volume, density, and roundness with histopathologic invasion and size. J Thorac Oncol 2017; 12: pp. 1288-1298.
12. Zhou Q.J., Zheng Z.C., Zhu Y.Q., et. al.: Tumor invasiveness defined by IASLC/ATS/ERS classification of ground-glass nodules can be predicted by quantitative CT parameters. J Thorac Oncol 2017; 9: pp. 1190-1200.
13. Ko J.P., Suh J., Ibidapo O., et. al.: Lung adenocarcinoma: correlation of quantitative CT findings with pathologic findings. Radiology 2016; 280: pp. 931-939.
14. Travis W.D., Brambilla E., Noguchi M., et. al.: International Association for the Study of Lung Cancer/American Thoracic Society/European Respiratory Society International multidisciplinary classification of lung adenocarcinoma. J Thorac Oncol 2011; 6: pp. 244-285.
15. Kadota K., Villena-Vargas J., Yoshizawa A., et. al.: Prognostic significance of adenocarcinoma in situ, minimally invasive adenocarcinoma, and nonmucinous lepidic predominant invasive adenocarcinoma of the lung in patients with stage 1 disease. Am J Surg Pathol 2014; 38: pp. 448-460.
16. Yanagawa N., Shiono S., Abiko M., et. al.: The correlation of the International Association for the Study of Lung Cancer (IASLC)/American Thoracic Society (ATS)/European Respiratory Society (ERS) classification with prognosis and EFGR mutation in lung adenocarcinoma. Ann Thorac Surg 2014; 98: pp. 453-458.
17. Yoshizawa A., Motoi N., Riely G., et. al.: Impact of proposed IASLC/ATS/ERS classification of lung adenocarcinoma: prognostic subgroups and implications for further revision of staging based on analysis of 514 stage 1 cases. Mod Pathol 2011; 24: pp. 653-664.
18. Yoshizawa A., Sumiyoshi S., Sonobe M., et. al.: Validation of the IASLC/ATS/ERS lung adenocarcinoma classification for prognosis and association with EGFR and KRAS mutations. Analysis of 440 Japanese patients. J Thorac Oncol 2013; 8: pp. 52-61.
19. Russell P.A., Wainer Z., Wright G.M., et. al.: Does lung adenocarcinoma subtype predict patient survival?. J Thorac Oncol 2011; 6: pp. 1496-1504.
20. Yanagawa M., Tanaka Y., Leung A.N., et. al.: Prognostic importance of volumetric measurements in stage 1 lung adenocarcinoma. Radiology 2014; 272: pp. 557-567.
21. Yanagawa N., Shiono S., Abiko M., et. al.: New IASLC/ATS/ERS classification and invasive tumor size are predictive of disease recurrence in stage I lung adenocarcinoma. J Thorac Oncol 2013; 8: pp. 612-618.
22. Chae H.-D., Park C.M., Park S.J., et. al.: Computerized texture analysis of persistent part-solid ground-glass nodules: differentiation of preinvasive lesions from invasive pulmonary adenocarcinomas. Radiology 2014; 273: pp. 285-293.
23. Davnall F., Yip C.S.P., Ljungqvist G., et. al.: Assessment of tumor heterogeneity: an emerging imaging tool for clinical practice. Insights Imaging 2012; 3: pp. 573-589.
24. Ikeda K., Awai K., Mori T., et. al.: Differential diagnosis of ground-glass opacity nodules. CT number analysis by three-dimensional computerized quantification. Chest 2007; 132: pp. 984-990.
25. Kamiya A., Murrryama S., Kamiya H., et. al.: Kurtosis and skewness assessments of solid lung nodule density histograms: differentiating malignant from benign nodules. Jpn J Radiol 2014; 32: pp. 14-21.
26. Kawata Y., Niki N., Ohmatsu H., et. al.: Quantitative classification based on CT histogram analysis of non-small cell lung cancer: correlation with histopathological characteristics and recurrence-free survival. Med Phys 2012; 39: pp. 988-1000.
27. Lee S.H., Lee S.M., Goo J.M., et. al.: Usefulness of texture analysis in differentiating transient from persistent part-solid nodules (PSNs): a retrospective study. PLoS ONE 2014; 9: e85167
28. Nomori H., Ohtsuka T., Naruke T., et. al.: Differentiating between atypical adenomatous hyperplasia and bronchoalveolar carcinoma using the computed tomography number histogram. Ann Thorac Surg 2003; 76: pp. 867-871.
29. Son J.Y., Lee H.Y., Kim J., et. al.: Quantitative CT analysis of pulmonary ground-glass opacity nodules for distinguishing invasive adenocarcinoma from non-invasive or minimally invasive adenocarcinoma: the added value of using iodine mapping. Eur Radiol 2016; 26: pp. 43-54.
30. Ko J.P., Berman E.J., Kaur M., et. al.: Pulmonary nodules: growth rate assessment in patients using serial CT and three-dimensional volumetry. Radiology 2013; 262: pp. 662-671.
31. Lestrel P.E.: Biological Shape Analysis.2011.pp. 324.
32. Bursac Z., Gauss C.H., Williams D.K., et. al.: Purposeful selection of variables in logistic regression. Source Code Biol Med 2008; 16: pp. 17.
33. Warth A., Muley T., Meister M., et. al.: The novel histologic International Association for the Study of Lung Cancer/American Thoracic Society/European Respiratory Society classification system of lung adenocarcinoma is a stage-independent predictor of survival. J Clin Oncol 2012; 30: pp. 1438-1446.
34. Hwang I.-P., Park C.M., Park S.J., et. al.: Persistent pure groundglass nodules larger than 5 mm: Differentiation of invasive pulmonary adenocarcinomas from preinvasive lesions or minimally invasive adenocarcinomas using texture analysis. Invest Radiol 2015; 50: pp. 798-804.
35. Son J.Y., Lee H.Y., Kim J.-H., et. al.: Quantitative CT analysis of pulmonary ground-glass opacity nodules for the distinction of invasive adenocarcinoma from pre-invasive or minimally invasive adenocarcinoma. PLoS ONE 2014; 9: e104066
36. de Hoop B., Gietema H., van de Vorst S., et. al.: Pulmonary ground-glass nodules: increase in mass as an early indicator of growth. Radiology 2010; 255: pp. 199-206.
37. Kim H., Park C.M., Woo S., et. al.: Pure and part-solid pulmonary ground-glass nodules: measurement variability of volume and mass in nodules with a solid portion less than or equal to 5 mm. Radiology 2013; 269: pp. 585-593.
38. Oda S., Awai K., Murao K., et. al.: Volume-doubling time of pulmonary nodules with ground glass opacity at multidetector CT: assessment with computer-aided three-dimensional volumetry. Acad Radiol 2011; 18: pp. 63-69.
39. Oda S., Awai K., Murao K., et. al.: Computer-aided volumetry of pulmonary nodules exhibiting ground-glass opacity at MDCT. AJR Am J Roentgenol 2010; 194: pp. 398-406.
40. Park C.M., Goo J.M., Lee H.J., et. al.: Persistent pure ground-glass nodules in the lung: interscan variability of semiautomated volume and attenuation measurements. AJR Am J Roentgenol 2010; 195: pp. 1315.
41. Sumikawa H., Johkoh T., Nagareda T., et. al.: Pulmonary nodules with ground-glass attenuation on thin-section CT: quantification by three-dimensional image analyzing method. Eur J Radiol 2008; 65: pp. 104-111.
42. Van Klaveren R.J., Oudkerk M., Prokop M., et. al.: Management of lung nodules detected by volume CT scanning. N Engl J Med 2009; 361: pp. 2221-2229.
43. Yanagawa M., Kuriyama K., Kunitomi Y., et. al.: One-dimensional quantitative evaluation of peripheral lung adenocarcinoma with or without ground-glass opacity on thin-section CT images using profile curves. Br J Radiol 2009; 82: pp. 532-540.
44. Yanagawa M., Tanaka Y., Kusumoto M., et. al.: Automated assessment of malignant degree of small peripheral adenocarcinomas using volumetric CT data: correlation with pathologic prognostic factors. Lung Cancer 2010; 70: pp. 286-294.
45. Nailon W.H.: Texture analysis methods for medical image characterisation.Mao Y.Biomedical imaging.2010.pp. 75-100.