
Rationale and Objectives
The purpose of this study was to provide normal values of volumetry and linear dimensions of adrenal glands.
Materials and Methods
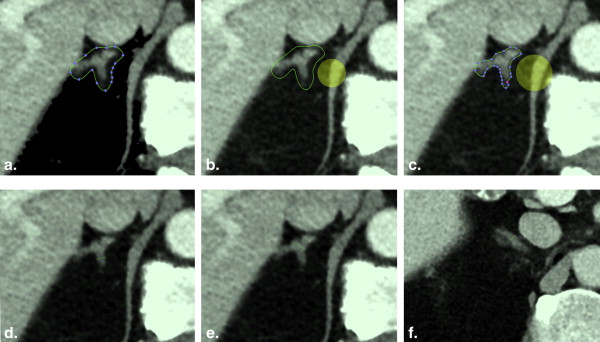
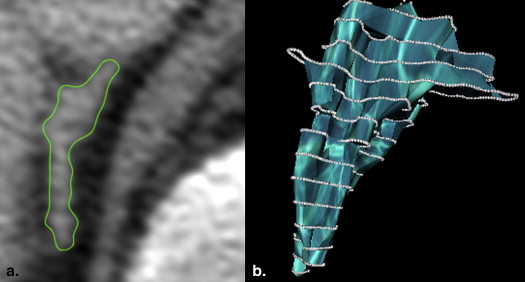
Contrast-enhanced multidetector computed tomography scans of 105 patients were evaluated in this retrospective study. Imaging software was used both to measure the adrenal gland volume and to determine linear dimensions and density. For interobserver reliability, determination was repeated by a second reader in 10 patients selected at random.
Results
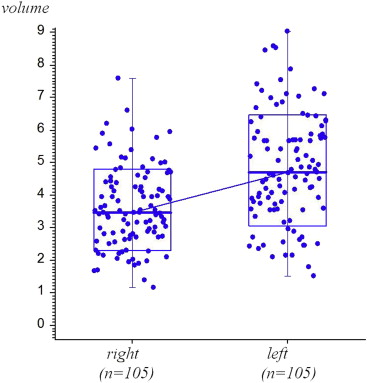
The mean adrenal volume was 4.84 (±1.67) cm³ on the left side and 3.62 (±1.23) cm³ on the right side. The total adrenal volume was mainly influenced by body weight ( P < .001) and gender with women having smaller glands on average. The total width of the adrenal gland was 15.80 (±3.05) mm on the right side and 18.96 (±3.37) mm on the left side. There was a significant correlation between volume and linear measurements ( P < .001). The mean density of both adrenal glands was 32.66 (±19.64) HU. Overall, interobserver reliability was high for volumetry (left adrenal, r = 0.98; right adrenal, r = 0.90) and low for linear dimensions.
Conclusions
Normal data for volumetry and linear dimensions are provided. There is a concordance between volumetric and linear assessment. However, volumetry is more reproducible.
Key points:
Normal data for volumetry and linear dimensions are provided.
Get Radiology Tree app to read full this article<
Get Radiology Tree app to read full this article<
Patients and methods
Patients
Get Radiology Tree app to read full this article<
Get Radiology Tree app to read full this article<
Get Radiology Tree app to read full this article<
Bodysurfacearea(m2)=0.20247×bodyheight(m)0.725×bodyweight(kg)0.425 Body
surface
area
(
m
2
)
=
0
.
20247
×
body
height
(
m
)
0
.
725
×
body
weight
(
kg
)
0
.
425
Get Radiology Tree app to read full this article<
Get Radiology Tree app to read full this article<
CT Examinations
Get Radiology Tree app to read full this article<
Volumetry
Get Radiology Tree app to read full this article<
Get Radiology Tree app to read full this article<
Get Radiology Tree app to read full this article<
Linear Measurement
Get Radiology Tree app to read full this article<
Get Radiology Tree app to read full this article<
Density
Get Radiology Tree app to read full this article<
Get Radiology Tree app to read full this article<
Statistical Analysis
Get Radiology Tree app to read full this article<
Get Radiology Tree app to read full this article<
Results
Volumetry
Get Radiology Tree app to read full this article<
Table 1
Adrenal Gland Volume
Volume_n_ Mean Standard Deviation Median Minimum Maximum Right adrenal gland 105 3.619 1.228 3.470 1.1546 7.5781 Left adrenal gland 105 4.844 1.668 4.708 1.5003 9.0351 Side difference 105 1.225 1.072 1.246 −1.53 4.042 Total volume 105 8.462 2.726 8.212 2.939 16.144
Computed tomographic volumetry of the adrenal gland.
Table 2
Adrenal Gland Volume Separated by Gender
Sex_n_ Mean Standard Deviation_P_ Volume (cm³) Right Male 69 3.969 1.177 <.00005 ∗∗∗ Female 36 2.946 1.040 Left Male 69 5.183 1.574 .0046 ∗∗ Female 36 4.194 1.671 Side difference Male 69 1.213 1.066 .95 Female 36 1.247 1.099 Total Male 69 9.152 2.567 .00038 ∗∗∗ Female 36 7.140 2.557
Sex and adrenal gland volume. P of the Mann–Whitney U test.
Get Radiology Tree app to read full this article<
Get Radiology Tree app to read full this article<
Correlations Between Adrenal Gland Volume and Morphometric Parameters
Get Radiology Tree app to read full this article<
Get Radiology Tree app to read full this article<
Table 3
Correlations with Adrenal Gland Volume
Total ( n = 105) Male ( n = 69) Female ( n = 36)τ__P__τ__P__τ__P Height Right 0.2549 .00012 ∗∗∗ 0.1355 .100 0.0490 .67 Left 0.2312 .00047 ∗∗∗ 0.1433 .082 0.1160 .32 Difference 0.1096 .097 0.1302 .11 0.1454 .21 Total 0.2616 .00008 ∗∗∗ 0.1564 .057 0.1242 .29 Weight Right 0.3797 <.000005 ∗∗∗ 0.3103 .00016 ∗∗∗ 0.3559 .0023 ∗∗ Left 0.3891 <.000005 ∗∗∗ 0.2940 .00035 ∗∗∗ 0.3962 .00067 ∗∗∗ Difference 0.1962 .0030 ∗∗ 0.1218 .14 0.3150 .0069 ∗∗ Total 0.4145 <.000005 ∗∗∗ 0.3241 .00008 ∗∗∗ 0.4046 .00052 ∗∗∗ BMI Right 0.2557 .00011 ∗∗∗ 0.2581 .0017 ∗∗ 0.3917 .00078 ∗∗∗ Left 0.2678 .00005 ∗∗∗ 0.2296 .0053** 0.3930 .00075 ∗∗∗ Difference 0.1382 .037 ∗ 0.0587 .48 0.2582 .027 ∗ Total 0.2791 .00002 ∗∗∗ 0.2642 .0013 ∗∗ 0.4013 .00057 ∗∗∗ Body surface area Right 0.3839 <.000005 ∗∗∗ 0.2963 .00032 ∗∗∗ 0.3394 .0036 ∗∗ Left 0.3834 <.000005 ∗∗∗ 0.2929 .00037 ∗∗∗ 0.3790 .0011 ∗∗ Difference 0.1851 .0051 ∗∗ 0.1343 .10 0.3121 .0074 ∗∗ Total 0.4103 <.000005 ∗∗∗ 0.3185 .00011 ∗∗∗ 0.3968 .00066 ∗∗∗
Kendall’s rank correlation. Correlations between adrenal gland volume and height, weight, BMI, and BSA.
Get Radiology Tree app to read full this article<
Get Radiology Tree app to read full this article<
Correlation Between Volume and Underlying Disease
Get Radiology Tree app to read full this article<
Get Radiology Tree app to read full this article<
Estimation of Normal Adrenal Gland Volume
Get Radiology Tree app to read full this article<
Totalvolume(cm3)=−0.311+0.0916×weight+0.0393×age(−1.409infemalesubjects) Total
volume
(
cm
3
)
=
−
0
.
311
+
0
.
0916
×
weight
+
0
.
0393
×
age
(
−
1
.
409
in
female
subjects
)
For the calculation of adrenal gland volume on the left and right sides, further formulas were computed ( Table 4 ).
Table 4
Equation for Adrenal Volume Based on Linear Regression
Left volume = −0.061 + 0.0355 × weight + 0.0225 × age (−0.7949)
Right volume = −0.25 + 0.0561 × weight + 0.0168 × age (−0.6141)
Total volume = −0.311 + 0.0916 × weight + 0.0393 × age (−1.409)
Predictor B-Weight β-Weight SE (β)P (β) RP-Rest_P_ (RSP) Criteria volume right ( r = 0.63) Weight 0.035 0.4041 0.079 .00000 ∗∗∗ 0.23712 .00000 Sex −0.795 −0.3087 0.079 .00000 ∗∗∗ 0.23726 .00000 Age 0.022 0.2818 0.077 .00000 ∗∗∗ 0.03642 — Criteria volume left ( r = 0.56) Weight 0.056 0.4705 0.085 .00000 ∗∗∗ 0.23712 .00000 Sex −0.614 −0.1755 0.085 .00000 ∗∗∗ 0.23726 .00000 Age 0.017 0.1552 0.082 .00000 ∗∗∗ 0.03642 — Criteria of the total adrenal gland volume ( r = 0.62) Weight 0.092 0.4699 0.080 .00000 ∗∗∗ 0.23712 .00000 Sex −1.409 −0.2465 0.080 .00000 ∗∗∗ 0.23726 .00000 Age 0.039 0.2220 0.078 .00000 ∗∗∗ 0.03642 —
Formulas for calculation of adrenal gland volumes are derived from multiple linear regression analysis (left, right and total volume [volume in milliliters, weight in kilograms, age in years]. Numbers in parentheses have to be subtracted in female subjects). Predictors (weight, sex, and age) are characterized by B-weight, β-weight, SE (β), RP-Rest and P (RSP).
Get Radiology Tree app to read full this article<
Get Radiology Tree app to read full this article<
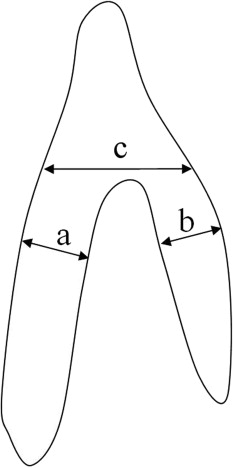
Linear Measurement
Get Radiology Tree app to read full this article<
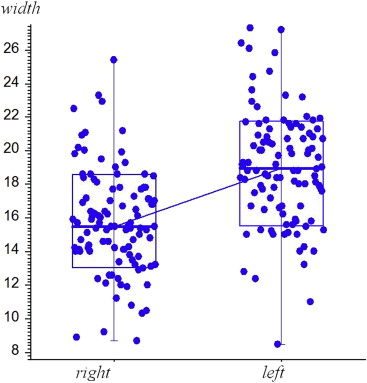
Table 5
Linear Measurement
n Mean Standard Deviation Median Minimum Maximum Lateral limb Right 105 4.036 1.033 4.000 1.9 7.2 Left 105 4.796 1.188 4.600 2.2 8.9 Medial limb Right 105 4.030 1.034 4.000 1.9 6.6 Left 104 4.741 1.048 4.700 2.3 8.2 Corpus Right 105 7.729 1.644 7.600 4.4 11.8 Left 105 9.426 1.928 9.350 4.0 14.6 Total width Right 105 15.795 3.053 15.500 8.7 25.4 Left 104 18.956 3.369 18.950 8.5 27.3
Diameter of the lateral limb, medial limb, corpus, and the total width of each side.
Get Radiology Tree app to read full this article<
Correlations Between Linear Measurement and Weight, Height, BMI, and BSA
Get Radiology Tree app to read full this article<
Correlation Between Linear Measurement and Age
Get Radiology Tree app to read full this article<
Correlation Between Adrenal Gland Volume and Linear Measurement
Get Radiology Tree app to read full this article<
Table 6
Correlation Between Adrenal Gland Volume and Separate Linear Measurements
Right Adrenal Left Adrenal_n__r__P_ r n__r__P r Linear measurements Lateral limb 105 0.3704 .00010 ∗∗∗ 105 0.2294 .019 ∗ Medial limb 105 0.4650 <.000005 ∗∗∗ 104 0.3612 .00017 ∗∗∗ Corpus 105 0.5084 <.000005 ∗∗∗ 104 0.4627 <.000005 ∗∗∗ Total width 105 0.5565 <.000005 ∗∗∗ 104 0.4633 <.000005 ∗∗∗
Correlation between volume and widths. r and P of the Pearson product-moment correlation.
Get Radiology Tree app to read full this article<
Density
Get Radiology Tree app to read full this article<
Get Radiology Tree app to read full this article<
Correlation Between Density and Morphometric Data and Clinical Parameters
Get Radiology Tree app to read full this article<
Get Radiology Tree app to read full this article<
Get Radiology Tree app to read full this article<
Get Radiology Tree app to read full this article<
Interobserver Reliability
Get Radiology Tree app to read full this article<
Table 7
Interobserver Reliability
Right Adrenal Gland Left Adrenal Gland_r__P__r__P_ Volume 0.8948 .00047 ∗∗∗ 0.9775 <.000005 ∗∗∗ Mean attenuation 0.9826 <.000005 ∗∗∗ 0.9809 <.000005 ∗∗∗ Lateral limb (linear) 0.5921 .071 0.1849 .64 Medial limb (linear) 0.7638 .010 ∗ 0.4234 .27 Corpus (linear) 0.7030 .023 ∗ 0.7471 .013 ∗
Correlation between the first and the second measurement in 10 patients.
Get Radiology Tree app to read full this article<
Discussion
Get Radiology Tree app to read full this article<
Volume
Get Radiology Tree app to read full this article<
Table 8
Volumetric Results of Other Studies
Author Year_n_ Mean Age Disease Slice Thickness (mm) Volume Right Volume Left Total Volume Modality Wang et al. 2013 81 47.9 Normal 1.5 4.26 4.23 8.50 CT Nougaret et al. 2010 40, 104 56, 65 Normal, septic shock 3, 3 3.4, — 3.8, — 7.2, 13.3 CT Prionas et al. 2010 7 50.6 Normal 5–10 4.5 5.9 — CT Godoy-Matos et al. 2006 11, 19 49, 42.4 Diabetic, nondiabetic 5, 5 —, — — — 4.29, 2.95 CT Geraghty et al. 2004 149 48.8 Normal 5–10 F: 4.4, M: 5.7 F: 4.9, M: 5.7 —, — CT Rubin et al. 1996 35, 35 41.4, 40.6 Depression, normal 5, 5 —, — —, — 5.1, 3.7 MRT Rubin et al. 1991 10, 10 41, 41 Normal, normal 5, 5 2.45, 2.37 2.81, 2.53 —, — CT, MRT Amsterdam et al. 1986 16, 11 36, 36 Depression, normal 5, 5 —, — —, — 4.5, 3,5 CT
CT, computed tomography; F, female; M, male.
Get Radiology Tree app to read full this article<
Get Radiology Tree app to read full this article<
Get Radiology Tree app to read full this article<
Get Radiology Tree app to read full this article<
Get Radiology Tree app to read full this article<
Get Radiology Tree app to read full this article<
Linear Measurement
Get Radiology Tree app to read full this article<
Get Radiology Tree app to read full this article<
Density
Get Radiology Tree app to read full this article<
Get Radiology Tree app to read full this article<
Get Radiology Tree app to read full this article<
Reproducibility of Adrenal Measurements
Get Radiology Tree app to read full this article<
Limitations
Get Radiology Tree app to read full this article<
Get Radiology Tree app to read full this article<
Get Radiology Tree app to read full this article<
Get Radiology Tree app to read full this article<
Conclusions
Get Radiology Tree app to read full this article<
References
1. Bae K.T., Fuangtharnthip P., Prasad S.R., et. al.: Adrenal masses: CT characterization with histogram analysis method. Radiology 2003; 228: pp. 735-742.
2. Dunnick N.R., Leight G.S., Roubidoux M.A., et. al.: CT in the diagnosis of primary aldosteronism: sensitivity in 29 patients. AJR Am J Roentgenol 1993; 160: pp. 321-324.
3. Godoy-Matos A.F., Vieira A.R., Moreira R.O., et. al.: The potential role of increased adrenal volume in the pathophysiology of obesity-related type 2 diabetes. J Endocrinol Invest 2006; 29: pp. 159-163.
4. Goldman S.M., Gatewood O.M., Walsh P.C., et. al.: CT configuration of the enlarged adrenal gland. J Comput Assist Tomogr 1982; 6: pp. 276-280.
5. Gupta R.T., Ho L.M., Marin D., et. al.: Dual-energy CT for characterization of adrenal nodules: initial experience. AJR Am J Roentgenol 2010; 194: pp. 1479-1483.
6. Korobkin M., White E.A., Kressel H.Y., et. al.: Computed tomography in the diagnosis of adrenal disease. AJR Am J Roentgenol 1979; 132: pp. 231-238.
7. Mulatero P., Bertello C., Rossato D., et. al.: Roles of clinical criteria, computed tomography scan, and adrenal vein sampling in differential diagnosis of primary aldosteronism subtypes. J Clin Endocrinol Metab 2008; 93: pp. 1366-1371.
8. Vincent J.M., Morrison I.D., Armstrong P., et. al.: The size of normal adrenal glands on computed tomography. Clin Radiol 1994; 49: pp. 453-455.
9. Nougaret S., Jung B., Aufort S., et. al.: Adrenal gland volume measurement in septic shock and control patients: a pilot study. Eur Radiol 2010; 20: pp. 2348-2357.
10. Prionas N.D., Gillen M., Boone J.M.: Longitudinal volume analysis from computed tomography: reproducibility using adrenal glands as surrogate tumors. J Med Phys 2010; 35: pp. 174-180.
11. Geraghty E.M., Boone J.M., McGahan J.P., et. al.: Normal organ volume assessment from abdominal CT. Abdom Imaging 2004; 29: pp. 482-490.
12. Rubin R.T., Phillips J.J., McCracken J.T., et. al.: Adrenal gland volume in major depression: relationship to basal and stimulated pituitary-adrenal cortical axis function. Biol Psychiatry 1996; 40: pp. 89-97.
13. Rubin R.T., Phillips J.J.: Adrenal gland volume determination by computed tomography and magnetic resonance imaging in normal subjects. Invest Radiol 1991; 26: pp. 465-469.
14. Wang X., Jin Z.Y., Xue H.D., et. al.: Evaluation of normal adrenal gland volume by 64-slice CT. Chin Med Sci J 2013; 27: pp. 220-224.
15. Amsterdam J.D., Marinelli D.L., Arger P., et. al.: Assessment of adrenal gland volume by computed tomography in depressed patients and healthy volunteers: a pilot study. Psychiatry Res 1987; 21: pp. 189-197.
16. Meier J.M., Alavi A., Iruvuri S., et. al.: Assessment of age-related changes in abdominal organ structure and function with computed tomography and positron emission tomography. Semin Nucl Med 2007; 37: pp. 154-172.
17. Whitley S.A., Moyes V.J., Park K.M., et. al.: The appearance of the adrenal glands on computed tomography in multiple endocrine neoplasia type 1. Eur J Endocrinol 2008; 159: pp. 819-824.
18. Sohaib S.A., Hanson J.A., Newell-Price J.D., et. al.: CT appearance of the adrenal glands in adrenocorticotrophic hormone-dependent Cushing’s syndrome. AJR Am J Roentgenol 1999; 172: pp. 997-1002.
19. Lingam R.K., Sohaib S.A., Vlahos I., et. al.: CT of primary hyperaldosteronism (Conn’s syndrome): the value of measuring the adrenal gland. AJR Am J Roentgenol 2003; 181: pp. 843-849.
20. Vincent J.M., Morrison I.D., Armstrong P., et. al.: Computed tomography of diffuse, non-metastatic enlargement of the adrenal glands in patients with malignant disease. Clin Radiol 1994; 49: pp. 456-460.
21. Montagne J.P., Kressel H.Y., Korobkin M., et. al.: Computed tomography of the normal adrenal glands. AJR Am J Roentgenol 1978; 130: pp. 963-966.
22. Wilms G., Baert A., Marchal G., et. al.: Computed tomography of the normal adrenal glands: correlative study with autopsy specimens. J Comput Assist Tomogr 1979; 3: pp. 467-469.