
Rationale and Objectives
Existing evidence suggests potential contribution of iron in pathogenesis of nonalcoholic fatty liver disease (NAFLD). We aimed to investigate whether hepatic iron content correlates with liver enzyme levels in NAFLD using a noninvasive magnetic resonance imaging (MRI) technique.
Materials and Methods
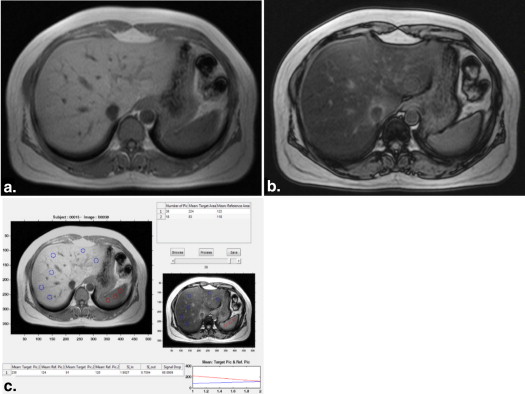
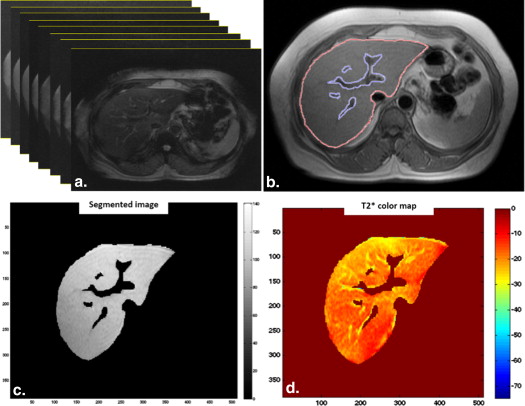
Subjects from Golestan Cohort Study were randomly selected. Diagnosis of NAFLD was made by combination of ultrasound and MRI. Subjects with NAFLD were divided into two groups with high (H-NAFLD) and low (L-NAFLD) enzyme level according to 95th percentile of alanine aminotransferase (ALT) value in normal population. Quantitative T2* maps of entire cross-sectional area of liver were calculated on pixel-by-pixel basis using a semiautomated software.
Results
A total of 207 subjects were enrolled. Mean T2* values were significantly lower in NAFLD group than controls ( P < .001) indicating higher iron content. Male subjects with H-NAFLD had statistically lower T2* values than those with L-NAFLD in multivariate analysis (odds ratio, 0.74; 95% confidence interval [CI], 0.58–0.95), whereas this was not observed in women. Unlike women, there was significant negative correlation between ALT levels and T2* values in men with H-NAFLD ( r = −0.66, P = .01). Every 1-millisecond decrement in T2* value was associated with 6.37 IU/L increase in ALT level (95% CI, 1.8–10.9, P = .01) in men with H-NAFLD.
Conclusions
Higher hepatic iron in men with H-NAFLD, estimated by T2* mapping, may support the role of iron in possible progression of simple steatosis to nonalcoholic steatohepatitis. Lack of such correlation in women could be attributed to relatively lower iron storage or other mechanisms rather than iron.
Nonalcoholic fatty liver disease (NAFLD) is a common cause of chronic liver disease, which is strongly associated with features of metabolic syndrome . Nonalcoholic steatohepatitis (NASH) is the severe form of NAFLD, which has a multifactorial etiologic model. Excess iron deposition has been proposed as one of the potential contributing factors in pathogenesis of NASH, which can complicate simple steatosis via the production of reactive oxygen species (ROS) . Iron may also have a role in mechanisms other than ROS formation including altered insulin signaling and lipid metabolism. Consequently, iron may contribute not only to NASH progression but also to the initial development of steatosis .
A number of studies have investigated the relationship between NAFLD and liver iron by demonstrating the presence of stainable hepatic iron deposit . However the results of these studies, which were obtained from specimens of liver biopsy, are conflicting as some support the association of hepatic iron deposition with more advanced NASH , whereas others do not . Although biopsy is the gold standard for evaluation of liver disease, it is an invasive procedure, which is subject to sampling error or nonhomogeneous distribution of liver injuries . Moreover, it cannot be used in population-based studies for both ethical and practical reasons.
Get Radiology Tree app to read full this article<
Get Radiology Tree app to read full this article<
Materials and methods
Study Design and Subjects
Get Radiology Tree app to read full this article<
Get Radiology Tree app to read full this article<
Ultrasound
Get Radiology Tree app to read full this article<
Magnetic Resonance Imaging
Get Radiology Tree app to read full this article<
Get Radiology Tree app to read full this article<
Image Analysis
Get Radiology Tree app to read full this article<
Get Radiology Tree app to read full this article<
Get Radiology Tree app to read full this article<
Get Radiology Tree app to read full this article<
Definitions
Get Radiology Tree app to read full this article<
Statistical Analysis
Get Radiology Tree app to read full this article<
Results
Get Radiology Tree app to read full this article<
Table 1
Demographic Characteristics and Laboratory Findings of Participants in Three Studied Groups
Characteristic Control L-NAFLD H-NAFLD_N_ 97 85 25 F/M 51/46 47/38 11/14 Age range (years) 50–77 50–72 50–70 Age (years; mean ± SD) 57.87 ± 6.52 56.75 ± 5.61 54.84 ± 4.48 BMI range 19.03–39.94 21.55–37.39 25.68–35.83 BMI (mean ± SD) 27.64 ± 4.12 29.78 ± 3.44 30.01 ± 2.73 ALT (IU/mL; mean ± SD) 20.79 ± 5.12 24.76 ± 7.33 65.64 ± 22.57 AST (IU/mL; mean ± SD) 20.20 ± 6.66 20.75 ± 7.26 38.79 ± 20.05 T2* (ms; mean ± SD) 23.00 ± 3.50 20.50 ± 4.31 18.78 ± 3.66 Ferritin (ng/mL; mean ± SD) 81.76 ± 62.58 108.05 ± 52.95 128.92 ± 64.42 Hemoglobin (mg/dL; mean ± SD) 12.96 ± 1.43 13.41 ± 1.69 13.83 ± 1.50
ALT, alanine aminotransferase; AST, aspartate aminotransferase; BMI, body mass index; H-NAFLD, high enzyme level NAFLD; L-NAFLD, low enzyme level NAFLD; NAFLD, nonalcoholic fatty liver disease; SD, standard deviation.
Get Radiology Tree app to read full this article<
Get Radiology Tree app to read full this article<
Univariate Analysis
Get Radiology Tree app to read full this article<
Table 2
Univariate Analysis for Association of Demographics, T2* Value, and Risk Factors of Metabolic Syndrome with Low and High Enzyme Level NAFLD in Men and Women
Variable Control L-NAFLD H-NAFLD_P_ Value L-NAFLD Versus Control H-NAFLD Versus Control H-NAFLD Versus L-NAFLD Women ( n = 109)N 51 47 11 Age (years; mean ± SD) 57.4 ± 6.1 55.4 ± 5.0 55.5 ± 5.5 .1 .36 .97 BMI (kg/m 2 ; mean ± SD) 29.0 ± 4.5 30.3 ± 3.6 30.1 ± 2.1 .13 .45 .86 T2* (ms; mean ± SD) 23.6 ± 3.2 20.6 ± 4.2 20.1 ± 3.8 <.001 ∗ .003 ∗ .72 FBS (mg/dL; mean ± SD) 99.9 ± 35.7 111.7 ± 36.3 127.8 ± 40.6 .12 .04 ∗ .24 HbA1c (%; mean ± SD) 0.7 ± 0.3 2.6 ± 0.5 2.7 ± 0.9 .004 ∗ .01 ∗ .90 LDL (mg/dL; mean ± SD) 122.0 ± 35.1 123.2 ± 44.4 108.8 ± 52.8 .88 .35 .39 HDL (mg/dL; mean ± SD) 67.8 ± 18.3 59.1 ± 14.5 60.2 ± 14.2 .01 ∗ .24 .83 TG (mg/dL; mean ± SD) 128.4 ± 70.1 174.8 ± 96.7 217.3 ± 84.5 .01 ∗ .01 ∗ .31 Hypertension (Y/N) 12/39 17/30 4/7 .17 .45 .99 Men ( n = 98)N 46 38 14 Age (years; mean ± SD) 58.3 ± 6.8 58.3 ± 5.8 54.2 ± 3.5 .97 .03 ∗ .02 ∗ BMI (kg/m 2 ; mean ± SD) 26.0 ± 2.8 29.0 ± 3.0 29.8 ± 3.2 <.001 ∗ <.001 ∗ .41 T2* (ms; mean ± SD) 22.2 ± 3.6 20.3 ± 4.4 17.7 ± 3.2 .03 ∗ <.001 ∗ .04 ∗ FBS (mg/dL; mean ± SD) 105.8 ± 39.7 118.7 ± 39.3 106.3 ± 21.0 .15 .97 .28 HbA1c (%; mean ± SD) 0.8 ± 0.3 1.7 ± 0.5 1.9 ± 0.8 .12 .15 .85 LDL (mg/dL; mean ± SD) 129.3 ± 34.0 114.9 ± 38.3 128.0 ± 48.8 .08 .91 .32 HDL (mg/dL; mean ± SD) 54.1 ± 11.8 50.2 ± 11.9 49.1 ± 10.9 .14 .18 .77 TG (mg/dL; mean ± SD) 133.1 ± 52.3 201.2 ± 127.4 152.3 ± 48.6 .002 ∗ .24 .18 Hypertension (Y/N) 10/36 11/27 4/10 .41 .45 .58
BMI, body mass index; FBS, fasting blood sugar; HbA1c, glycosylated hemoglobin; HDL, high-density lipoprotein; H-NAFLD, high enzyme level NAFLD; LDL, low-density lipoprotein; L-NAFLD, low enzyme level NAFLD; NAFLD, nonalcoholic fatty liver disease; SD, standard deviation; TG, triglyceride.
Get Radiology Tree app to read full this article<
Get Radiology Tree app to read full this article<
Multivariate Analysis
Get Radiology Tree app to read full this article<
Table 3
Multivariate Logistic Regression Analysis for Association of T2* Value and Other Risk Factors With Low and High Enzyme Level NAFLD in Men and Women
Variable OR for L-NAFLD (Control as Reference) OR for H-NAFLD (Control as Reference) OR for H-NAFLD (L-NAFLD as Reference) OR (95% CI)P Value OR (95% CI)P Value OR (95% CI)P Value Women T2* 0.79 (0.69–0.91) .001 ∗ 0.67 (0.51–0.87) .004 ∗ NA FBS NA 1.01 (0.99–1.02) .21 NA HbA1c 1.09 (0.91–1.37) .19 0.98 (0.56–1.74) .96 NA HDL 0.97 (0.93–0.99) .059 NA NA TG 1.003 (0.99–1.01) .49 1.001 (0.99–1.01) .81 NA Men T2* 0.91 (0.8–1.03) .16 0.73 (0.58–0.91) .006 ∗ 0.74 (0.58–0.95) .01 ∗ Age NA 0.86 (0.7–1.04) .13 0.78 (0.64–0.96) .01 ∗ BMI 1.51 (1.2–1.9) <.001 ∗ 1.54 (1.13–2.09) .005 ∗ NA LDL 0.98 (0.96–1.00) .06 NA NA TG 1.006 (0.99–1.01) .17 NA NA
BMI, body mass index; CI, confidence interval; FBS, fasting blood sugar; HbA1c, glycosylated hemoglobin; HDL, high-density lipoprotein; H-NAFLD, high enzyme level NAFLD; LDL, low-density lipoprotein; L-NAFLD, low enzyme level NAFLD; NA, not applicable (variables with P ≥ .1 in univariate analysis); NAFLD, nonalcoholic fatty liver disease; OR, odds ratio; SD, standard deviation; TG, triglyceride.
Get Radiology Tree app to read full this article<
Get Radiology Tree app to read full this article<
Get Radiology Tree app to read full this article<
Discussion
Get Radiology Tree app to read full this article<
Get Radiology Tree app to read full this article<
Get Radiology Tree app to read full this article<
Get Radiology Tree app to read full this article<
Get Radiology Tree app to read full this article<
Get Radiology Tree app to read full this article<
Get Radiology Tree app to read full this article<
Get Radiology Tree app to read full this article<
Get Radiology Tree app to read full this article<
Get Radiology Tree app to read full this article<
Get Radiology Tree app to read full this article<
References
1. Vernon G., Baranova A., Younossi Z.M.: Systematic review: the epidemiology and natural history of non-alcoholic fatty liver disease and non-alcoholic steatohepatitis in adults. Aliment Pharmacol Ther 2011; 34: pp. 274-285.
2. Corradini E., Pietrangelo A.: Iron and steatohepatitis. J Gastroenterol Hepatol 2012; 2: pp. 42-46.
3. Nelson J.E., Klintworth H., Kowdley K.V.: Iron metabolism in nonalcoholic fatty liver disease. Curr Gastroenterol Rep 2012; 14: pp. 8-16.
4. George D.K., Goldwurm S., MacDonald G.A., et. al.: Increased hepatic iron concentration in nonalcoholic steatohepatitis is associated with increased fibrosis. Gastroenterology 1998; 114: pp. 311-318.
5. Sumida Y., Nakashima T., Yoh T., et. al.: Serum thioredoxin levels as a predictor of steatohepatitis in patients with nonalcoholic fatty liver disease. J Hepatol 2003; 38: pp. 32-38.
6. Bugianesi E., Manzini P., D’Antico S., et. al.: Relative contribution of iron burden, HFE mutations, and insulin resistance to fibrosis in nonalcoholic fatty liver. Hepatology 2004; 39: pp. 179-187.
7. Grandison G.A., Angulo P.: Can NASH be diagnosed, graded, and staged noninvasively?. Clin Liver Dis 2012; 16: pp. 567-585.
8. Merat S., Sotoudehmanesh R., Nouraie M., et. al.: Sampling error in histopathology findings of nonalcoholic fatty liver disease: a post mortem liver histology study. Arch Iran Med 2012; 15: pp. 418-421.
9. Raptis D.A., Fischer M.A., Graf R., et. al.: MRI: the new reference standard in quantifying hepatic steatosis?. Gut 2012; 61: pp. 117-127.
10. Sirlin C.B., Reeder S.B.: Magnetic resonance imaging quantification of liver iron. Magn Reson Imaging Clin N Am 2010; 18: pp. 359-381.
11. Reeder S.B., Sirlin C.B.: Quantification of liver fat with magnetic resonance imaging. Magn Reson Imaging Clin N Am 2010; 18: pp. 337-357.
12. Gandon Y., Olivié D., Guyader D., et. al.: Non-invasive assessment of hepatic iron stores by MRI. Lancet 2004; 363: pp. 357-362.
13. Virtanen J.M., Komu M.E., Parkkola R.K.: Quantitative liver iron measurement by magnetic resonance imaging: in vitro and in vivo assessment of the liver to muscle signal intensity and the R2* methods. Magn Reson Imaging 2008; 26: pp. 1175-1182.
14. The effect of Polypill on patients with presumed NASH (PolyIran-L). Available at: http://clinicaltrials.gov/show/NCT01245608 . Accessed August 15, 2014.
15. Hamaguchi M., Kojima T., Itoh Y., et. al.: The severity of ultrasonographic findings in nonalcoholic fatty liver disease reflects the metabolic syndrome and visceral fat accumulation. Am J Gastroenterol 2007; 102: pp. 2708-2715.
16. Qayyum A., Nystrom M., Noworolski S.M., et. al.: MRI steatosis grading: development and initial validation of a color mapping system. AJR Am J Roentgenol 2012; 198: pp. 582-588.
17. Qayyum A., Goh J.S., Kakar S., et. al.: Accuracy of liver fat quantification at MR imaging: comparison of out-of-phase gradient-echo and fat-saturated fast spin-echo techniques—initial experience. Radiology 2005; 237: pp. 507-511.
18. Borra R.J., Salo S., Dean K., et. al.: Nonalcoholic fatty liver disease: rapid evaluation of liver fat content with in-phase and out-of-phase MR imaging. Radiology 2009; 250: pp. 130-136.
19. House M.J., Gan E.K., Adams L.A., et. al.: Diagnostic performance of a rapid magnetic resonance imaging method of measuring hepatic steatosis. PLoS One 2013; 8: pp. e59287.
20. Dongiovanni P., Fracanzani A.L., Fargion S., et. al.: Iron in fatty liver and in the metabolic syndrome: a promising therapeutic target. J Hepatol 2011; 55: pp. 920-932.
21. Nelson J.E., Wilson L., Brunt E.M., et. al.: Relationship between the pattern of hepatic iron deposition and histological severity in nonalcoholic fatty liver disease. Hepatology 2011; 53: pp. 448-457.
22. Verma S., Jensen D., Hart J., et. al.: Predictive value of ALT levels for non-alcoholic steatohepatitis (NASH) and advanced fibrosis in non-alcoholic fatty liver disease (NAFLD). Liver Int 2013; 33: pp. 1398-1405.
23. Lee T.H., Kim W.R., Benson J.T., et. al.: Serum aminotransferase activity and mortality risk in a United States community. Hepatology 2008; 47: pp. 880-887.
24. Day C.P., James O.F.: Steatohepatitis: a tale of two “hits”?. Gastroenterology 1998; 114: pp. 842-845.
25. Fernandez-Real J.M., Lopez-Bermejo A., Ricart W.: Cross-talk between iron metabolism and diabetes. Diabetes 2002; 51: pp. 2348-2354.
26. Graham R.M., Chua A.C., Carter K.W., et. al.: Hepatic iron loading in mice increases cholesterol biosynthesis. Hepatology 2010; 52: pp. 462-471.
27. Musso G., Gambino R., Cassader M., et. al.: Meta-analysis: natural history of non-alcoholic fatty liver disease (NAFLD) and diagnostic accuracy of non-invasive tests for liver disease severity. Ann Med 2011; 43: pp. 617-649.
28. Piccinino F., Sagnelli E., Pasquale G., et. al.: Complications following percutaneous liver biopsy. A multicentre retrospective study on 68,276 biopsies. J Hepatol 1986; 2: pp. 165-173.
29. Bravo A.A., Sheth S.G., Chopra S.: Liver biopsy. N Engl J Med 2001; 344: pp. 495-500.
30. Villeneuve J.P., Bilodeau M., Lepage R., et. al.: Variability in hepatic iron concentration measurement from needle-biopsy specimens. J Hepatol 1996; 25: pp. 172-177.
31. El-Badry A.M., Breitenstein S., Jochum W., et. al.: Assessment of hepatic steatosis by expert pathologists: the end of a gold standard. Ann Surg 2009; 250: pp. 691-697.
32. Merat S., Khadem-Sameni F., Nouraie M., et. al.: A modification of the Brunt system for scoring liver histology of patients with non-alcoholic fatty liver disease. Arch Iran Med 2010; 13: pp. 38-44.
33. St Pierre T.G., Clark P.R., Chua-Anusorn W.: Measurement and mapping of liver iron concentrations using magnetic resonance imaging. Ann N Y Acad Sci 2005; 1054: pp. 379-385.
34. McCarville M.B., Hillenbrand C.M., Loeffler R.B., et. al.: Comparison of whole liver and small region-of-interest measurements of MRI liver R2* in children with iron overload. Pediatr Radiol 2010; 40: pp. 1360-1367.
35. Hernando D., Kühn J.P., Mensel B., et. al.: R2* estimation using “in-phase” echoes in the presence of fat: the effects of complex spectrum of fat. J Magn Reson Imaging 2013; 37: pp. 717-726.
36. Ruhl C.E., Everhart J.E.: Upper limits of normal for alanine aminotransferase activity in the United States population. Hepatology 2012; 55: pp. 447-454.