
Rationale and Objectives
The Liver Imaging Reporting and Data System (LI-RADS) is a newly developed nomogram for standardizing the performance and interpretation of liver imaging. However, it is unclear which imaging technique is optimal to exactly define LI-RADS scale. This study aims to determine the concordance of computed tomography (CT) and magnetic resonance imaging (MRI) for the classification of hepatic nodules (HNs) using a LI-RADS scoring system.
Materials and Methods
Major imaging features (arterial hyper-enhancement, washout, pseudo-capsule, diameter, and tumor embolus) on CT versus MRI for 118 HNs in 84 patients with diffuse liver disease were rated independently using LI-RADS by two groups of readers. Inter-reader agreement (IRA) and intraclass agreement was determined by Fleiss and Cohen’s kappa (κ). Logistic regression for correlated data was used to compare diagnostic ability.
Results
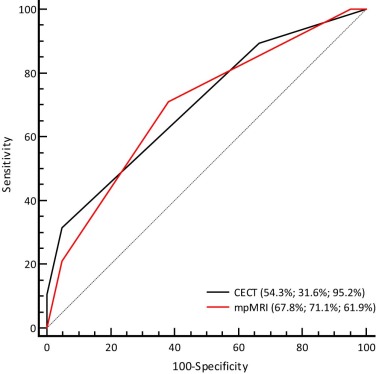
IRA was perfect for determination of nodule size and tumor embolus (κ = 0.94–0.98). IRA was moderate to substantial for determination of arterial hyper-enhancement, washout, and pseudo-capsule (κ = 0.54–0.72). Intraclass agreement between CT and MRI was substantial for determination of washout (0.632 [95% CI: 0.494, 0.771]) and pseudo-capsule (0.670 [95% CI: 0.494, 0.847]), and fair for arterial hyper-enhancement (0.203 [95% CI: 0.051, 0.354]). CT against MR produced false-negative findings of arterial hyper-enhancement by 57.1%, washout by 21.2%, and pseudo-capsule by 42.9%; and underestimated LI-RADS score by 16.9% for LR 3, 37.3% for LR 4, and 8.5% for LR 5. CT produced significantly lower accuracy (54.3% vs 67.8%, P < 0.001) and sensitivity (31.6% vs 71.1%, P < 0.001) than MRI in the prediction of malignancy.
Conclusions
There are substantial discordance between CT and MR for stratification of HNs using LI-RADS. MRI could be better than CT in optimizing the performance of LI-RADS.
Introduction
Hepatocellular carcinoma (HCC) is the most predominant primary malignant hepatic tumor and the third leading cause of cancer death worldwide . The developed imaging techniques, including computed tomography (CT) and magnetic resonance imaging (MRI), have improved the ability of these imaging modalities for lesion detection and malignancy discrimination . Several organizations, including the American Association for the Study of Liver Diseases, the European Association for the Study of the Liver, the Organ Procurement and Transplantation Network, the Asian Pacific Association for the Study of the Liver, and the National Comprehensive Cancer Network, have proposed the guidelines for appropriate utilization of imaging for HCC diagnosis and management . Although specific imaging features such as “arterial phase (AP) hyper-enhancement,” “washout,” and “capsule” proposed by these guidelines are widely recognized as important, there is no established consensus yet regarding their exact definitions, and there is no established criteria yet for the standardization of the performance and interpretation of these imaging features.
The Liver Imaging Reporting and Data System (LI-RADS) is a newly developed nomogram to standardize the terminology for reporting, assessing, and recommending action in liver imaging . According to integrative evaluation of classic imaging features of hepatic lesion, for example, enhancement pattern in arterial and/or portal phase, tumor capsule, intravenous tumor embolus, and tumor growth rate, LI-RADS allows radiologists to standardize individual observations by assigning the imaging findings to one of five categories (LR 1–5). As reported currently, LI-RADS exhibited competitive individual features against conventional algorithms, for example, the Organ Procurement and Transplantation Network and the American Association for the Study of Liver Diseases , for screening and surveillance of HCC. The five-point LI-RADS scale, including its fixed criteria, is determined by integrative evaluation of classic imaging features of the observations in cirrhotic liver . However, the definition of these major imaging features and the scoring results of LI-RADS could be technology associated ; for example, arterial hyper-enhancement, one of the important features for the imaging diagnosis of HCC, could be interpreted with great difference between CT and MRI because of the limited tissue contrast for CT imaging. To date, it is yet unclear whether and how the technological difference between CT and MRI will take effect on the imaging observation and the final scoring results of LI-RADS.
Get Radiology Tree app to read full this article<
Materials and Methods
Patient Selection, Reference Standard, and CT/MR Technique
Get Radiology Tree app to read full this article<
CT and MR Protocols
Get Radiology Tree app to read full this article<
Get Radiology Tree app to read full this article<
Image Interpretation
Get Radiology Tree app to read full this article<
Statistical Analysis
Get Radiology Tree app to read full this article<
Results
Pathological Findings
Get Radiology Tree app to read full this article<
IRA for Major Diagnostic Features of HCC
Get Radiology Tree app to read full this article<
Table 1
Inter-reader Agreement for Major Diagnostic Features of HCC
Variable κ Coefficients CT MR Tumor size \* 0.95 (0.94, 0.96) 0.98 (0.97, 0.99) Arterial hyper-enhancement 0.54 (0.44, 0.64) 0.63 (0.54, 0.72) Washout appearance 0.61 (0.46, 0.76) 0.72 (0.64, 0.80) Pseudo-capsule 0.56 (0.52, 0.60) 0.65 (0.60, 0.70) Tumor embolus 0.94 (0.91, 0.97) 0.97 (0.95, 0.99)
CT, computed tomography; HCC, hepatocellular carcinoma; MR, magnetic resonance.
Note: Data are mean κ coefficients across all possible combinations of the four readers, and numbers in parentheses are 95% confidence intervals.
Get Radiology Tree app to read full this article<
Get Radiology Tree app to read full this article<
ICA of LR Scores Between CT and MRI
Get Radiology Tree app to read full this article<
Table 2
The Intraclass Agreement of Major Imaging Features for HCC Determined by Using CT or MRI
Variable CT MRI Kappa (κ) \* Lesion size (cm) † 1.77 ± 1.82 1.86 ± 1.73 0.995 (0.993, 0.996) Arterial hyper-enhancement 35.6% (42/118) 83.1% (98/118) 0.203 (0.051, 0.354) Washout appearance 44.1% (52/118) 55.9% (66/118) 0.632 (0.494, 0.771) Pseudo-capsule 13.6% (16/118) 23.7% (28/118) 0.670 (0.494, 0.847) Tumor embolus 5.9% (7/118) 5.9% (7/118) 1.000 (1.000, 1.000)
CT, computed tomography; HCC, hepatocellular carcinoma; MRI, magnetic resonance imaging.
Note: Unless otherwise specified, data are percentages, with number of lesions in parentheses.
Get Radiology Tree app to read full this article<
Get Radiology Tree app to read full this article<
Get Radiology Tree app to read full this article<
Get Radiology Tree app to read full this article<
Table 3
Comparison of the LI-RADS Scoring Results for 118 Hepatic Lesions by CT and MRI
Open full size image
CT, computed tomography; LI-RADS, Liver Imaging Reporting and Data System; MRI, magnetic resonance imaging.
Note: Unless otherwise specified, data are number of lesions with the percentages in parentheses.
The blue cell in the table represents overestimate of MRI-based LR score by CT, and green cells represent the underestimate of MRI-based LR scores by CT. (Color version of table is available online.)
Get Radiology Tree app to read full this article<
Comparison of Diagnostic Performance by CT and MRI
Get Radiology Tree app to read full this article<
Table 4
ROC Analysis for Malignancy Detection at LR Score Thresholds Between CT and MRI
LR Criterion Sensitivity Specificity CT ≥2 100.0 (95.2–100.0) 0.0 (0.0–8.5) >2 89.5 (80.3–95.3) 33.3 (19.6–49.5) >3 \* 31.6 (21.4–43.3) 95.2 (83.8–99.3) >4 10.5 (4.7–19.7) 100.0 (91.5–100.0) >5 0 (0.0–4.8) 100.0 (91.5–100.0) MRI ≥2 100.0 (95.2–100.0) 0.0 (0.0–8.5) >2 100.0 (95.2–100.0) 4.8 (0.7–16.2) >3 \* 71.1 (59.5–80.9) 61.9 (45.6–76.4) >4 21.1 (12.5–31.9) 95.2 (83.8–99.2) >5 0.0 (0.0–4.8) 100.0 (91.5–100.0)
CT, computed tomography; MRI, magnetic resonance imaging; ROC, receiver operating characteristic.
Note: Unless otherwise specified, data are percentages and with ranges in parentheses.
Get Radiology Tree app to read full this article<
Get Radiology Tree app to read full this article<
Get Radiology Tree app to read full this article<
Table 5
Performance for Determination of HCCs Assessed by CT and MRI at the Optical Scales
Criterion CT MRI_P_ Optical scale >LR 3 >LR 3 – Accuracy 54.3 (64/118) 67.8 (80/118) <0.001 Sensitivity 31.6 (24/76) 71.1 (54/76) <0.001 Specificity 95.2 (40/42) 61.9 (26/42) <0.001 Az 0.701 0.695 0.905
Az, area under the receiver operating characteristic curve; CT, computed tomography; HCC, hepatocellular carcinoma; MRI, magnetic resonance imaging.
Note: Data for accuracy, sensitivity, and specificity are percentages and with raw data in parentheses.
Get Radiology Tree app to read full this article<
Discussion
Get Radiology Tree app to read full this article<
Get Radiology Tree app to read full this article<
Get Radiology Tree app to read full this article<
Get Radiology Tree app to read full this article<
Conclusions
Get Radiology Tree app to read full this article<
Acknowledgment
Get Radiology Tree app to read full this article<
Appendix
Supplementary material
Get Radiology Tree app to read full this article<
Table S1
Get Radiology Tree app to read full this article<
Get Radiology Tree app to read full this article<
References
1. Parkin D.M., Bray F., Ferlay J., et. al.: Estimating the world cancer burden: Globocan 2000. Int J Cancer 2001; 94: pp. 153-156.
2. Watson R.W.: The rising incidence of hepatocellular carcinoma. N Engl J Med 1999; 341: pp. 451-452.
3. El-Serag H.B.: Hepatocellular carcinoma. N Engl J Med 2011; 365: pp. 1118-1127.
4. Liu D., Fong D.Y., Chan A.C., et. al.: Hepatocellular carcinoma: surveillance CT schedule after hepatectomy based on risk stratification. Radiology 2014; 132343:
5. Choi J.Y., Lee J.M., Sirlin C.B.: CT and MR imaging diagnosis and staging of hepatocellular carcinoma: part I. Development, growth, and spread: key pathologic and imaging aspects. Radiology 2014; 272: pp. 635-654.
6. Choi J.Y., Lee J.M., Sirlin C.B.: CT and MR imaging diagnosis and staging of hepatocellular carcinoma: part II. Extracellular agents, hepatobiliary agents, and ancillary imaging features. Radiology 2014; 273: pp. 30-50.
7. Serste T., Barrau V., Ozenne V., et. al.: Accuracy and disagreement of computed tomography and magnetic resonance imaging for the diagnosis of small hepatocellular carcinoma and dysplastic nodules: role of biopsy. Hepatology 2012; 55: pp. 800-806.
8. Forner A., Vilana R., Ayuso C., et. al.: Diagnosis of hepatic nodules 20 mm or smaller in cirrhosis: prospective validation of the noninvasive diagnostic criteria for hepatocellular carcinoma. Hepatology 2008; 47: pp. 97-104.
9. Kim T.K., Lee K.H., Jang H.J., et. al.: Analysis of gadobenate dimeglumine-enhanced MR findings for characterizing small (1–2-cm) hepatic nodules in patients at high risk for hepatocellular carcinoma. Radiology 2011; 259: pp. 730-738.
10. Leoni S., Piscaglia F., Golfieri R., et. al.: The impact of vascular and nonvascular findings on the noninvasive diagnosis of small hepatocellular carcinoma based on the EASL and AASLD criteria. Am J Gastroenterol 2010; 105: pp. 599-609.
11. European Association for the Study of the Liver , Asociacion Latinoamericana para el Estudio del Higado : EASL-ALEH Clinical Practice Guidelines: non-invasive tests for evaluation of liver disease severity and prognosis. J Hepatol 2015; 63: pp. 237-264.
12. Purysko A.S., Remer E.M., Coppa C.P., et. al.: LI-RADS: a case-based review of the new categorization of liver findings in patients with end-stage liver disease. Radiographics 2012; 32: pp. 1977-1995.
13. Mitchell D.G., Bruix J., Sherman M., et. al.: LI-RADS (Liver Imaging Reporting and Data System): summary, discussion, and consensus of the LI-RADS Management Working Group and future directions. Hepatology 2015; 61: pp. 1056-1065.
14. Health Resources and Services Administration (HRSA) , Department of Health and Human Services (HHS) : Organ procurement and transplantation network. Final rule. Fed Regist 2013; 78: pp. 40033-40042.
15. Vilstrup H., Amodio P., Bajaj J., et. al.: Hepatic encephalopathy in chronic liver disease: 2014 Practice Guideline by the American Association for the Study of Liver Diseases and the European Association for the Study of the Liver. Hepatology 2014; 60: pp. 715-735.
16. Darnell A., Forner A., Rimola J., et. al.: Liver imaging reporting and data system with MR imaging: evaluation in nodules 20 mm or smaller detected in cirrhosis at screening US. Radiology 2015; 141132:
17. Davenport M.S., Khalatbari S., Liu P.S., et. al.: Repeatability of diagnostic features and scoring systems for hepatocellular carcinoma by using MR imaging. Radiology 2014; 272: pp. 132-142.
18. Bashir M.R., Huang R., Mayes N., et. al.: Concordance of hypervascular liver nodule characterization between the organ procurement and transplant network and liver imaging reporting and data system classifications. J Magnetic Reson Imaging 2015; 42: pp. 305-314.
19. Bottcher J., Hansch A., Pfeil A., et. al.: Detection and classification of different liver lesions: comparison of Gd-EOB-DTPA-enhanced MRI versus multiphasic spiral CT in a clinical single centre investigation. Eur J Radiol 2013; 82: pp. 1860-1869.
20. Zhang Y.D., Zhu F.P., Xu X., et. al.: Classifying CT/MR findings in patients with suspicion of hepatocellular carcinoma: Comparison of liver imaging reporting and data system and criteria-free Likert scale reporting models. J Magn Resonan Imaging 2015;
21. Santillan C.S., Tang A., Cruite I., et. al.: Understanding LI-RADS: a primer for practical use. Magn Reson Imaging Clin N Am 2014; 22: pp. 337-352.
22. Mitchell D.G., Bruix J., Sherman M., et. al.: LI-RADS (Liver Imaging Reporting and Data System): summary, discussion, and consensus of the LI-RADS Management Working Group and future directions. Hepatology 2015; 61: pp. 1056-1065.