
Rationale and Objectives
Chronic hemodialysis requires a vascular access that provides high blood-flow rates for the extracorporeal recirculation of blood. Synthetic arteriovenous (AV) grafts often fail because of clotting caused by underlying hyperplasia formation. The authors report the use of magnetic resonance (MR) imaging (MRI) without contrast agent to monitor tissue hyperplasia formation as well as luminal area in a porcine model of AV graft stenosis.
Materials and Methods
Expanded reinforced polytetrafluoroethylene grafts were surgically placed between the common carotid artery and the external jugular vein, bilaterally, in pigs. Animals underwent MRI in a 3-T scanner at 3, 4, or 6 weeks after graft placement, followed by euthanasia and the collection of grafts and adjacent tissues for histologic analysis. Two animals underwent sequential scanning at 1, 2, 3, 5, and 7 weeks after graft placement, followed by histologic analysis.
Results
Measurements of hyperplasia obtained from the MR images were compared with, and correlated well with, measurements obtained from the histologic cross-sections ( r = 0.932, P = .02). The MR images provided a more complete view of the venous hyperplasia throughout the graft compared with histology. The MR images could be examined from multiple angles and were unaffected by histologic preparation artifacts.
Conclusion
Unlike histology, MRI provided longitudinal 3-dimensional views of hyperplasia within the AV grafts. This ability of MRI to more completely identify the geometry of hyperplasia and to quantify the tissue volume in vivo could provide benefits over histologic analysis in assessing the pathology of AV graft failure and the efficacy of antihyperplasia interventions.
Chronic hemodialysis requires a vascular access that provides high flow rates for the extracorporeal recirculation of blood. Although the arteriovenous (AV) fistulas created by the anastomosis of native arteries to native veins are the preferred access, synthetic polytetrafluoroethylene (PTFE) AV grafts are also widely used in the United States. Both access types succumb to premature failure because of clotting caused by underlying neointimal hyperplasia formation, although synthetic grafts have a higher rate of failure. The construction and revision of vascular accesses are among the most commonly performed vascular surgery procedures in the United States ( ). Access failure results in significant morbidity in the hemodialysis population, and currently, there is no effective therapy to prevent access failure ( ). Synthetic AV grafts could be the preferred access for hemodialysis if the high occurrence of hyperplasia could be prevented, because they generally have larger luminal diameters and shorter waiting times before use than native fistulas. Thus, research is ongoing to develop strategies to inhibit hyperplasia and prevent graft failure.
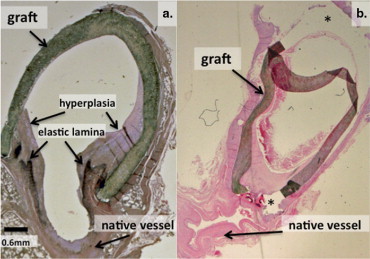
Porcine models of AV grafts have been developed for the study of the pathogenesis of hyperplasia and treatment modalities. These models recapitulate the pattern of hyperplasia development observed in clinically failed AV grafts, with hyperplasia developing in an accelerated manner ( ). Thus, these models are very useful for studying strategies to prevent AV graft hyperplasia. The analysis of hyperplasia development in the pig model typically involves survival of the animals for 4 to 8 weeks after graft placement, followed by euthanasia and histologic analysis of the graft-vessel anastomoses. Hyperplasia occurs most often at the juncture of the graft and vessel, but it is also observed within native vessels, upstream and downstream of the anastomosis ( ). Histologic analysis provides two-dimensional (2D) information regarding the size and cellular nature of the hyperplastic lesion. Histologic results from our group and others have shown that lesions consist primarily of cells with smooth muscle cell–like properties and numerous macrophages and macrophage-derived foreign body cells. Lesions are also the site of conspicuous angiogenesis and deposition of the extracellular matrix ( ). Unfortunately, histologic analysis has a number of shortcomings ( ). Because of its labor-intensive nature and expense, only a limited number of samples are typically obtained around a graft-vessel anastomosis. Thus, the access region is generally not completely evaluated, and three-dimensional (3D) information on the lesion area along the length of the vessel is not provided. Also, the fixation of tissue for histology results in shrinkage and some distortion of vessel structure from the in vivo condition. In addition, artifacts often occur during the preparation of thin histologic slices because of differences in cutting resistance between the soft vascular tissues and the more resilient sutures and grafts. The graft material often becomes detached from the tissue during processing, making the results of tissue histology difficult to analyze. Another obvious disadvantage of histologic analysis is that animals must be euthanized to obtain the tissue, precluding any further in vivo studies. For these reasons, a technique that readily yields information regarding hyperplasia development throughout a graft and attached vessels in vivo is needed. The development of such a technique could prove useful for evaluating hyperplasia development in patients as well.
Get Radiology Tree app to read full this article<
Get Radiology Tree app to read full this article<
Materials and methods
Porcine AV Graft Model
Get Radiology Tree app to read full this article<
MRI
Get Radiology Tree app to read full this article<
Table 1
Imaging Sequences and Parameters
Sequence Purpose Parameters 3D TSE To obtain black-blood images of vessel wall and suppress flow-related artifacts TE, 11 ms; TR, 665 ms; readout bandwidth, 140 Hz/pixel; ETL, 17; FOV, 192 × 156 mm 2 ; imaging matrix, 384 × 312; voxel dimensions, 0.5 × 0.5 × 0.5 mm 3 3D TOF To obtain 3D white-blood images of graft vascular geometry based on blood flow TE, 4.0 ms; TR, 25.0 ms; readout bandwidth, 190 Hz/pixel; FOV, 130 × 130 or 150 × 150 mm 2 ; imaging matrix, 384 × 312 × 64; voxel dimensions 0.3 × 0.45 × 0.6 mm 3 2D TSE For comparison with 3D TSE images to clarify luminal area TE, 63 ms; TR, 5,000 ms; readout bandwidth, 210 Hz/pixel; ETL, 15; FOV 180 × 180 mm 2 ; imaging matrix, 256 × 256; voxel dimensions, 0.7 × 0.7 × 1.5 mm 3 TSE with double inversion preparation To obtain 2D black-blood images with high in-plane resolution at the anastomoses TE, 13 ms; TR, 700 ms; TI, 500 ms readout bandwidth, 250 Hz/pixel; ETL, 9; FOV, 150 × 150 mm 2 ; imaging matrix, 328 × 328; voxel dimensions 0.48 × 0.48 × 2 mm 3 Axial 2D TOF To obtain white-blood images of longitudinal vessel geometry TE, 5.9 ms; TR, 30 ms; readout bandwidth, 72 Hz/pixel; FOV, 160 × 160 mm 2 ; thickness, 3 mm; imaging matrix, 256 × 256
ETL, echo train length; FOV, field of view; TE, echo time; 3D, 3-dimensional; TI, time inversion; TOF, time-of-flight; TR, repetition time; TSE, turbo spin-echo; 2D, 2-dimensional.
Get Radiology Tree app to read full this article<
Get Radiology Tree app to read full this article<
Histologic Analysis
Get Radiology Tree app to read full this article<
Correlation of Surface Areas Collected From MRI and Histology
Get Radiology Tree app to read full this article<
Results
Histology of AV Graft Hyperplasia
Get Radiology Tree app to read full this article<
Get Radiology Tree app to read full this article<
Comparison of In Vivo MR Image and Corresponding Ex Vivo Histologic Section
Get Radiology Tree app to read full this article<
Get Radiology Tree app to read full this article<
Get Radiology Tree app to read full this article<
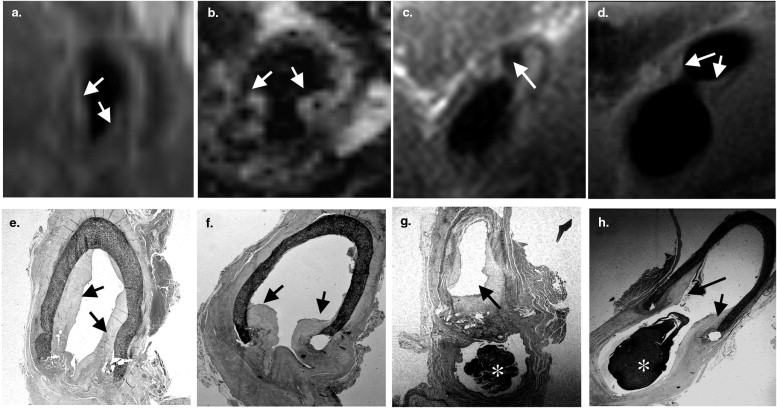
![Figure 3, Serial magnetic resonance (MR) images and corresponding histologic sections along an arteriovenous graft taken 6 weeks after graft placement. The axial MR image (a 3-dimensional volume collected by 3-dimensional turbo spin-echo MR imaging [MRI]) of the left venous anastomosis in a pig (a) underwent 2-dimensional multiplanar reconstruction to yield (b) and (c) . (b) A view orthogonal to the vertical dotted line dissecting the anastomosis in (a) . (c) A view orthogonal to the horizontal dotted line dissecting (b) . The view in (b) provides orientation of the angle and the location at which the image in (c) was collected, allowing accurate registration of the MR image with the histologic image in (e) . (d) The enlarged image of the venous anastomosis collected in (c) , with the closed arrow pointing to the hyperplastic tissue lining the graft. The line drawing represents the graft image in (b) and the location from which the MR image in (d) and histologic section in (e) were obtained. (f,h) Respective MR images obtained from the sequential middle and heel sections of the same venous anastomosis presented in (a) . (g,i) Corresponding histologic sections (stained with hematoxylin and eosin). The open arrows in (h) and (i) indicate an adjacent blood vessel. Closed arrows in this figure indicate hyperplastic tissue.](https://storage.googleapis.com/dl.dentistrykey.com/clinical/LongitudinalAssessmentofHyperplasiaUsingMagneticResonanceImagingwithoutContrastinaPorcineArteriovenousGraftModel/2_1s20S1076633208003371.jpg)
Get Radiology Tree app to read full this article<
Comparison of 2D Black-Blood TSE Images and 3D Black-Blood TSE Images
Get Radiology Tree app to read full this article<
Get Radiology Tree app to read full this article<
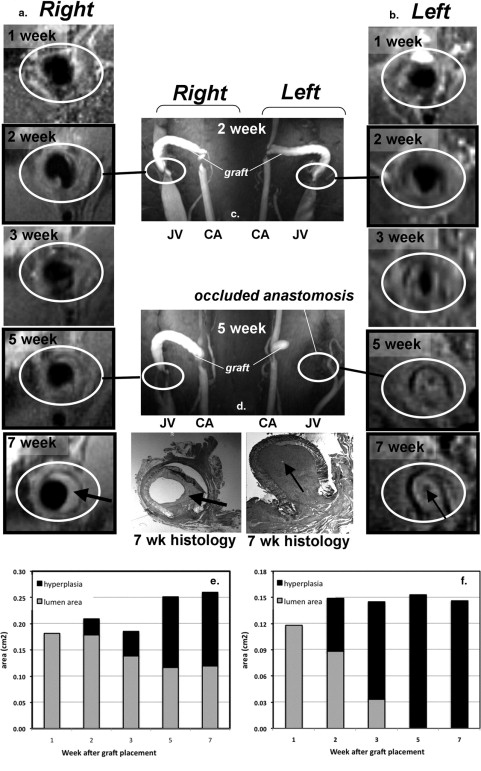
Serial MRI of AV Graft Hyperplasia Development
Get Radiology Tree app to read full this article<
Get Radiology Tree app to read full this article<
Get Radiology Tree app to read full this article<
Get Radiology Tree app to read full this article<
Quantification of Hyperplasia Surface Areas by MRI and Histology
Get Radiology Tree app to read full this article<
Table 2
Area of Hyperplasia Determined by Histology and Magnetic Resonance (MR) Imaging
Hyperplasia Area (mm 2 ) Section Histology MR Imaging 1 8.4 8.4 2 14.2 16.5 3 15.6 18.8 4 10.6 16.1 5 5.4 7.3
Arteriovenous grafts were explanted and fixed with formalin directly after MR image acquisition. Hyperplasia surface areas were obtained from MR images using OsiriX software (OsiriX Foundation, Geneva, Switzerland) and from histologic sections using ImageJ (National Institutes of Health, Bethesda, MD). The areas obtained from histologic sections and from MR images were significantly correlated ( r = 0.932, P = .02). Five different anastomoses from three animals were used.
Get Radiology Tree app to read full this article<
Discussion
Get Radiology Tree app to read full this article<
Get Radiology Tree app to read full this article<
Get Radiology Tree app to read full this article<
Get Radiology Tree app to read full this article<
Get Radiology Tree app to read full this article<
Get Radiology Tree app to read full this article<
Get Radiology Tree app to read full this article<
Acknowledgments
Get Radiology Tree app to read full this article<
Get Radiology Tree app to read full this article<
References
1. National Institute of Diabetes and Digestive and Kidney Diseases: US Renal Data System: USRDS 2000 Annual Data Report.2000.National Institute of Diabetes and Digestive and Kidney DiseasesBethesda, MD
2. Schwab S.J.: Hemodialysis vascular access: the Achilles’ heel remains. Kidney Int 2007; 72: pp. 665-666.
3. Li L, Terry CM, Shiu Y-T, et al. Neointimal hyperplasia associated with synthetic hemodialysis grafts. Kidney Int. In press.
4. Rotmans J.I., Velema E., Verhagen H.J., et. al.: Rapid, arteriovenous graft failure due to intimal hyperplasia: a porcine, bilateral, carotid arteriovenous graft model. J Surg Res 2003; 113: pp. 161-171.
5. Kelly B.S., Heffelfinger S.C., Whiting J.F., et. al.: Aggressive venous neointimal hyperplasia in a pig model of arteriovenous graft stenosis. Kidney Int 2002; 62: pp. 2272-2280.
6. Kuji T., Masaki T., Goteti K., et. al.: Efficacy of local dipyridamole therapy in a porcine model of arteriovenous graft stenosis. Kidney Int 2006; 69: pp. 2179-2185.
7. Johnson M.S., McLennan G., Lalka S.G., et. al.: The porcine hemodialysis access model. J Vasc Interv Radiol 2001; 12: pp. 969-977.
8. Asif A., Gadalean F.N., Merrill D., et. al.: Inflow stenosis in arteriovenous fistulas and grafts: a multicenter, prospective study. Kidney Int 2005; 67: pp. 1986-1992.
9. Cheung A.K., Terry C., Li L.: Pathogenesis and local drug delivery for prevention of vascular access stenosis. J Ren Nutr 2008; 18: pp. 140-145.
10. Li L., Terry C.M., Blumenthal D.K., et. al.: Cellular and morphological changes during neointimal hyperplasia development in a porcine arteriovenous graft model. Nephrol Dial Transplant 2007; 22: pp. 3139-3146.
11. Roy-Chaudhury P., Sukhatme V.P., Cheung A.K.: Hemodialysis vascular access dysfunction: a cellular and molecular viewpoint. J Am Soc Nephrol 2006; 17: pp. 1112-1127.
12. Terry C.M., Blumenthal D.K., Sikharam S., et. al.: Evaluation of histological techniques for quantifying haemodialysis arteriovenous (AV) graft hyperplasia. Nephrol Dial Transplant 2006; 21: pp. 3172-3179.
13. Rotmans J.I., Pattynama P.M., Verhagen H.J., et. al.: Sirolimus-eluting stents to abolish intimal hyperplasia and improve flow in porcine arteriovenous grafts: a 4-week follow-up study. Circulation 2005; 111: pp. 1537-1542.
14. Sun S., Beitler J.J., Ohki T., et. al.: Inhibitory effect of brachytherapy on intimal hyperplasia in arteriovenous fistula. J Surg Res 2003; 115: pp. 200-208.
15. McLennan G., Trerotola S.O., Forney M., et. al.: Short-term patency and safety of an expanded polytetrafluoroethylene encapsulated endoluminal device at the venous anastomosis of a canine arteriovenous graft model. J Vasc Interv Radiol 2001; 12: pp. 227-234.
16. Bakker C.J., Peeters J.M., Bartels L.W., et. al.: Magnetic resonance techniques in hemodialysis access management. J Vasc Access 2003; 4: pp. 125-139.
17. Zhang J., Hecht E.M., Maldonado T., et. al.: Time-resolved 3D MR angiography with parallel imaging for evaluation of hemodialysis fistulas and grafts: initial experience. AJR Am J Roentgenol 2006; 186: pp. 1436-1442.
18. Doelman C., Duijm L.E., Liem Y.S., et. al.: Stenosis detection in failing hemodialysis access fistulas and grafts: comparison of color Doppler ultrasonography, contrast-enhanced magnetic resonance angiography, and digital subtraction angiography. J Vasc Surg 2005; 42: pp. 739-746.
19. Froger C.L., Duijm L.E., Liem Y.S., et. al.: Stenosis detection with MR angiography and digital subtraction angiography in dysfunctional hemodialysis access fistulas and grafts. Radiology 2005; 234: pp. 284-291.
20. Han K.M., Duijm L.E., Thelissen G.R., et. al.: Failing hemodialysis access grafts: evaluation of complete vascular tree with 3D contrast-enhanced MR angiography with high spatial resolution: initial results in 10 patients. Radiology 2003; 227: pp. 601-605.
21. Laissy J.P., Menegazzo D., Debray M.P., et. al.: Failing arteriovenous hemodialysis fistulas: assessment with magnetic resonance angiography. Invest Radiol 1999; 34: pp. 218-224.
22. Bos C., Smits J.H., Zijlstra J.J., et. al.: MRA of hemodialysis access grafts and fistulae using selective contrast injection and flow interruption. Magn Reson Med 2001; 45: pp. 557-561.
23. Waldman G.J., Pattynama P.M., Chang P.C., et. al.: Magnetic resonance angiography of dialysis access shunts: initial results. Magn Reson Imaging 1996; 14: pp. 197-200.
24. Smits J.H., Bos C., Elgersma O.E., et. al.: Hemodialysis access imaging: comparison of flow-interrupted contrast-enhanced MR angiography and digital subtraction angiography. Radiology 2002; 225: pp. 829-834.
25. Worthley S.G., Helft G., Fuster V., et. al.: Noninvasive in vivo magnetic resonance imaging of experimental coronary artery lesions in a porcine model. Circulation 2000; 101: pp. 2956-2961.
26. Hayes C.E., Mathis C.M., Yuan C.: Surface coil phased arrays for high-resolution imaging of the carotid arteries. J Magn Reson Imaging 1996; 6: pp. 109-112.
27. Hayes C.E., Hattes N., Roemer P.B.: Volume imaging with MR phased arrays. Magn Reson Med 1991; 18: pp. 309-319.
28. Misra S., Doherty M.G., Woodrum D., et. al.: Adventitial remodeling with increased matrix metalloproteinase-2 activity in a porcine arteriovenous polytetrafluoroethylene grafts. Kidney Int 2005; 68: pp. 2890-2900.
29. Helft G., Worthley S.G., Fuster V., et. al.: Atherosclerotic aortic component quantification by noninvasive magnetic resonance imaging: an in vivo study in rabbits. J Am Coll Cardiol 2001; 37: pp. 1149-1154.
30. Swedberg S.H., Brown B.G., Sigley R., et. al.: Intimal fibromuscular hyperplasia at the venous anastomosis of PTFE grafts in hemodialysis patients. Circulation 1989; 80: pp. 1726-1736.
31. Sloop G.D., Fallon K.B., Zieske A.W.: Atherosclerotic plaque-like lesions in synthetic arteriovenous grafts: implications for atherogenesis. Atherosclerosis 2002; 160: pp. 133-139.
32. Corot C., Robert P., Idee J.M., et. al.: Recent advances in iron oxide nanocrystal technology for medical imaging. Adv Drug Deliv Rev 2006; 58: pp. 1471-1504.
33. Herborn C.U., Vogt F.M., Lauenstein T.C., et. al.: Magnetic resonance imaging of experimental atherosclerotic plaque: comparison of two ultrasmall superparamagnetic particles of iron oxide. J Magn Reson Imaging 2006; 24: pp. 388-393.
34. Ke T., Jeong E.K., Wang X., et. al.: RGD targeted poly(L-glutamic acid)-cystamine-(Gd-DO3A) conjugate for detecting angiogenesis biomarker alpha(v) beta3 integrin with MRT, mapping. Int J Nanomed 2007; 2: pp. 191-199.