
Rationale and Objectives
Previous cross-sectional studies have demonstrated that airway wall thickness and air trapping are greater in subjects with severe asthma than in those with mild-to-moderate asthma. However, a better understanding of how airway remodeling and lung density change over time is needed. This study aimed to evaluate predictors of airway wall remodeling and change in lung function and lung density over time in severe asthma.
Materials and methods
Phenotypic characterization and quantitative multidetector-row computed tomography (MDCT) of the chest were performed at baseline and ∼2.6 years later in 38 participants with asthma (severe n = 24 and mild-to-moderate n = 14) and nine normal controls from the Severe Asthma Research Program.
Results
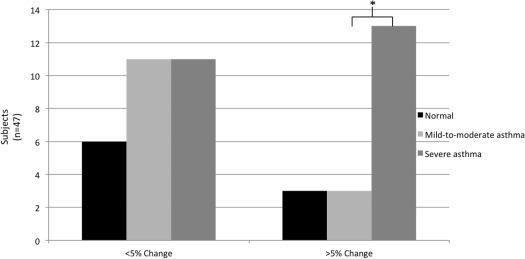
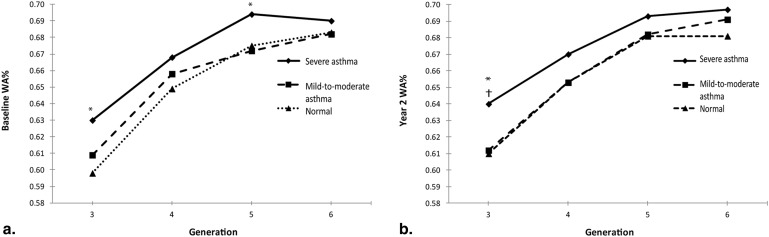
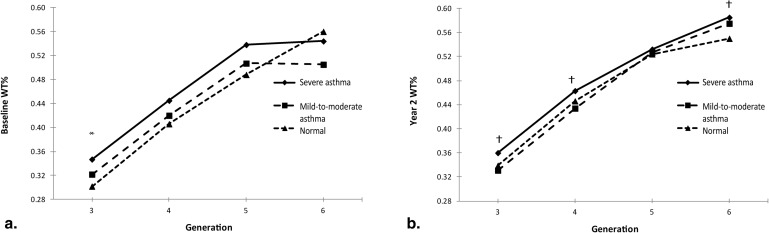
Subjects with severe asthma had a significant decline in postbronchodilator forced expiratory volume in 1 second percent (FEV 1 %) predicted over time ( P < .001). Airway wall thickness measured by MDCT was increased at multiple airway generations in severe asthma compared to mild-to-moderate asthma (wall area percent [WA%]: P < .05) and normals ( P < .05) at baseline and year 2. Over time, there was an increase in WA% and wall thickness percent (WT%) in all subjects ( P = .030 and .009, respectively) with no change in emphysema-like lung or air trapping. Baseline prebronchodilator FEV 1 % inversely correlated with WA% and WT% (both P < .05). In a multivariable regression model, baseline WA%, race, and health care utilization were predictors of subsequent airway remodeling.
Conclusions
Severe asthma subjects have a greater decline in lung function over time than normal subjects or those with mild-to-moderate asthma. MDCT provides a noninvasive measure of airway wall thickness that may predict subsequent airway remodeling.
Over 25 million people in the United States are afflicted with asthma . The increased rate of decline in forced expiratory volume in 1 second (FEV 1 ) in subjects with asthma compared to normal subjects has been reported to be 5–25 mL/year . Most of the longitudinal studies to date have focused primarily on decline in lung function in asthma and response to treatment . When compared to controls, airway walls are thicker in older but not in younger subjects with fatal asthma, suggesting that airway remodeling is a progressive process over time . Airway remodeling defined by histologic airway wall thickening has been associated with airway hyperreactivity and airflow obstruction .
In cross-sectional studies, increased airway wall area (WA) and wall thickness (WT) measured by computed tomography (CT) correlate with asthma severity and negatively correlate with FEV 1 . Airway WA measured by CT also correlates with histologic airway wall thickening on endobronchial airway biopsies . Studies focusing on the progression of the airway remodeling in asthma radiographically and pathologically over time have been limited.
Get Radiology Tree app to read full this article<
Materials and Methods
Get Radiology Tree app to read full this article<
Get Radiology Tree app to read full this article<
Get Radiology Tree app to read full this article<
Get Radiology Tree app to read full this article<
Results
Participant Characteristics
Get Radiology Tree app to read full this article<
Table 1
Baseline Demographics
Variable Normal ( n = 9) Mild-to-Moderate Asthma ( n = 14) Severe Asthma ( n = 24)P Value (All Severity Groups) ∗ P Value (Mild-to-Moderate vs. Severe) ∗ Age at DOE (years), mean ± SD 35.2 ± 9.5 36.5 ± 10.0 36.2 ± 16.3 .990 .950 Female, n (%) 6 (66.7) 9 (64.3) 16 (66.7) .988 1.000 Race, n (%) African-American 1 (11.1) 5 (35.7) 14 (58.3) .018 .190 Caucasian 8 (88.9) 8 (57.1) 6 (25.0) Other races 0 (0.00) 1 (7.14) 4 (16.7) BMI (kg/m 2 ) 30.8 ± 11.0 29.1 ± 5.1 32.3 ± 7.9 .321 .120 Age onset (year) NA 12.5 ± 13.2 14.8 ± 15.0 .542 .540 Duration of asthma (years) NA 24.0 ± 13.5 21.4 ± 12.2 .628 .630 IgE (IU/mL) 129 ± 167 209 ± 144 777 ± 896 † .004 .020 EOS (%) 2.44 ± 1.51 3.84 ± 3.24 4.04 ± 3.50 .519 .700 Atopy, n (%) 5 (62.5) 13 (100.0) 17 (100.0) .024 1.000 Ever visited ED, n (%) NA 11 (78.6) 23 (95.8) NA .130 ED during last year, n (%) NA 2 (14.3) 12 (50.0) NA .040 Ever hospitalized, n (%) NA 6 (42.9) 21 (87.5) NA .008 Hospitalized during last year, n (%) NA 0 (0.00) 7 (29.2) NA .033 Ever ICU, n (%) NA 1 (7.14) 15 (62.5) NA .002 ICU during last year, n (%) NA 0 (0.00) 12.5 NA .280 Medical therapy ICS only, n (%) ‡ 0 1 (7) 5 (21) NA .64 ICS/LABA, n (%) 0 8 (57) 21 (88) NA .099 OCS, n (%) 0 0 (0) 15 (63) NA <.001 LTRA, n (%) 0 21 14 (58) NA .08 Omalizumab, n (%) 0 0 (0) 6 (25) NA .07
Atopy, positive allergy skin test (see Methods section); BMI, body mass index; DOE = date of entry; ED, emergency department; EOS%, percentage of peripheral blood eosinophils; ICS, inhaled corticosteroids; ICU, intensive care unit; IgE, immunoglobulin E; LABA, long-acting beta agonist; LTRA, leukotriene receptor antagonist; NA, not applicable; OCS, oral corticosteroid; SD, standard deviation.
Get Radiology Tree app to read full this article<
Get Radiology Tree app to read full this article<
Get Radiology Tree app to read full this article<
Table 2
Baseline and Year 2 Lung Function
Time Point Pre- or Post-BD Normal ( n = 9) Mild-to-Moderate Asthma ( n = 14) Severe Asthma ( n = 24)P Value (All Groups) ∗ P Value (Mild-to-Moderate vs. Severe) ∗ P Value Comparing Baseline to Year 2 (All Groups) ∗ P Value Comparing Baseline to Year 2 (Severe Asthma Only) ∗ FEV 1 % predicted Baseline Pre- 96.2 ± 6.7 83.1 ± 12.3 76.1 ± 19.7 <.01 .24 — — Post- 100.0 ± 6.6 91.9 ± 11.5 91.2 ± 16.7 .26 .89 — — Year 2 Pre- 93.3 ± 5.6 80.2 ± 12.9 69.0 ± 23.0 <.01 .11 .14 .14 Post- 97.8 ± 6.6 90.0 ± 14.6 81.9 ± 21.2 † .06 .21 <.01 <.01 Percent change in FEV 1 after BD Baseline 4.0 ± 2.2 11.0 ± 6.9 24.9 ± 32.6 .02 .11 — — Year 2 4.72 ± 3.1 12.6 ± 8.8 23.5 ± 24.0 .046 .12 .91 .94 FEV 1 /FVC Baseline Pre- 0.83 ± 0.09 0.74 ± 0.09 0.69 ± 0.11 <.01 .20 — — Post- 0.84 ± 0.07 0.78 ± 0.09 0.75 ± 0.11 .048 .28 — — Year 2 Pre- 0.81 ± 0.06 0.71 ± 0.07 0.65 ± 0.11 <.01 .10 .06 .06 Post- 0.85 ± 0.05 0.77 ± 0.09 0.71 ± 0.10 † <.01 .046 .09 .02 PC 20 ‡ (mg/dL) Baseline, ( n = 27) >16.0 1.66 ± 1.94 0.87 ± 1.17 NA .21 — — Year 2, ( n = 13) — 1.04 ± 1.47 1.96 ± 3.47 NA .69 — .69
BD, bronchodilation (maximum bronchodilation after 540–720 μg albuterol); FEV 1 , forced expiratory volume in 1 second; FVC, forced vital capacity; PC 20 , provocative concentration of methacholine required to decrease FEV 1 by 20%; NA, not applicable.
Data are expressed as mean ± standard deviation.
Get Radiology Tree app to read full this article<
Get Radiology Tree app to read full this article<
Get Radiology Tree app to read full this article<
Get Radiology Tree app to read full this article<
Change in Lung Function over Time
Get Radiology Tree app to read full this article<
Get Radiology Tree app to read full this article<
Change in Airway WT by Quantitative MDCT Chest over Time
Get Radiology Tree app to read full this article<
Table 3
Change in MDCT Airway Remodeling over Time
Generation Baseline Year 2 Normal Control Mild-to-Moderate Asthma Severe Asthma All Groups Normal Control Mild-to-Moderate Asthma Severe Asthma All Groups 3 WA% 0.598 ± 0.009 0.609 ± 0.026 0.630 ± 0.031 0.618 ± 0.029 0.610 ± 0.025 0.612 ± 0.028 0.640 ± 0.026 0.626 ± 0.030 WT% 0.302 ± 0.017 0.322 ± 0.048 0.347 ± 0.050 0.331 ± 0.048 0.339 ± 0.049 0.331 ± 0.062 0.360 ± 0.047 0.347 ± 0.053 4 WA% 0.649 ± 0.022 0.658 ± 0.032 0.668 ± 0.033 0.662 ± 0.031 0.653 ± 0.025 0.653 ± 0.026 0.670 ± 0.023 0.662 ± 0.025 WT% 0.406 ± 0.042 0.420 ± 0.058 0.445 ± 0.081 0.430 ± 0.070 0.446 ± 0.082 0.434 ± 0.082 0.463 ± 0.069 0.451 ± 0.075 5 WA% 0.675 ± 0.024 0.672 ± 0.031 0.694 ± 0.020 0.684 ± 0.026 0.681 ± 0.021 0.682 ± 0.019 0.693 ± 0.018 0.687 ± 0.019 WT% 0.488 ± 0.045 0.507 ± 0.112 0.538 ± 0.067 0.520 ± 0.079 0.524 ± 0.057 0.527 ± 0.084 0.532 ± 0.061 0.529 ± 0.065 6 WA% 0.683 ± 0.023 0.682 ± 0.025 0.690 ± 0.033 0.686 ± 0.029 0.681 ± 0.025 0.691 ± 0.022 0.697 ± 0.029 0.693 ± 0.027 WT% 0.560 ± 0.050 0.505 ± 0.074 0.544 ± 0.071 0.539 ± 0.069 0.550 ± 0.070 0.575 ± 0.068 0.585 ± 0.073 0.576 ± 0.071
Multidetector computed tomography chest WA% and WT% are dimensionless units calculated as follows: WA% calculated by WA/total area × 100 and WT% calculated by WT/average outer diameter × 100.
Generation refers to airway generation where generation 3 is the first segmental bronchus.
Get Radiology Tree app to read full this article<
Get Radiology Tree app to read full this article<
Get Radiology Tree app to read full this article<
Relationship between Lung Function and Airway Remodeling Measured by MDCT
Get Radiology Tree app to read full this article<
Get Radiology Tree app to read full this article<
Predictors of Changes in Airway Remodeling as Measured by MDCT
Get Radiology Tree app to read full this article<
Get Radiology Tree app to read full this article<
Change in Lung Density by Quantitative MDCT Chest over Time
Get Radiology Tree app to read full this article<
Get Radiology Tree app to read full this article<
Discussion
Get Radiology Tree app to read full this article<
Get Radiology Tree app to read full this article<
Get Radiology Tree app to read full this article<
Get Radiology Tree app to read full this article<
Get Radiology Tree app to read full this article<
Get Radiology Tree app to read full this article<
Supplementary Data
Get Radiology Tree app to read full this article<
Supplementary Data
Get Radiology Tree app to read full this article<
Get Radiology Tree app to read full this article<
Get Radiology Tree app to read full this article<
Get Radiology Tree app to read full this article<
Get Radiology Tree app to read full this article<
References
1. Akinbami L.J., Moorman J.E., Bailey C., et. al.: Trends in asthma prevalence, health care use, and mortality in the United States, 2001–2010. NCHS Data Brief 2012; pp. 1-8.
2. Cibella F., Cuttitta G., Bellia V., et. al.: Lung function decline in bronchial asthma. Chest 2002; 122: pp. 1944-1948.
3. Schachter E.N., Doyle C.A., Beck G.J.: A prospective study of asthma in a rural community. Chest 1984; 85: pp. 623-630.
4. Ulrik C.S., Lange P.: Decline of lung function in adults with bronchial asthma. Am J Respir Crit Care Med 1994; 150: pp. 629-634.
5. Dijkstra A., Vonk J.M., Jongepier H., et. al.: Lung function decline in asthma: association with inhaled corticosteroids, smoking and sex. Thorax 2006; 61: pp. 105-110.
6. Lange P., Scharling H., Ulrik C.S., et. al.: Inhaled corticosteroids and decline of lung function in community residents with asthma. Thorax 2006; 61: pp. 100-104.
7. Bai T.R., Cooper J., Koelmeyer T., et. al.: The effect of age and duration of disease on airway structure in fatal asthma. Am J Respir Crit Care Med 2000; 162: pp. 663-669.
8. Jeffery P.K., Wardlaw A.J., Nelson F.C., et. al.: Bronchial biopsies in asthma. An ultrastructural, quantitative study and correlation with hyperreactivity. Am Rev Respir Dis 1989; 140: pp. 1745-1753.
9. James A.L., Pare P.D., Hogg J.C.: The mechanics of airway narrowing in asthma. Am Rev Respir Dis 1989; 139: pp. 242-246.
10. Aysola R.S., Hoffman E.A., Gierada D., et. al.: Airway remodeling measured by multidetector CT is increased in severe asthma and correlates with pathology. Chest 2008; 134: pp. 1183-1191.
11. Niimi A., Matsumoto H., Amitani R., et. al.: Airway wall thickness in asthma assessed by computed tomography. Relation to clinical indices. Am J Respir Crit Care Med 2000; 162: pp. 1518-1523.
12. Kasahara K., Shiba K., Ozawa T., et. al.: Correlation between the bronchial subepithelial layer and whole airway wall thickness in patients with asthma. Thorax 2002; 57: pp. 242-246.
13. Moore W.C., Bleecker E.R., Curran-Everett D., et. al.: Characterization of the severe asthma phenotype by the National Heart, Lung, and Blood Institute’s Severe Asthma Research Program. J Allergy Clin Immunol 2007; 119: pp. 405-413.
14. Miller M.R., Hankinson J., Brusasco V., et. al.: Standardisation of spirometry. Eur Respir J 2005; 26: pp. 319-338.
15. Tschirren J., Hoffman E.A., McLennan G., et. al.: Intrathoracic airway trees: segmentation and airway morphology analysis from low-dose CT scans. IEEE Trans Med Imaging 2005; 24: pp. 1529-1539.
16. Tschirren J., Hoffman E.A., McLennan G., et. al.: Segmentation and quantitative analysis of intrathoracic airway trees from computed tomography images. Proc Am Thorac Soc 2005; 2: pp. 484-487. 503-484
17. Tschirren J., McLennan G., Palagyi K., et. al.: Matching and anatomical labeling of human airway tree. IEEE Trans Med Imaging 2005; 24: pp. 1540-1547.
18. Hu S., Hoffman E.A., Reinhardt J.M.: Automatic lung segmentation for accurate quantitation of volumetric X-ray CT images. IEEE Trans Med Imaging 2001; 20: pp. 490-498.
19. Reinhardt J.M., R S., DS N., et. al.: Intrathoracic airway measurement: ex-vivo validation.Hoffman E.A.Medical imaging 1997: physiology and function from multidimensional images.1997.SPIEBellingham, Wash., USA:
20. Gupta S., Siddiqui S., Haldar P., et. al.: Qualitative analysis of high-resolution CT scans in severe asthma. Chest 2009; 136: pp. 1521-1528.
21. Benayoun L., Druilhe A., Dombret M.C., et. al.: Airway structural alterations selectively associated with severe asthma. Am J Respir Crit Care Med 2003; 167: pp. 1360-1368.
22. Bourdin A., Neveu D., Vachier I., et. al.: Specificity of basement membrane thickening in severe asthma. J Allergy Clin Immunol 2007; 119: pp. 1367-1374.
23. Macedo P., Hew M., Torrego A., et. al.: Inflammatory biomarkers in airways of patients with severe asthma compared with non-severe asthma. Clin Exp Allergy 2009; 39: pp. 1668-1676.
24. Pepe C., Foley S., Shannon J., et. al.: Differences in airway remodeling between subjects with severe and moderate asthma. J Allergy Clin Immunol 2005; 116: pp. 544-549.
25. Cohen L., E X., Horiuchi T., et. al.: Epithelial cell proliferation contributes to airway remodeling in severe asthma. Am J Res Crit Care Med 2007; 176: pp. 138-145.
26. Gupta S., Siddiqui S., Haldar P., et. al.: Quantitative analysis of high-resolution computed tomography scans in severe asthma subphenotypes. Thorax 2010; 65: pp. 775-781.
27. Kurt E., Ozkan R., Orman A., et. al.: Irreversibility of remodeled features on high-resolution computerized tomography scans of asthmatic patients on conventional therapy: a 6-year longitudinal study. J Asthma 2009; 46: pp. 300-307.
28. Castro M., Fain S.B., Hoffman E.A., et. al.: Lung imaging in asthmatic patients: the picture is clearer. J Allergy Clin Immunol 2011; 128: pp. 467-478.
29. Tanabe N., Muro S., Hirai T., et. al.: Impact of exacerbations on emphysema progression in chronic obstructive pulmonary disease. Am J Respir Crit Care Med 2011; 183: pp. 1653-1659.
30. Busacker A., Newell J.D., Keefe T., et. al.: A multivariate analysis of risk factors for the air-trapping asthmatic phenotype as measured by quantitative CT analysis. Chest 2009; 135: pp. 48-56.
31. Kozlowski J., Castro M., Hoffman E.A., et. al.: Repeatability of CT airway measurements in severe asthma [abstract]. Am J Respir Crit Care Med 2011; 183: pp. A2194.