
Rationale and Objectives
Tuberous sclerosis complex (TSC) is a genetic neurocutaneous syndrome in which cognitive and social-behavioral outcomes for patients vary widely in an unpredictable manner. The cause of adverse neurologic outcome remains unclear. The aim of this study was to investigate the hypothesis that disordered white matter and abnormal neural connectivity are associated with adverse neurologic outcomes.
Materials and Methods
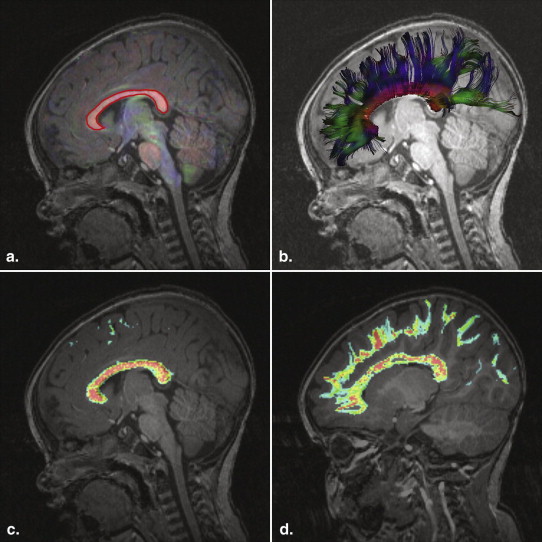
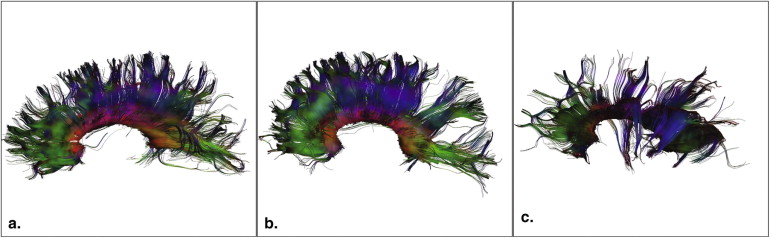
Structural and diffusion magnetic resonance imaging was carried out in 40 subjects with TSC (age range, 0.5–25 years; mean age, 7.2 years; median age, 5 years), 12 of whom had autism spectrum disorders (ASD), and in 29 age-matched controls. Tractography of the corpus callosum was used to define a three-dimensional volume of interest. Regional averages of four diffusion scalar parameters of the callosal projections were calculated for each subject. These were the average fractional anisotropy (AFA) and the average mean, radial, and axial diffusivity.
Results
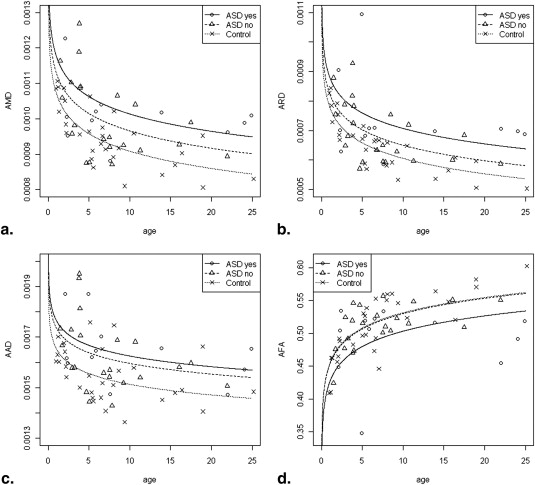
Subjects with TSC had significantly lower AFA and higher average mean, radial, and axial diffusivity values compared to controls. Subjects with TSC and ASD had significantly lower AFA values compared to those without ASD and compared to controls. Subjects with TSC without ASD had similar AFA values compared to controls.
Conclusion
Diffusion tensor scalar parameters provided measures of properties of the three-dimensional callosal projections. In TSC, changes in these parameters may reflect microstructural changes in myelination, axonal integrity, or extracellular environment. Alterations in white matter microstructural properties were associated with TSC, and larger changes were associated with TSC and ASD, thus establishing a relationship between altered white matter microstructural integrity and brain function.
Tuberous sclerosis complex (TSC) is a genetic neurocutaneous syndrome with an estimated incidence of one in 6000 to 10,000. Although some patients with TSC may never show neurologic symptoms affecting their quality of life, epilepsy occurs in 80% to 90% of all patients, close to 45% of patients have mild to profound intellectual disabilities, and autism spectrum disorders (ASD) occur in up to 50% of patients .
The cause of neurologic deficits in patients with TSC is a key unresolved question, and neurologic outcomes remains highly variable and unpredictable. It has been hypothesized that tubers disrupt local cerebral architecture, resulting in impaired brain function. However, no robust conventional magnetic resonance imaging (MRI) measure of tubers correlates consistently with the clinical phenotype or long-term neurologic outcomes , and neither a high tuber load nor tubers in specific locations are necessary or sufficient to predict seizures, cognitive impairment, or autism .
Get Radiology Tree app to read full this article<
Get Radiology Tree app to read full this article<
Get Radiology Tree app to read full this article<
Get Radiology Tree app to read full this article<
Materials and methods
Subjects
Get Radiology Tree app to read full this article<
Get Radiology Tree app to read full this article<
Data Acquisition and Analysis
Get Radiology Tree app to read full this article<
Get Radiology Tree app to read full this article<
Get Radiology Tree app to read full this article<
Get Radiology Tree app to read full this article<
pk+1=pk+vks p
k
+
1
=
p
k
+
v
k
s
The new point p k +1 is tested to ensure that it is inside the image boundary and inside the region to be considered for tractography. A mask can be used to ensure that tractography does not step through regions with no white matter. Streamline generation is terminated if points are not validated. Streamline termination criteria related to the FA and angle changes are then checked.
Get Radiology Tree app to read full this article<
Get Radiology Tree app to read full this article<
Fk+1=αFk+(1−α)FA(DK+1) F
k
+
1
=
α
F
k
+
(
1
−
α
)
FA
(
D
K
+
1
)
where FA( D k +1 ) is the FA of the tensor D k +1 . The primary eigenvector of the tensor is computed, providing e k +1 . The angle criterion is assessed by accumulating the cosine of trajectory angle changes, :
k+1=βk+(1−β)(∑3j=1ek+1jvjk) k
+
1
=
β
k
+
(
1
−
β
)
(
∑
j
=
1
3
e
j
k
+
1
v
k
j
)
The new direction of the streamline is calculated using a combination of the primary eigenvector and tensor deflection, while accounting for the previous direction of the streamline:
vk+1∝γvk+(1−γ)[δ(Dk+1)ϵvk+(1−δ)ek+1] v
k
+
1
∝
γ
v
k
+
(
1
−
γ
)
[
δ
(
D
k
+
1
)
ϵ
v
k
+
(
1
−
δ
)
e
k
+
1
]
Propagation of each streamline was terminated if the trajectory FA fell below 0.15 or if the tract trajectory angle exceeded 30°. The trajectories were obtained using the step size parameter s = 0.33 mm, α = 0.5, β = 0.5, γ = 0.5, δ = 0.5, and tensor deflection power ϵ = 2.
Get Radiology Tree app to read full this article<
Get Radiology Tree app to read full this article<
Get Radiology Tree app to read full this article<
m=∑idipi∑idi,v=∑idi(pi−m)2∑id2i m
=
∑
i
d
i
p
i
∑
i
d
i
,
v
=
∑
i
d
i
(
p
i
−
m
)
2
∑
i
d
i
2
Get Radiology Tree app to read full this article<
Get Radiology Tree app to read full this article<
Get Radiology Tree app to read full this article<
Get Radiology Tree app to read full this article<
AFA=∑idiFAi∑idivar(AFA)=∑idi(FAi−AFA)2∑id2i, AFA
=
∑
i
d
i
F
A
i
∑
i
d
i
var
(
AFA
)
=
∑
i
d
i
(
FA
i
−
AFA
)
2
∑
i
d
i
2
,
where i is the index of each voxel, d i is the streamline density at voxel i , and FA i is the FA.
Get Radiology Tree app to read full this article<
Get Radiology Tree app to read full this article<
Statistical Analysis
Get Radiology Tree app to read full this article<
Results
Patients
Get Radiology Tree app to read full this article<
Get Radiology Tree app to read full this article<
Diffusion Tensor Properties of Projections of the Corpus Callosum
Patients with TSC and controls
Get Radiology Tree app to read full this article<
Table 1
P Values Using the Linear Regression Model with the DTI Measure as the Response and Group (Control, TSC, TSC without ASD, TSC with ASD) and Log (Age) as the Predictors
DTI Measure Control vs TSC (All Cases) Control vs TSC without ASD Control vs TSC with ASD TSC without ASD vs TSC with ASD AMD .000652 .022068 .000807 .128267 (NS) ARD .00200 .062096 (NS) .000764 .060672 (NS) AAD .000876 .011224 .005148 .467143 (NS) AFA .0350 .8947 (NS) .0266 .0421
AAD, average axial diffusivity; AFA, average fractional anisotropy; AMD, average mean diffusivity; ARD, average radial diffusivity; ASD, autism spectrum disorder; DTI, diffusion tensor imaging; TSC, tuberous sclerosis complex.
All four DTI measures differed significantly between controls and patients with TSC.
AFA was significantly lower in the subjects with TSC with ASD compared to those without ASD, but no difference was found between patients with TSC without ASD and controls.
Get Radiology Tree app to read full this article<
Patients with TSC with and without ASD and controls
Get Radiology Tree app to read full this article<
Get Radiology Tree app to read full this article<
Callosal volume
Get Radiology Tree app to read full this article<
Discussion
Relation between White Matter Microstructure and the Development of Brain Function
Get Radiology Tree app to read full this article<
Get Radiology Tree app to read full this article<
Get Radiology Tree app to read full this article<
Table 2
Summary of Published DTI Studies Involving NAWM in TSC
Study n Age (y) ∗ MRI Directions Key Findings † Garaci et al (2004) 18 20 (12–30) 1.5 T 6 MD of perilesional NAWM higher than contralateral NAWM. NAWM of frontal, occipital, and parietal regions and CSO higher MD. Peng et al (2004) 7 0.5–15 1.5 T 6 Lower FA of WM lesions associated with tubers vs contralateral NAWM. Higher MD of CR and SS. Increased λ3 of ILF and SS. Karadag et al 2005 7 2–20 1.5 T 6 Higher MD of tubers vs cortex of controls. Increased MD and lower FA in WM lesions and perilesional WM. No difference in MD and FA of NAWM. Firat et al (2006) 6 9 (3–15) 1.5 T 6 MD of tubers higher than NAWM. MD of NAWM not different from controls. Makki et al (2007) 6 10 (6–15) 1.5 T 6 Higher MD, lower FA in combined NAWM of genu/splenium CC, IC/EC. Greatest increase was in λ2,3 (ie, RD). Arulrajah et al (2009) 23 12 (1–25) 1.5 T 3–18 Increased MD of frontal and pontine NAWM (in subgroup aged 8–12 y), right parietal and occipital NAWM (in subgroup aged > 12 y). Krishnan et al (2010) 10 1.5–25 3 T 35 Lower FA in splenium CC and GCT, lower AD in IC, STG and GCT, increased MD and RD in splenium CC. Simao et al (2010) 12 9 (5–16) 3 T 15 Increased MD, decreased FA, increased RD in genu and splenium CC. Increased MD in IC. DTI measures of genu and splenium CC correlate with tuber volume (not number). This study 40 7 (0.5–25) 3 T 35 Lower FA, higher MD, RD, AD of entire CC in TSC (all) and TSC (with ASD). Lower FA of CC in TSC with ASD vs TSC without ASD. No difference in FA of CC in TSC without ASD.
AD, axial diffusivity; ASD, autism spectrum disorder; CC, corpus callosum; CR, corona radiata; CSO, centrum semiovale; DTI, diffusion tensor imaging; EC, external capsule; FA, fractional anisotropy; GCT, geniculocalcarine tract; IC, internal capsule; ILF, inferior longitudinal fasciculus; MD, mean diffusivity; MRI, magnetic resonance imaging; NAWM, normal-appearing white matter; RD, radial diffusivity; SS, sagittal striatum; STG, superior temporal gyrus; TSC, tuberous sclerosis complex; WM, white matter.
Get Radiology Tree app to read full this article<
Get Radiology Tree app to read full this article<
Get Radiology Tree app to read full this article<
Get Radiology Tree app to read full this article<
Get Radiology Tree app to read full this article<
Get Radiology Tree app to read full this article<
Get Radiology Tree app to read full this article<
Streamline Density-Weighted Statistics
Get Radiology Tree app to read full this article<
Get Radiology Tree app to read full this article<
Conclusions
Get Radiology Tree app to read full this article<
Get Radiology Tree app to read full this article<
Get Radiology Tree app to read full this article<
Acknowledgments
Get Radiology Tree app to read full this article<
Get Radiology Tree app to read full this article<
References
1. Curatolo P., Bombardieri R., Jozwiak S.: Tuberous sclerosis. Lancet 2008; 372: pp. 657-668.
2. Wong V.: Study of the relationship between tuberous sclerosis complex and autistic disorder. J Child Neurol 2006; 21: pp. 199-204.
3. Jansen F.E., Vincken K.L., Algra A., et. al.: Cognitive impairment in tuberous sclerosis complex is a multifactorial condition. Neurology 2008; 70: pp. 916-923.
4. Clifford S., Dissanayake C., Bui Q.M., et. al.: Autism spectrum phenotype in males and females with fragile X full mutation and premutation. J Autism Dev Disord 2007; 37: pp. 738-747.
5. Choi Y.J., Di Nardo A., Kramvis I., et. al.: Tuberous sclerosis complex proteins control axon formation. Genes Dev 2008; 22: pp. 2485-2495.
6. Meikle L., Talos D.M., Onda H., et. al.: A mouse model of tuberous sclerosis: neuronal loss of Tsc1 causes dysplastic and ectopic neurons, reduced myelination, seizure activity, and limited survival. J Neurosci 2007; 27: pp. 5546-5558.
7. Nie D., Di Nardo A., Han J.M., et. al.: Tsc2-Rheb signaling regulates EphA-mediated axon guidance. Nat Neurosci 2010; 13: pp. 163-172.
8. Arulrajah S., Ertan G., Jordan L., et. al.: Magnetic resonance imaging and diffusion-weighted imaging of normal-appearing white matter in children and young adults with tuberous sclerosis complex. Neuroradiology 2009; 51: pp. 781-786.
9. Makki M.I., Chugani D.C., Janisse J., et. al.: Characteristics of abnormal diffusivity in normal-appearing white matter investigated with diffusion tensor MR imaging in tuberous sclerosis complex. AJNR Am J Neuroradiol 2007; 28: pp. 1662-1667.
10. Krishnan M.L., Commowick O., Jeste S.S., et. al.: Diffusion features of white matter in tuberous sclerosis with tractography. Pediatr Neurol 2010; 42: pp. 101-106.
11. Simao G., Raybaud C., Chuang S., et. al.: Diffusion tensor imaging of commissural and projection white matter in tuberous sclerosis complex and correlation with tuber load. AJNR Am J Neuroradiol 2010; 31: pp. 1273-1277.
12. Alexander A.L., Lee J.E., Lazar M., et. al.: Diffusion tensor imaging of the corpus callosum in Autism. Neuroimage 2007; 34: pp. 61-73.
13. Keller T.A., Kana R.K., Just M.A.: A developmental study of the structural integrity of white matter in autism. Neuroreport 2007; 18: pp. 23-27.
14. Roach E.S., Gomez M.R., Northrup H.: Tuberous sclerosis complex consensus conference: revised clinical diagnostic criteria. J Child Neurol 1998; 13: pp. 624-628.
15. American Psychiatric Association. Diagnostic and statistical manual of mental disorders. 4th ed, text rev. Arlington, VA: American Psychiatric Association; 2000.
16. Lord C., Risi S., Lambrecht L., et. al.: The autism diagnostic observation schedule-generic: a standard measure of social and communication deficits associated with the spectrum of autism. J Autism Dev Disord 2000; 30: pp. 205-223.
17. Reese T.G., Heid O., Weisskoff R.M., et. al.: Reduction of eddy-current-induced distortion in diffusion MRI using a twice-refocused spin echo. Magn Reson Med 2003; 49: pp. 177-182.
18. Grau V., Mewes A.U., Alcaniz M., et. al.: Improved watershed transform for medical image segmentation using prior information. IEEE Trans Med Imaging 2004; 23: pp. 447-458.
19. Weisenfeld N.I., Warfield S.K.: Automatic segmentation of newborn brain MRI. Neuroimage 2009; 47: pp. 564-572.
20. Ruiz-Alzola J., Westin C.F., Warfield S.K., et. al.: Nonrigid registration of 3D tensor medical data. Med Image Anal 2002; 6: pp. 143-161.
21. Douek P., Turner R., Pekar J., et. al.: MR color mapping of myelin fiber orientation. J Comput Assist Tomogr 1991; 15: pp. 923-929.
22. Arsigny V., Fillard P., Pennec X., et. al.: Log-Euclidean metrics for fast and simple calculus on diffusion tensors. Magn Reson Med 2006; 56: pp. 411-421.
23. Lazar M., Weinstein D.M., Tsuruda J.S., et. al.: White matter tractography using diffusion tensor deflection. Hum Brain Mapp 2003; 18: pp. 306-321.
24. Wakana S., Jiang H., Nagae-Poetscher L.M., et. al.: Fiber tract-based atlas of human white matter anatomy. Radiology 2004; 230: pp. 77-87.
25. Vos S.B., Jones D.K., Viergever M.A., et. al.: Partial volume effect as a hidden covariate in DTI analyses. Neuroimage 2011; 55: pp. 1566-1576.
26. Kubicki M., Alvarado J.L., Westin C.F., et. al.: Stochastic tractography study of Inferior Frontal Gyrus anatomical connectivity in schizophrenia. Neuroimage 2011; 55: pp. 1657-1664.
27. Powell H.W., Parker G.J., Alexander D.C., et. al.: Hemispheric asymmetries in language-related pathways: a combined functional MRI and tractography study. Neuroimage 2006; 32: pp. 388-399.
28. Basser P.J., Pierpaoli C.: Microstructural and physiological features of tissues elucidated by quantitative-diffusion-tensor MRI. J Magn Reson B 1996; 111: pp. 209-219.
29. Chung H.W., Chou M.C., Chen C.Y.: Principles and limitations of computational algorithms in clinical diffusion tensor MR tractography. AJNR Am J Neuroradiol 2011; 32: pp. 3-13.
30. Ge Y., Sealfon S.C., Speed T.P.: Some step-down procedures controlling the false discovery rate under dependence. Stat Sin 2008; 18: pp. 881-904.
31. Widjaja E, Simao G, Mahmoodabadi SZ, et al. Diffusion tensor imaging identifies changes in normal-appearing white matter within the epileptogenic zone in tuberous sclerosis complex. Epilepsy Res; 89:246–253.
32. Garaci F.G., Floris R., Bozzao A., et. al.: Increased brain apparent diffusion coefficient in tuberous sclerosis. Radiology 2004; 232: pp. 461-465.
33. Peng S.S., Lee W.T., Wang Y.H., et. al.: Cerebral diffusion tensor images in children with tuberous sclerosis: a preliminary report. Pediatr Radiol 2004; 34: pp. 387-392.
34. Luat A.F., Makki M., Chugani H.T.: Neuroimaging in tuberous sclerosis complex. Curr Opin Neurol 2007; 20: pp. 142-150.
35. Budde M.D., Xie M., Cross A.H., et. al.: Axial diffusivity is the primary correlate of axonal injury in the experimental autoimmune encephalomyelitis spinal cord: a quantitative pixelwise analysis. J Neurosci 2009; 29: pp. 2805-2813.
36. Song S.K., Yoshino J., Le T.Q., et. al.: Demyelination increases radial diffusivity in corpus callosum of mouse brain. Neuroimage 2005; 26: pp. 132-140.
37. Beaulieu C., Allen P.S.: Determinants of anisotropic water diffusion in nerves. Magn Reson Med 1994; 31: pp. 394-400.
38. Gulani V., Webb A.G., Duncan I.D., et. al.: Apparent diffusion tensor measurements in myelin-deficient rat spinal cords. Magn Reson Med 2001; 45: pp. 191-195.
39. Geschwind D.H., Levitt P.: Autism spectrum disorders: developmental disconnection syndromes. Curr Opin Neurobiol 2007; 17: pp. 103-111.
40. Karadag D., Mentzel H.J., Gullmar D., et. al.: Diffusion tensor imaging in children and adolescents with tuberous sclerosis. Pediatr Radiol 2005; 35: pp. 980-983.
41. Firat A.K., Karakas H.M., Erdem G., et. al.: Diffusion weighted MR findings of brain involvement in tuberous sclerosis. Diagn Interv Radiol 2006; 12: pp. 57-60.
42. Anderson J.S., Druzgal T.J., Froehlich A., et. al.: Decreased interhemispheric functional connectivity in autism. Cereb Cortex 2011; 21: pp. 1134-1146.
43. Jou R.J., Jackowski A.P., Papademetris X., et. al.: Diffusion tensor imaging in autism spectrum disorders: preliminary evidence of abnormal neural connectivity. Aust N Z J Psychiatry 2011; 45: pp. 153-162.
44. Lange N., Dubray M.B., Lee J.E., et. al.: Atypical diffusion tensor hemispheric asymmetry in autism. Autism Res 2010; 3: pp. 350-358.
45. Shukla D.K., Keehn B., Lincoln A.J., et. al.: White matter compromise of callosal and subcortical fiber tracts in children with autism spectrum disorder: a diffusion tensor imaging study. J Am Acad Child Adolesc Psychiatry 2010; 49: pp. 1269-1278.
46. Volpe J.J.: Neurology of the newborn.2008.SaundersPhiladelphia
47. Widjaja E., Blaser S., Miller E., et. al.: Evaluation of subcortical white matter and deep white matter tracts in malformations of cortical development. Epilepsia 2007; 48: pp. 1460-1469.
48. Le Bihan D., Poupon C., Amadon A., et. al.: Artifacts and pitfalls in diffusion MRI. J Magn Reson Imaging 2006; 24: pp. 478-488.
49. Zhang Y., Zhang J., Oishi K., et. al.: Atlas-guided tract reconstruction for automated and comprehensive examination of the white matter anatomy. Neuroimage 2010; 52: pp. 1289-1301.
50. Dauguet J., Peled S., Berezovskii V., et. al.: Comparison of fiber tracts derived from in-vivo DTI tractography with 3D histological neural tract tracer reconstruction on a macaque brain. Neuroimage 2007; 37: pp. 530-538.
51. Leergaard T.B., White N.S., de Crespigny A., et. al.: Quantitative histological validation of diffusion MRI fiber orientation distributions in the rat brain. PLoS One 2010; 5: pp. e8595.