
Rationale and Objectives
To determine whether an unenhanced low-dose image acquired during automated contrast bolus timing can be used to assess hepatic steatosis.
Materials and Methods
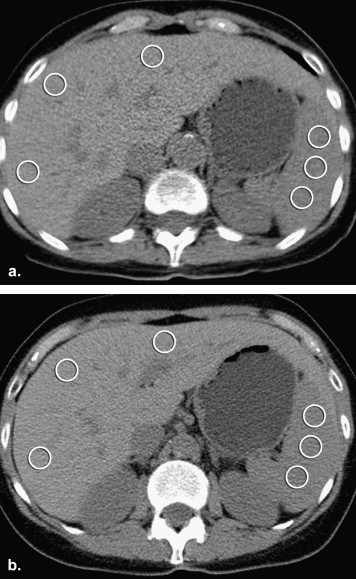
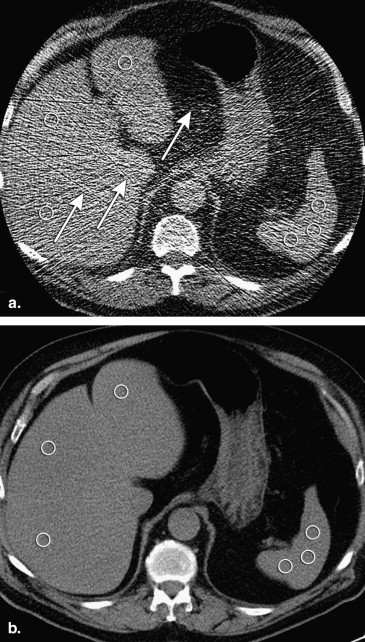
Fifty subjects (29 male, 21 female; 26–92 years; mean body mass index (BMI; 26.9) with abdominal multiphasic computed tomography were included. Abdominal diameters and circumferences were derived from anteroposterior and lateral scout radiographs. Hepatic attenuation (HA) was measured on unenhanced low-dose images (120 kV; 40 mA; 0.5 seconds’ rotation time) and corresponding unenhanced standard-dose images (120 kV, z-axis automatic tube current modulation, noise index 11.5). Noise estimates were measured in surrounding air. Pearson correlation was calculated between abdominal circumference and BMI. Mean HA assessed on low-dose images and standard-dose images was compared using a paired Student’s t -test and Bland Altman plots.
Results
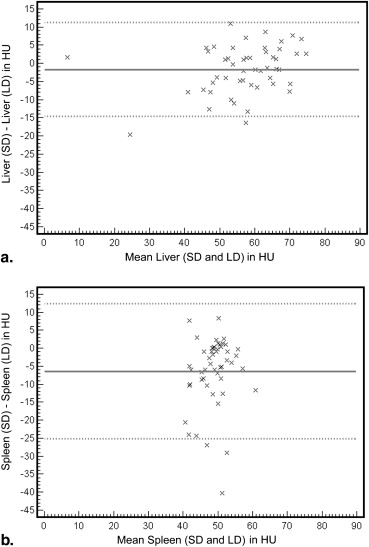
Abdominal circumference (mean, 142.8cm) correlated well with BMI ( r = 0.83). No significant difference was found for HA on low-dose images (mean +57.7 HU) compared to HA on standard-dose images (+56.0 HU) ( P = .077). Image noise (+11.5 HU) was significantly higher on low-dose images compared to image noise (+8.1 HU) on standard-dose images ( P < .05). For HA mean difference comparing low- and standard-dose images was −1.7 HU (limits of agreement: −14.6, 11.2).
Conclusion
In all subjects, hepatic attenuation can be correctly assessed on unenhanced low-dose images.
Macrovesicular hepatic steatosis is the most common cause of low-attenuating liver at computed tomography (CT) . It can have a variety of causes including obesity, hyperlipidemia, and alcohol, steroid, and chemotherapeutic drug use. Hepatic core biopsy is currently the standard method for accurate detection and quantification of macrovesicular steatosis. It is, however, invasive, associated with risk, and contributes to overall cost and morbidity. Various methods based on unenhanced as well as contrast-enhanced CT have been proposed to determine the degree of hepatic steatosis noninvasively . Although multidetector CT (MDCT) has become invaluable in the evaluation of a wide spectrum of disease processes, numerous abdominal CT protocols do not include an unenhanced phase. Unfortunately, many of the CT-based methods for detection and quantification of hepatic steatosis rely on such an unenhanced phase.
To achieve a late arterial phase on abdominal CT, a bolus monitoring scan is routinely used. This technology allows for an automated monitoring of the vascular contrast inflow phase using a series of low-dose images . When a desired level of enhancement is reached for a particular structure (eg, the suprarenal abdominal aorta), the routine diagnostic scan will be automatically initiated. In our practice, all low-dose monitoring series for arterial phase abdominal CT include a single unenhanced CT image at the level of the suprarenal abdominal aorta which also includes the liver.
Get Radiology Tree app to read full this article<
Materials and methods
Patient Population
Get Radiology Tree app to read full this article<
CT Imaging
Get Radiology Tree app to read full this article<
Get Radiology Tree app to read full this article<
Quantification of Body Habitus
Get Radiology Tree app to read full this article<
Circumference=π∗2∗((apdiameter2)2+(lateraldiameter2)2)−−−−−−−−−−−−−−−−−−−−−−−−−−−−−√ C
i
r
c
u
m
f
e
r
e
n
c
e
=
π
∗
2
∗
(
(
ap
diameter
2
)
2
+
(
lateral
diameter
2
)
2
)
Get Radiology Tree app to read full this article<
Attenuation Value Assessment
Get Radiology Tree app to read full this article<
Get Radiology Tree app to read full this article<
Get Radiology Tree app to read full this article<
Get Radiology Tree app to read full this article<
Statistical Analysis
Get Radiology Tree app to read full this article<
Get Radiology Tree app to read full this article<
Get Radiology Tree app to read full this article<
Results
Quantification of Body Habitus
Get Radiology Tree app to read full this article<
Attenuation Value Assessment
Get Radiology Tree app to read full this article<
Get Radiology Tree app to read full this article<
Get Radiology Tree app to read full this article<
Get Radiology Tree app to read full this article<
Get Radiology Tree app to read full this article<
Get Radiology Tree app to read full this article<
Table 1
Quantitative Results of Entire Study Population
Min Max Mean SD Abdominal circumference 103.0 203.6 142.8 22.6 HA unenhanced low-dose images 5.7 73.9 57.7 11.4 HA unenhanced standard-dose images 7.3 76.7 56.0 13.3 SA unenhanced low-dose images 38.0 71.3 52.0 6.0 SA unenhanced standard-dose images 29.7 55.7 45.6 6.9 CT L/S unenhanced low-dose images 0.1 1.8 1.1 0.3 CT L/S unenhanced standard-dose images 0.1 1.9 1.3 0.3 SD noise unenhanced low-dose images 4.8 39.6 11.5 6.7 SD noise unenhanced standard-dose images 4.6 18.9 8.1 2.7
CT L/S , liver-to-spleen attenuation ratio; HA, hepatic attenuation; Min, minimum; Max, maximum; SA, splenic attenuation; SD, standard deviation.
Get Radiology Tree app to read full this article<
Discussion
Get Radiology Tree app to read full this article<
Get Radiology Tree app to read full this article<
Get Radiology Tree app to read full this article<
Get Radiology Tree app to read full this article<
Get Radiology Tree app to read full this article<
Get Radiology Tree app to read full this article<
Get Radiology Tree app to read full this article<
Limitations
Get Radiology Tree app to read full this article<
Conclusion
Get Radiology Tree app to read full this article<
Acknowledgements
Get Radiology Tree app to read full this article<
References
1. Limanond P., Raman S.S., Lassman C., et. al.: Macrovesicular hepatic steatosis in living related liver donors: correlation between CT and histologic findings. Radiology 2004; 230: pp. 276-280.
2. Lee S.W., Park S.H., Kim K.W., et. al.: Unenhanced CT for assessment of macrovesicular hepatic steatosis in living liver donors: comparison of visual grading with liver attenuation index. Radiology 2007; 244: pp. 479-485.
3. Park S.H., Kim P.N., Kim K.W., et. al.: Macrovesicular hepatic steatosis in living liver donors: use of CT for quantitative and qualitative assessment. Radiology 2006; 239: pp. 105-112.
4. Qayyum A., Chen D.M., Breiman R.S., et. al.: Evaluation of diffuse liver steatosis by ultrasound, computed tomography, and magnetic resonance imaging: which modality is best?. Clin Imaging 2009; 33: pp. 110-115.
5. Kodama Y., Ng C.S., Wu T.T., et. al.: Comparison of CT methods for determining the fat content of the liver. Am J Roentgenol 2007; 188: pp. 1307-1312.
6. Speliotes E.K., Massaro J.M., Hoffmann U., et. al.: Liver fat is reproducibly measured using computed tomography in the Framingham Heart Study. J Gastroenterol Hepatol 2008; 23: pp. 894-899.
7. Iwasaki M., Takada Y., Hayashi M., et. al.: Noninvasive evaluation of graft steatosis in living donor liver transplantation. Transplantation 2004; 78: pp. 1501-1505.
8. Kim DY, Park SH, Lee SS, et al. Contrast-enhanced computed tomography for the diagnosis of fatty liver: prospective study with same-day biopsy used as the reference standard. Eur Radiol 20:359–366.
9. Silverman P.M., Brown B., Wray H., et. al.: Optimal contrast enhancement of the liver using helical (spiral) CT: value of SmartPrep. AJR Am J Roentgenol 1995; 164: pp. 1169-1171.
10. Silverman P.M., Roberts S., Tefft M.C., et. al.: Helical CT of the liver: clinical application of an automated computer technique, SmartPrep, for obtaining images with optimal contrast enhancement. AJR Am J Roentgenol 1995; 165: pp. 73-78.
11. Huda W., Ogden K.M., Khorasani M.R.: Converting dose-length product to effective dose at CT. Radiology 2008; 248: pp. 995-1003.
12. Hoang J.K., Hurwitz L.M., Boll D.T.: Optimization of tube current in coronary multidetector computed tomography angiography: assessment of a standardized method to individualize current selection based on body habitus. J Comput Assist Tomogr 2009; 33: pp. 498-504.
13. Brancatelli G.: Science to practice: Should biopsy be performed in potential liver donors when unenhanced CT shows an unacceptable degree of steatosis for transplantation?. Radiology 2006; 239: pp. 1-2.
14. Buscarini L., Fornari F., Bolondi L., et. al.: Ultrasound-guided fine-needle biopsy of focal liver lesions: techniques, diagnostic accuracy and complications. A retrospective study on 2091 biopsies. J Hepatol 1990; 11: pp. 344-348.
15. Chen Y.S., Cheng Y.F., De Villa V.H., et. al.: Evaluation of living liver donors. Transplantation 2003; 75: pp. S16-S19.
16. Stotland B.R., Lichtenstein G.R.: Liver biopsy complications and routine ultrasound. Am J Gastroenterol 1996; 91: pp. 1295-1296.
17. Jacobs J.E., Birnbaum B.A., Shapiro M.A., et. al.: Diagnostic criteria for fatty infiltration of the liver on contrast-enhanced helical CT. AJR Am J Roentgenol 1998; 171: pp. 659-664.
18. Johnston R.J., Stamm E.R., Lewin J.M., et. al.: Diagnosis of fatty infiltration of the liver on contrast enhanced CT: limitations of liver-minus-spleen attenuation difference measurements. Abdom Imaging 1998; 23: pp. 409-415.
19. Wang B., Gao Z., Zou Q., et. al.: Quantitative diagnosis of fatty liver with dual-energy CT. An experimental study in rabbits. Acta Radiol 2003; 44: pp. 92-97.
20. Kobayashi M., Suzuki M., Ikeda H., et. al.: Assessment of hepatic steatosis and hepatic tissue blood flow by xenon computed tomography in nonalcoholic steatohepatitis. Hepatol Res 2009; 39: pp. 31-39.
21. Makowiec F., Mohrle S., Neeff H., et. al.: Chemotherapy, liver injury, and postoperative complications in colorectal liver metastases. J Gastrointest Surg 2011; 15: pp. 153-164.
22. Huda W.: Dose and image quality in CT. Pediatr Radiol 2002; 32: pp. 709-713. discussion 751–704
23. Naidich D.P., Marshall C.H., Gribbin C., et. al.: Low-dose CT of the lungs: preliminary observations. Radiology 1990; 175: pp. 729-731.
24. Poletti P.A., Platon A., Rutschmann O.T., et. al.: Low-dose versus standard-dose CT protocol in patients with clinically suspected renal colic. AJR Am J Roentgenol 2007; 188: pp. 927-933.
25. Udayasankar U.K., Li J., Baumgarten D.A., et. al.: Acute abdominal pain: value of non-contrast enhanced ultra-low-dose multi-detector row CT as a substitute for abdominal radiographs. Emerg Radiol 2009; 16: pp. 61-70.
26. Kalra M.K., Prasad S., Saini S., et. al.: Clinical comparison of standard-dose and 50% reduced-dose abdominal CT: effect on image quality. AJR Am J Roentgenol 2002; 179: pp. 1101-1106.
27. Boyce CJ, Pickhardt PJ, Kim DH, et al. Hepatic steatosis (fatty liver disease) in asymptomatic adults identified by unenhanced low-dose CT. AJR Am J Roentgenol; 194:623–628.