
Rationale and Objectives
Existing density- and gradient-based automated centerline-extraction algorithms fail in severely diseased or occluded arterial segments for the generation of curved planar reformations (CPRs). We aimed to quantitatively and qualitatively assess the precision of a knowledge-based centerline-extraction algorithm in patients with occluded femoro-popliteal artery (FPA).
Material and Methods
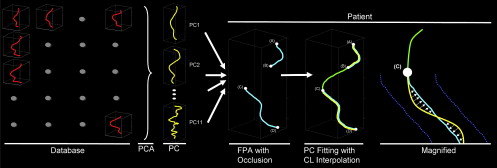
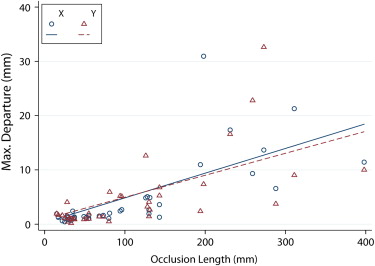
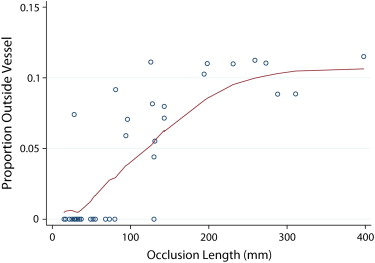
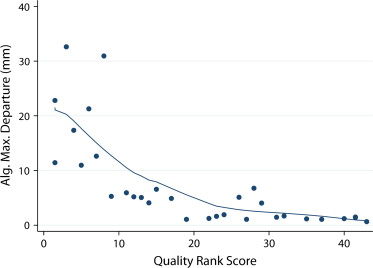
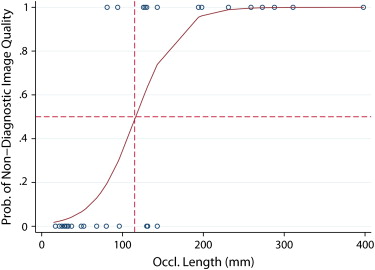
Computed tomography angiograms of 38 FPA occlusions (mean length 120 mm) were retrospectively identified. Reference centerlines were determined as the mean of eight manual expert readings. Each occlusion was also interpolated using a new knowledge-based algorithm (partial vector space projection [PVSP]), which uses shape information extracted from a separate database of 30 nondiseased FPAs. Precision of PVSP was quantified as the maximum departure error (MDE) from the standard of reference and the proportion of the interpolated centerlines remaining within an assumed vessel radius of 3 mm. Multiple regression method was used to determine the factors predicting the precision of the algorithm. CPR quality was independently assigned by two readers.
Results
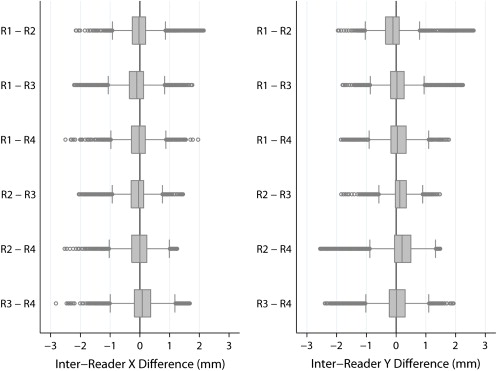
The mean MDE (in mm) for occlusion lengths of <50 mm, 50–100 mm, 100–200 mm, and >200 mm was 0.95, 1.19, 1.40, and 2.25, for manual readings and 1.68, 2.90, 9.43, and 19.95 for PVSP, respectively. MDEs of the algorithm were completely contained within 3 mm of the assumed vessel radius in 20 of 38 occlusions. CPR quality was rated diagnostic by both readers in 23 of 38 occlusions.
Conclusion
Shape-based centerline extraction of FPA occlusions in lower extremity CTA is feasible, and independent from local density and gradient information. PVSP centerline extraction allows interpolation of occlusions up to 100 mm within the variability of manually derived centerlines.
In lower extremity computed tomography angiography (CTA), cross-sectional viewing of diseased arterial segments is frequently required for visual assessment of the arterial flow channels . Longitudinal cross sections along the arterial centerlines—so called curved planar reformations (CPR) —are routinely reconstructed to complement the three-dimensional visualization methods like volume rendering or maximum intensity projection.
State-of-the-art postprocessing workstations facilitate the generation of CPRs by providing semiautomated centerline extraction methods . These algorithms, which ultimately exploit the density and gradient information within the CT datasets, generally work well in normal or minimally diseased vessels but consistently fail in the clinically relevant segments that are severely diseased or occluded. Time-consuming manual centerline extraction is then required before CPRs can be generated and the composition and length of an arterial occlusion be analyzed for treatment planning . A recently proposed knowledge-based approach to this problem (Partial Vector Space Projection [PVSP]) uses vascular shape information rather than CT density values to automatically interpolate centerlines through simulated arterial occlusions in patients with normal femoro-popliteal arteries (FPA).
Get Radiology Tree app to read full this article<
Material and methods
Patients and Image Acquisition Parameters
Get Radiology Tree app to read full this article<
Get Radiology Tree app to read full this article<
Table 1
Femoro-popliteal Artery Occlusion Lengths
Fontaine Occlusion Length Occlusions Right Left IIA IIB III IV NI ≤3 cm 7 3 4 5 2 0 0 0 3–5 cm 7 4 3 6 0 0 0 1 5–10 cm 9 3 6 4 1 0 1 3 15–20 cm 2 0 2 1 1 0 0 0 ≥20 cm 3 2 4 2 2 2 0 0 Total 38 17 21 21 8 3 1 5
NI: no information available.
The occlusion lengths are shown along with the Fontaine classification method for 38 occlusions in 24 patients with peripheral arterial occlusive disease.
Get Radiology Tree app to read full this article<
Get Radiology Tree app to read full this article<
Automated Centerline Extraction of Nonoccluded Vascular Segments
Get Radiology Tree app to read full this article<
Get Radiology Tree app to read full this article<
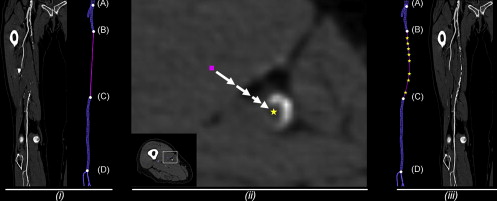
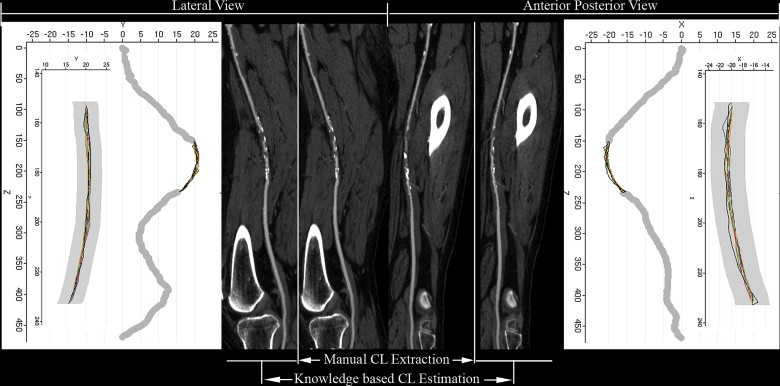
Manual Centerline Extraction of Occluded Vascular Segments (Reference Standard)
Get Radiology Tree app to read full this article<
Knowledge-based Centerline Estimation of Occluded Vascular Segments
Get Radiology Tree app to read full this article<
Get Radiology Tree app to read full this article<
Generation of CPR Images
Get Radiology Tree app to read full this article<
Analysis
Standard of Reference: Manual Centerline Extraction
Get Radiology Tree app to read full this article<
Quantification of Error between Automated Centerline Interpolation and Reference Standard
Get Radiology Tree app to read full this article<
Qualitative Analysis of CPRs derived from Automated Centerline Interpolation
Get Radiology Tree app to read full this article<
Get Radiology Tree app to read full this article<
Statistical Analysis
Get Radiology Tree app to read full this article<
Get Radiology Tree app to read full this article<
Get Radiology Tree app to read full this article<
Get Radiology Tree app to read full this article<
Results
Reference Standard: Manual Centerline Extraction by Expert Readers
Get Radiology Tree app to read full this article<
Get Radiology Tree app to read full this article<
Quantification of Error between Automated Centerline Interpolation and Standard of Reference
Get Radiology Tree app to read full this article<
Get Radiology Tree app to read full this article<
Get Radiology Tree app to read full this article<
Get Radiology Tree app to read full this article<
Get Radiology Tree app to read full this article<
Qualitative Analysis of CPRs derived from Automated Centerline Interpolation
Get Radiology Tree app to read full this article<
Get Radiology Tree app to read full this article<
Get Radiology Tree app to read full this article<
Discussion
Get Radiology Tree app to read full this article<
Get Radiology Tree app to read full this article<
Get Radiology Tree app to read full this article<
Get Radiology Tree app to read full this article<
Get Radiology Tree app to read full this article<
Get Radiology Tree app to read full this article<
Get Radiology Tree app to read full this article<
Get Radiology Tree app to read full this article<
Get Radiology Tree app to read full this article<
References
1. Catalano C., Fraioli F., Laghi A., et. al.: Infrarenal aortic and lower-extremity arterial disease: diagnostic performance of multi-detector row CT angiography. Radiology 2004; 231: pp. 555-563.
2. Fleischmann D., Hallett R.L., Rubin G.D.: CT angiography of peripheral arterial disease. J Vasc Interv Radiol 2006; 17: pp. 3-26.
3. Martin M.L., Tay K.H., Flak B., et. al.: Multidetector CT angiography of the aortoiliac system and lower extremities: a prospective comparison with digital subtraction angiography. AJR Am J Roentgenol 2003; 180: pp. 1085-1091.
4. Ofer A., Nitecki S.S., Linn S., et. al.: Multidetector CT angiography of peripheral vascular disease: a prospective comparison with intraarterial digital subtraction angiography. AJR Am J Roentgenol 2003; 180: pp. 719-724.
5. Portugaller H.R., Schoellnast H., Hausegger K.A., et. al.: Multislice spiral CT angiography in peripheral arterial occlusive disease: a valuable tool in detecting significant arterial lumen narrowing?. Eur Radiol 2004; 14: pp. 1681-1687.
6. Rubin G.D., Schmidt A.J., Logan L.J., et. al.: Multi-detector row CT angiography of lower extremity arterial inflow and runoff: initial experience. Radiology 2001; 221: pp. 146-158.
7. Raman R., Napel S., Beaulieu C.F., et. al.: Automated generation of curved planar reformations from volume data: method and evaluation. Radiology 2002; 223: pp. 275-280.
8. Roos J.E., Fleischmann D., Koechl A., et. al.: Multipath curved planar reformation of the peripheral arterial tree in CT angiography. Radiology 2007; 244: pp. 281-290.
9. La Cruz A., Straka M., Koechl A., et. al.: Non-linear model fitting to parameterize diseased blood vessels.IEEE Visualisation.2004.IEEE Computer SocietyAustin, TX:pp. 393-400.
10. Visser K., Kock M.C.J.M., Kuntz K.M., et. al.: Cost-effectiveness targets for multi-detector row CT angiography in the work-up of patients with intermittent claudication. Radiology 2003; 227: pp. 647-656.
11. Rakshe T., Fleischmann D., Rosenberg J., et. al.: Knowledge-based interpolation of curves: application to femoropopliteal arterial centerline restoration. Med Image Anal 2007; 11: pp. 157-168.
12. Kanitsar A., Fleischmann D., Wegenkittl R., et. al.: CPR - curved planar reformation.IEEE Visualization.2002.IEEE Computer SocietyBoston:pp. 37-44.
13. Sandgren T., Sonesson B., Ahlgren A.R., et. al.: Factors predicting the diameter of the popliteal artery in healthy humans. J Vasc Surg 1998; 28: pp. 284-289.