
Rationale and Objectives
To retrospectively analyze the significance of 3.0-T contrast-enhanced (CE) magnetic resonance angiography (MRA) with calf compression in the lower limbs of diabetic patients with peripheral vascular disease.
Materials and Methods
Sixty-one type 2 diabetes patients underwent both MRA and digital subtraction angiography (DSA) within 1 week. The patients were divided into two groups: one with (pressure) and one without (conventional) calf compression during MRA. Two radiologists evaluated the quality of MRA images and compared the two groups. Cohen’s kappa statistic was used to determine the concordance between MRA and DSA.
Results
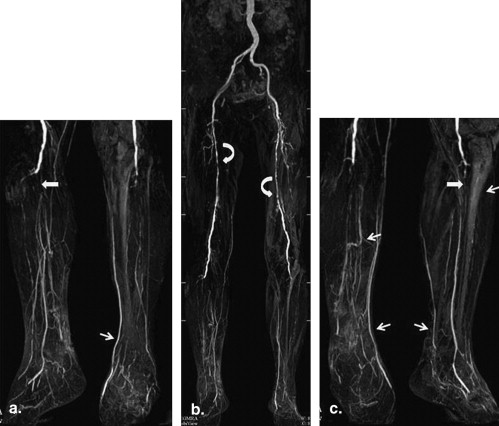
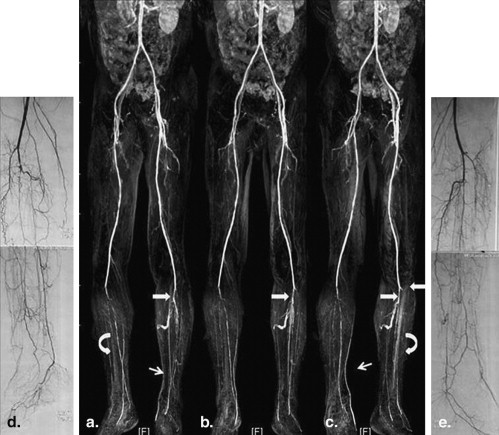
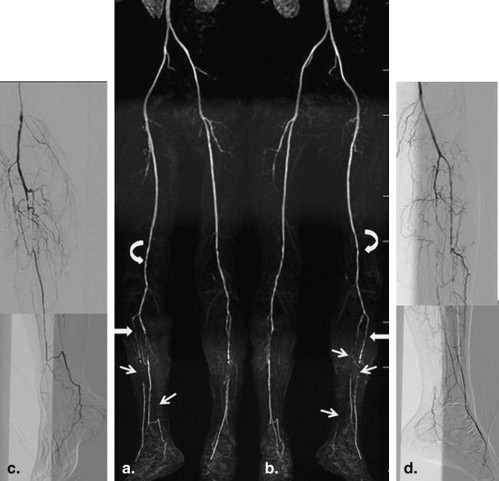
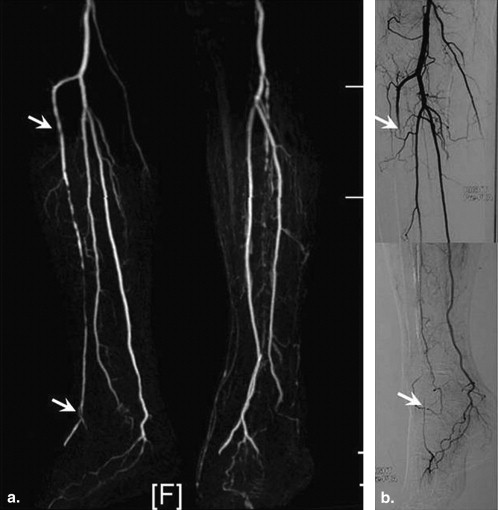
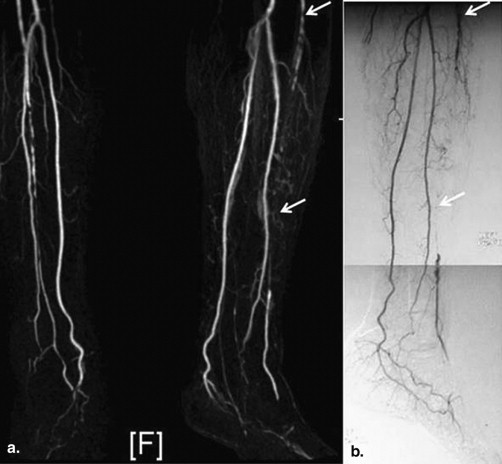
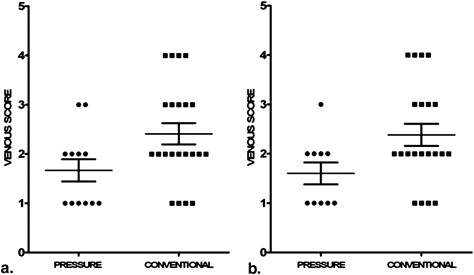
Image quality in the calf and foot was better in the group with calf pressure than the conventional group without applied pressure ( P = .001 [calf], 0.008 [foot]). Significantly more runoff vessels in the calf were detected with MRA than with DSA ( P = .0043 [conventional], 0.0031 [pressure]). The kappa values were 0.928 in the conventional group and 0.979 in the pressure group, but in the conventional group, the diagnostic accuracy of CE-MRA was lower than that of DSA ( P = .002). Diagnostic accuracy in the pressure group was significantly higher than that in the conventional group ( P = .009). The overall sensitivity and specificity for >50% stenosis or occlusion was 93.8% and 98.5%, respectively, in the conventional group and 98.7% and 99.6%, respectively, in the pressure group. With calf compression, venous overlap ( P = .0396, .0425) and deep vein overlap ( P = .022, .022) were significantly reduced in the leg and foot.
Conclusion
Calf compression with 3.0-T CE-MRA was convenient and practical and could improve image quality and diagnostic accuracy in diabetic patients with peripheral vascular disease by reducing venous overlap.
The evolution of magnetic resonance angiography (MRA) has been dramatic. MRA has played a major role in treatment planning and follow-up . The higher signal-to-noise ratio (SNR) offered by the introduction of the 3.0-T magnetic resonance (MR) system into clinical practice has been confirmed in several studies. In our opinion, 3.0-T contrast-enhanced (CE), four-station, bolus-chase MRA still has limitations in depicting lower extremity and runoff vessels in diabetic patients with peripheral vascular disease, particularly in the calf and foot, because of venous overlap.
The risk of developing critical limb ischemia is 11 times higher for patients with diabetes than for those without . Diabetic peripheral vascular disease preferentially involves arteries below the knee, with late involvement of the pedal arteries, and commonly presents as a diffuse, severe, bilateral disease that affects the proximal vessels . A clinical assessment of the arterial tree should include the distal vessel; this assessment may be used as a preoperative preparation for arterial bypass grafts.
Get Radiology Tree app to read full this article<
Get Radiology Tree app to read full this article<
Materials and methods
Patients
Get Radiology Tree app to read full this article<
Table 1
Detailed Conditions of Patients
Convention Pressure Numbers (male) 30 (20) 31 (17) Average age (y) 72.48 ± 6.61; 58–85 69.67 ± 8.59; 50–83 Duration of diabetes (y) 11.71 ± 6.60; 4–28 11.47 ± 5.49; 0.1–20 Symptom Lower limb coldness, numbness 26 29 Intermittent claudication 4 8 Rest pain 7 6 Sign Lower skin temperature 24 27 Dorsalis pedis pulse disappeared 20 23 Black toe skin 3 2 Infection 1 1 Ulcers, gangrene 2 2 Renal complications Phase III kidney disease 1 2 GFR <35 mL/min 4 4 Supplementary examination ABI 0.66 ± 0.22 0.64 ± 0.16 Transcutaneous oxygen pressure 19.95 ± 13.05 18.55 ± 12.05 FPG (mmol/L) 8.91 (4.08–19.85) 8.23 (5.30–17.97) HbA1c (mmol/L) 13.11 (7.10–24.00) 14.83 (7.03–25.00) Risk factors Heart disease 14 10 Hypertension (y) 11.25 ± 6.67; 4–28 14.29 ± 10.98; 0.1–42 Hyperlipidemia 15 13 Smoking history (y) 21.43 ± 9.07; 13–40 32.17 ± 7.76; 20–40 Treatment history Oral medication 7 3 Insulin 15 18 Drugs combined with insulin 8 10 Surgical treatment 1 (amputated toe) 2 Intervention 2 3
ABI, ankle-brachial index; FPG, fasting plasma glucose; GFR, glomerular filtration rate.
Continuous data using mean ± standard deviation. ABI recorded the results of body lesions, which were recorded 0 as not detected.
Get Radiology Tree app to read full this article<
Get Radiology Tree app to read full this article<
MR Imaging
Get Radiology Tree app to read full this article<
Get Radiology Tree app to read full this article<
Table 2
Contrast Agent Injection Process in Lower Extremity Vascular Imaging
Order Drugs Order Speed (mL/s) Dose (mL) 1 0.9% saline A 2.5 20 2 Magnevist B 2.5 20 B 2.0 20 3 0.9% saline C 2.5 20
Get Radiology Tree app to read full this article<
Get Radiology Tree app to read full this article<
Specific Steps
Get Radiology Tree app to read full this article<
Table 3
Imaging Parameters in Lower Extremity MRA at 3.0T Phillips
Imaging Parameter Abdomen Pelvic Upper Leg Lower Leg Repetition time (ms) 3.4 3.5 3.6 4.3 Echo time (ms) 1.13 1.23 17.2 1.56 Stacks slices 51 57 64 111 FOV (mm) FH/RL/AP 375/325/102 375/321/103 375/321/90 450/267/354 Dynamic scan time (s) 10.8 13.9 17.7 01:03.8 ACQ matrix m∗p (mm) 204/158 304/177 304/199 428/336 ACQ voxel mps (mm) 1.84/2.05/4.00 1.23/1.81/3.60 1.23/1.61/2.80 0.88/0.95/1.80 REC voxel size (mm) 0.73/0.74/2.00 0.73/0.74/1.80 0.73/0.74/1.40 0.73/0.73/0.90 Scan percentage (%) 89.9 68.1 76.5 92.3 CE-angio profile order Rev-linear Linear Centra Centra
ACQ, acquisition; AP, anteroposterior; CE, contrast enhanced; FH, foot-head; FOV, field of view; REC, reconstructed; RL, right-left.
All flap angles 20°; reconstruction mode real time; slice thickness 6 mm.
Get Radiology Tree app to read full this article<
Get Radiology Tree app to read full this article<
Get Radiology Tree app to read full this article<
DSA
Get Radiology Tree app to read full this article<
Image Analysis
Get Radiology Tree app to read full this article<
Get Radiology Tree app to read full this article<
Get Radiology Tree app to read full this article<
Statistical Evaluation
Get Radiology Tree app to read full this article<
Results
Get Radiology Tree app to read full this article<
Image Quality
Get Radiology Tree app to read full this article<
Get Radiology Tree app to read full this article<
Get Radiology Tree app to read full this article<
Get Radiology Tree app to read full this article<
Grade of Stenosis
Get Radiology Tree app to read full this article<
Table 4
Cohen’s Kappa and McNemar: Compared MRA with DSA
Locations Conventional Group >50% Stenosis or Occlusion Kappa Value_P_ Value Sensitivity Specificity Both Neither Only MRA Only DSA Total Numbers Abdomen and pelvis 2 208 0 0 210 1.000 1.000 100% 100% Thigh 29 88 3 0 120 .934 .250 90.6% 100% Calf 93 137 0 10 240 .914 .002 90.3% 100% Foot 26 90 4 0 120 .907 .125 100% 95.7% Total 150 453 7 10 630 .928 .629 93.8% 98.5%
Locations Pressure Group >50% Stenosis or Occlusion Kappa Value_P_ Value Sensitivity Specificity Both Neither Only MRA Only DSA Total Numbers Abdomen and pelvis 3 214 0 0 217 1.000 1.000 100% 100% Thigh 27 95 0 2 124 .954 .500 93.1% 100% Calf 90 157 1 0 248 .991 1.000 100% 99.4% Foot 31 91 2 0 124 .958 .500 100% 97.8% Total 151 495 3 2 651 .979 1.000 98.7% 99.6%
DSA, digital subtraction angiography; MRA, magnetic resonance angiography.
Get Radiology Tree app to read full this article<
Venous Overlap
Get Radiology Tree app to read full this article<
Get Radiology Tree app to read full this article<
Discussion
Theoretical Basis of Pressure MRA in Lower Leg Extremity
Get Radiology Tree app to read full this article<
Get Radiology Tree app to read full this article<
MRA image Quality of Lower Limb
Get Radiology Tree app to read full this article<
Get Radiology Tree app to read full this article<
Get Radiology Tree app to read full this article<
MRA History and Innovation
Get Radiology Tree app to read full this article<
Get Radiology Tree app to read full this article<
Get Radiology Tree app to read full this article<
Limitation of this Research
Get Radiology Tree app to read full this article<
Get Radiology Tree app to read full this article<
Conclusion
Get Radiology Tree app to read full this article<
Get Radiology Tree app to read full this article<
References
1. Lakshminarayan R., Simpson J.O., Ettles D.F.: Magnetic resonance angiography: current status in the planning and follow-up of endovascular treatment in lower-limb arterial disease. Cardiovasc Intervent Radiol 2009; 32: pp. 397-405.
2. Westenberg J.J., van der Geest R.J., Wasser M.N., et. al.: Vessel diameter measurements in gadolinium contrast-enhanced three-dimensional MRA of peripheral arteries. Magn Reson Imaging 2000; 18: pp. 13-22.
3. Foo T.K., Ho V.B., Hood M.N., et. al.: High-spatial-resolution multistation MR imaging of lower-extremity peripheral vasculature with segmented volume acquisition: feasibility study. Radiology 2001; 219: pp. 835-841.
4. Alexandrescu V.A., Hubermont G., Philips Y., et. al.: Selective primary angioplasty following an angiosome model of reperfusion in the treatment of Wagner 1-4 diabetic foot lesions: practice in a multidisciplinary diabetic limb service. J Endovasc Ther 2008; 15: pp. 580-593.
5. Vogt F.M., Ajaj W., Hunold P., et. al.: Venous compression at high-spatial resolution three-dimensional MR angiography of peripheral arteries. Radiology 2004; 233: pp. 913-920.
6. Bilecen D., Schulte A.C., Bongartz G., et. al.: Infragenual cuff-compression reduces venous contamination in contrast-enhanced MR angiography of the calf. J Magn Reson Imaging 2004; 20: pp. 347-351.
7. Zhang H.L., Ho B.Y., Chao M., et. al.: Decreased venous contamination on 3D gadolinium-enhanced bolus chase peripheral MR angiography using thigh compression. Am J Roentgenol 2004; 183: pp. 1041-1047.
8. Kreitner K.F., Kalden P., Neufang A., et. al.: Diabetes and peripheral arterial occlusive disease: prospective comparison of contrast-enhanced three-dimensional MR angiography with conventional digital subtraction angiography. Am J Roentgenol 2000; 174: pp. 171-179.
9. Koenigkam-Santos M., Sharma P., Kalb B., et. al.: Lower extremities magnetic resonance angiography with blood pressure cuff compression: quantitative dynamic analysis. J Magnet Res Imaging 2009; 29: pp. 1450-1456.
10. Andreisek G., Pfammatter T., Gospfert K., et. al.: Peripheral arteries in diabetic patients: standard bolus-chase and time-resolved MR angiography. Radiology 2007; 242: pp. 610-620.
11. Lapeyre M., Kobeiter H., Desgranges P., et. al.: Assessment of critical limb ischemia in patients with diabetes: comparison of MR angiography and digital subtraction angiography. Am J Roentgenol AJR 2005; 185: pp. 1641-1650.
12. Jeffrey H., Maki J.H., Wilson G.J., et. al.: Utilizing SENSE to achieve lower station sub-millimeter isotropic resolution and minimal venous enhancement in peripheral MR angiography. J Magn Reson Imaging 2002; 15: pp. 484-491.
13. Berg F., Bangard C., Bovenschulte H., et. al.: Feasibility of peripheral contrast-enhanced magnetic resonance angiography at 3.0 Tesla with a hybrid technique comparison with digital subtraction angiography. Invest Radiol 2008; 43: pp. 642-649.
14. Prince M.R., Chabra S.G., Watts R., et. al.: Contrast material travel times in patients undergoing peripheral MR angiography. Radiology 2002; 224: pp. 55-61.
15. Korosec F.R., Frayne R., Grist T.M., et. al.: Time-resolved contrast-enhanced 3D MR angiography. Magn Reson Med 1996; 36: pp. 345-351.
16. Kalle T.V., Gerlach A., Hatopp A., et. al.: Contrast-enhanced MR angiography (CEMRA) in peripheral arterial occlusive disease (PAOD): conventional moving table technique versus hybrid technique. [in German] Rofo 2004; 176: pp. 62-69.
17. Kramer H., Michaely H.J., Matschl V., et. al.: High-resolution magnetic resonance angiography of the lower extremities with a dedicated 36-element matrix coil at 3 Tesla. Invest Radiol 2007; 42: pp. 477-483.