
Rationale and Objectives
Most lung disease is inhomogeneously distributed but diagnosed by global spirometry. Regional lung function might allow for earlier diagnosis. Dynamic two-dimensional magnetic resonance imaging (2D-MRI) can depict lung motion with high temporal resolution. We evaluated whether measurement of lung area on dynamic 2D-MRI has sufficient agreement with spirometry to allow for lung function testing of single lungs.
Material and Methods
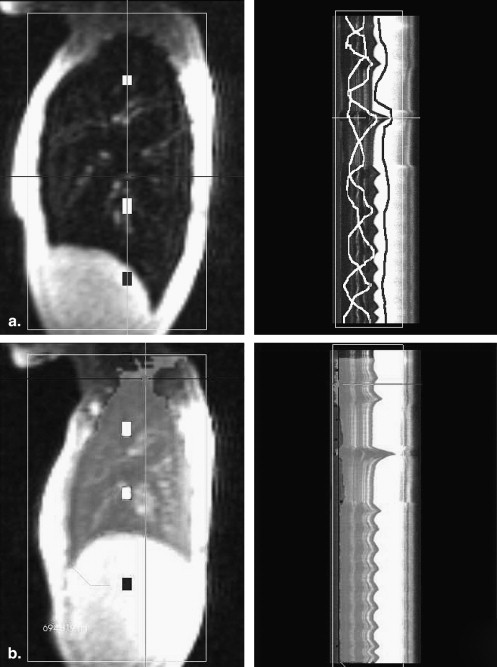
Ten healthy volunteers were examined in a 1.5 T MRI scanner with a Flash 2D-sequence (8.5 images per second, sagittal and coronal orientation) with simultaneous spirometry. The lung area was segmented semiautomatically and the area changes were compared with spirometric volume changes.
Results
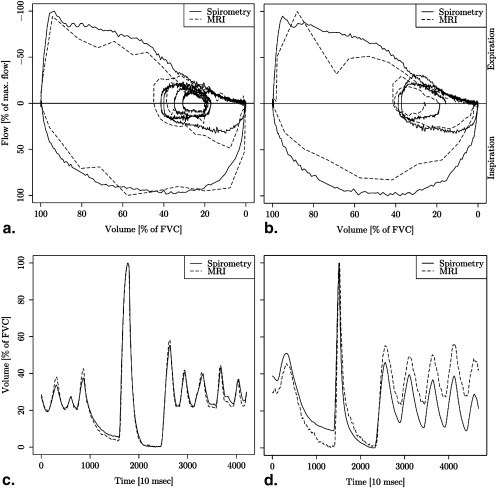
Segmentation of one time series took 191 seconds on average. Volume-time and flow-volume curves from MRI data were almost congruent with spirometric curves. Pearson correlation of MRI area with spirometry was very high (mean correlation coefficients >0.97). Bland-Altman plots showed good agreement of lung area with spirometry (95% limits of agreement below 11% in each direction). Differences between lung area and spirometry were significantly smaller for sagittal measurement of the right lung than sagittal measurement of the left lung and coronal measurement. The relative forced expiratory volume in the first second differed less than 5% between MRI and spirometry in all but one volunteer.
Conclusions
Measurement of lung area on 2D-MRI allows for functional measurement of single lungs with good agreement to spirometry. Postprocessing is fast enough for application in a clinical context and possibly provides increased sensitivity for lung functional measurement of inhomogeneously distributed lung disease.
Most pulmonary diseases alter pulmonary mechanics by changes in tissue elasticity, airflow resistance, or a combination of both. The most frequently applied test to assess such changes is spirometry. A common spirometric parameter is the volume expired in the first second of forced expiration (FEV1). It is used for grading of chronic obstructive pulmonary disease (global initiative for chronic obstructive lung disease [GOLD classification]) , monitoring of asthma , or follow-up after lung transplantation .
Because spirometry is an inherently global measurement, it can only measure the combined air flow from both lungs. In disease with regional inhomogeneous distribution favoring a single lung, pathological changes of lung function might pass unnoticed because of averaging with the less affected lung. A spirometric test for single lungs would be able to detect such changes and thus improve functional pulmonary assessments. This is relevant in single-lung transplantation, for example. Here, alteration in FEV1% is taken as indication of organ rejection–induced bronchiolitis obliterans syndrome, but changes in the transplanted lung can be covered by the remaining contralateral lung . Better sensitivity of regional functional changes might also improve treatment in chronic obstructive pulmonary disease, where the GOLD classification recently dropped the GOLD stage 0 because there was no clear evidence that these patients progress to stage 1 . Yet, a subpopulation of the patients with clinical symptoms but normal lung function does progress to Stage I and might profit from preventive treatment. A spirometric test for single lungs might be able to identify some of these patients and help to improve long-term outcome.
Get Radiology Tree app to read full this article<
Get Radiology Tree app to read full this article<
Get Radiology Tree app to read full this article<
Material and methods
Get Radiology Tree app to read full this article<
Data Acquisition
Get Radiology Tree app to read full this article<
Get Radiology Tree app to read full this article<
Get Radiology Tree app to read full this article<
Image Analysis
Get Radiology Tree app to read full this article<
Get Radiology Tree app to read full this article<
Data Analysis
Get Radiology Tree app to read full this article<
Get Radiology Tree app to read full this article<
Get Radiology Tree app to read full this article<
Get Radiology Tree app to read full this article<
Get Radiology Tree app to read full this article<
Get Radiology Tree app to read full this article<
Get Radiology Tree app to read full this article<
Get Radiology Tree app to read full this article<
Results
Get Radiology Tree app to read full this article<
Get Radiology Tree app to read full this article<
Get Radiology Tree app to read full this article<
Get Radiology Tree app to read full this article<
Table 1
Product Moment Correlation Coefficients of Magnetic Resonance Imaging Area Changes with Spirometric Volume Changes for Sagittal and Coronal Image Orientation of the Left and Right Lung
Volunteer Right Sagittal Left Sagittal Right Coronal Left Coronal 01 0.99 1.00 0.97 0.98 02 1.00 1.00 1.00 0.99 03 0.98 0.99 0.99 0.98 04 0.99 0.99 0.99 0.98 05 0.99 0.99 0.98 0.98 06 0.97 0.96 0.86 0.84 07 0.99 0.98 1.00 1.00 08 0.99 0.99 0.98 0.99 09 0.99 0.98 0.99 0.99 10 0.97 0.97 1.00 0.99 Mean (SD) 0.99 (0.01) 0.98 (0.01) 0.98 (0.04) 0.97 (0.05)
The large correlation coefficients show that the respiratory volume changes are well captured by measurement of the lung area on dynamic two-dimensional magnetic resonance imaging.
Get Radiology Tree app to read full this article<
Get Radiology Tree app to read full this article<
![Figure 3, Bland Altman plots of both lungs for sagittal (upper row) and coronal (lower row) measurements. The solid line indicates the mean difference between spirometric and magnetic resonance imaging (MRI)-derived volumes. The dashed lines show the 95% limits of agreement interval (mean ± 1.96 ∗ SD [differences]). The figure shows that there is no large systematic difference between the two methods and that agreement is better for sagittal than for coronal measurement (width of the 95% limits of agreement interval. The larger differences for smaller lung volumes are probably from an artifact (see Discussion). For purpose of clarity, only every 20th data point was plotted. FVC = forced vital capacity.](https://storage.googleapis.com/dl.dentistrykey.com/clinical/LungFunctionMeasurementofSingleLungsbyLungAreaSegmentationon2DDynamicMRI/2_1s20S1076633209006345.jpg)
Get Radiology Tree app to read full this article<
Get Radiology Tree app to read full this article<
Table 2
FEV1% Calculated from Spirometric and MRI Measurement for Sagittal and Coronal Imaging of Both Lungs (the Values for Spir and MRI are Rounded, the Values for Diff are Calculated from the Original Data and are Rounded to the First Decimal)
Sagittal Right Sagittal Left Coronal Vol. Spir MRI Diff Spir MRI Diff Spir MRI R Diff R MRI L Diff L 01 79 78 1.3 81 77 3.1 78 72 6.4 70 8.6 02 82 79 2.6 82 83 0.3 80 83 3.2 80 0.3 03 86 89 2.8 82 81 0.8 84 85 0.5 84 0.2 04 76 73 2.5 75 74 1.5 74 76 1.1 75 0.1 05 73 72 0.8 73 73 0.4 73 78 4.7 77 3.4 06 75 71 4.7 75 68 7.7 74 74 0 67 6.3 07 80 79 0.7 77 81 3.4 80 76 4.4 82 2 08 69 70 0.2 69 65 3.7 69 84 14.4 69 1 09 73 65 8.4 73 73 0.4 71 75 4.4 73 2.1 10 68 68 0.6 68 72 4.6 68 65 3.1 64 4.5 Mean (SD) 2.45 (2.5) 2.59 (2.39) 4.2 (4.1) 2.84 (2.88)
FEV1%, first second of forced expiration; Vol., volunteer; Spir, spirometric FEV1%; MRI, FEV1% as determined from magnetic resonance imaging; Diff, Spir – MRI; R and L, left and right lung.
Get Radiology Tree app to read full this article<
Get Radiology Tree app to read full this article<
Discussion
Get Radiology Tree app to read full this article<
Get Radiology Tree app to read full this article<
Get Radiology Tree app to read full this article<
Get Radiology Tree app to read full this article<
Get Radiology Tree app to read full this article<
Get Radiology Tree app to read full this article<
Get Radiology Tree app to read full this article<
Get Radiology Tree app to read full this article<
Conclusion
Get Radiology Tree app to read full this article<
References
1. Rabe K.F., Hurd S., Anzueto A., et. al.: Global strategy for the diagnosis, management, and prevention of chronic obstructive pulmonary disease: GOLD executive summary. Am J Respir Crit Care Med 2007; 176: pp. 532-555.
2. GINA: Global strategy for asthma management and prevention: GINA executive summary. Eur Respir J 2008; 31: pp. 143-178.
3. Ouwens J.P., van der Bij W., van der Mark T.W., et. al.: The value of ventilation scintigraphy after single lung transplantation. J Heart Lung Transplant 2004; 23: pp. 115-121.
4. Al-Githmi I., Batawil N., Shigemura N., et. al.: Bronchiolitis obliterans following lung transplantation. Eur J Cardiothorac Surg 2006; 30: pp. 846-851.
5. Gamsu G., Shames D.M., McMahon J., et. al.: Radiographically determined lung volumes at full inspiration and during dynamic forced expiration in normal subjects. Invest Radiol 1975; 10: pp. 100-108.
6. Cohen E., Mier A., Heywood P., et. al.: Diaphragmatic movement in hemiplegic patients measured by ultrasonography. Thorax 1994; 49: pp. 890-895.
7. Houston J.G., Fleet M., Cowan M.D., et. al.: Comparison of ultrasound with fluoroscopy in the assessment of suspected hemidiaphragmatic movement abnormality. Clin Radiol 1995; 50: pp. 95-98.
8. Qanadli S.D., Orvoen-Frija E., Lacombe P., et. al.: Estimation of gas and tissue volumes by MRI: functional approach of lung imaging. J Comp Assisted Tomogr 1999; 23: pp. 743-748.
9. Swift A.J., Woodhouse N., Fichele S., et. al.: Rapid lung volumetry using ultrafast dynamic magnetic resonance imaging during forced vital capacity maneuver—correlation with spirometry. Invest Radiol 2007; 42: pp. 37-41.
10. Plathow C., Schoebinger M., Fink C., et. al.: Evaluation of lung volumetry using dynamic three-dimensional magnetic resonance imaging. Invest Radiol 2005; 40: pp. 173-179.
11. Plathow C., Ley S., Zaporozhan J., et. al.: Assessment of reproducibility and stability of different breath-hold maneuvres by dynamic MRI: comparison between healthy adults and patients with pulmonary hypertension. Eur Radiol 2006; 16: pp. 173-179.
12. Plathow C., Fink C., Ley S., et. al.: Measurement of diaphragmatic length during the breathing cycle by dynamic MRI: comparison between healthy adults and patients with an intrathoracic tumor. Eur Radiol 2004; 14: pp. 1392-1399.
13. Fabel M., Wintersperger B.J., Dietrich O., et. al.: MRI of respiratory dynamics with 2D steady-state free-precession and 2D gradient echo sequences at 1.5 and 3 Tesla: an observer preference study. Eur Radiol 2009; 19: pp. 391-399.
14. Ley-Zaporozhan J., Ley S., Kauczor H.U.: Morphological and functional imaging in COPD with CT and MRI: present and future. Eur Radiol 2008; 18: pp. 510-521.
15. Craighero S., Promayon E., Baconnier P., et. al.: Dynamic echo-planar MR imaging of the diaphragm for a 3D dynamic analysis. Eur Radiol 2005; 15: pp. 742-748.
16. Plathow C., Ley S., Fink C., et. al.: Evaluation of chest motion and volumetry during the breathing cycle by dynamic MRI in healthy subjects: comparison with pulmonary function tests. Invest Radiol 2004; 39: pp. 202-209.
17. Plathow C., Fink C., Sandner A., et. al.: Comparison of relative forced expiratory volume of one second with dynamic magnetic resonance imaging parameters in healthy subjects and patients with lung cancer. J Magn Reson Imaging 2005; 21: pp. 212-218.
18. Tetzlaff R., Eichinger M., Schobinger M., et. al.: Semiautomatic assessment of respiratory motion in dynamic MRI—comparison with simultaneously acquired spirometry. Rofo 2008; 180: pp. 961-967.
19. Eichinger M., Puderbach M., Smith H.J., et. al.: Magnetic resonance-compatible-spirometry: principle, technical evaluation and application. Eur Respir J 2007; 30: pp. 972-979.
20. Kondo T., Kobayashi I., Taguchi Y., et. al.: An analysis of the chest wall motions using the dynamic MRI in healthy elder subjects. Tokai J Exp Clin Med 2005; 30: pp. 15-20.
21. Kondo T., Kobayashi I., Taguchi Y., et. al.: A dynamic analysis of chest wall motions with MRI in healthy young subjects. Respirology 2000; 5: pp. 19-25.
22. Wolf I., Vetter M., Wegner I., et. al.: The medical imaging interaction toolkit. Med Image Anal 2005; 9: pp. 594-604.
23. R Development Core Team. R: A language and environment for statistical computing. In. Vienna, Austria: R Foundation for Statistical Computing; 2008.
24. S original by Jim Ramsey. R port by Brian Ripley ripley@stats.ox.ac.uk. pspline: Penalized Smoothing Splines. In. R package version 1.0-12. ed; 2007.
25. Smith S.W.: Properties of convolution.The scientist and engineer’s guide to digital signal processing.1997.California Technical PublishingSan Diego, CA:pp. 136-140.
26. Bland J.M., Altman D.G.: Measuring agreement in method comparison studies. Stat Meth Med Res 1999; 8: pp. 135-160.
27. Kiryu S., Loring S.H., Mori Y., et. al.: Quantitative analysis of the velocity and synchronicity of diaphragmatic motion: dynamic MRI in different postures. Magnet Reson Imaging 2006; 24: pp. 1325-1332.