
Rationale and Objectives
Postnatal lung growth and development have primarily been evaluated from a very limited number of autopsied lungs, but it remains unclear whether alveolarization of the lung is complete during infancy and whether the conducting airways grow proportionately. The purpose of this study was to evaluate lung growth and development in vivo in infants and toddlers using multislice computed tomography.
Materials and Methods
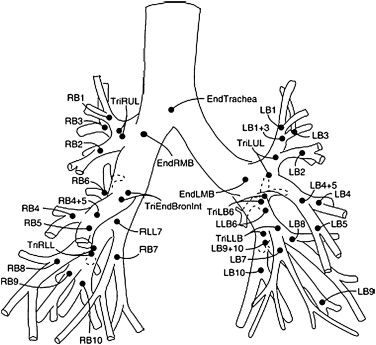
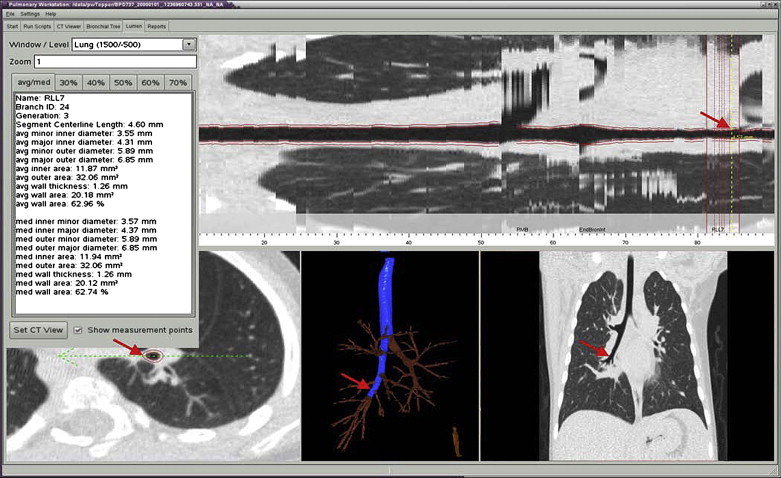
Thirty-eight subjects (14 male, 24 female) aged 17 to 142 weeks underwent low-dose volumetric high-resolution computed tomographic imaging at an inflation pressure of 20 cm H 2 O during an induced respiratory pause. Lung volume and weight were determined, as well as airway dimensions (inner and outer area and wall area) for the trachea and the next three to four generations.
Results
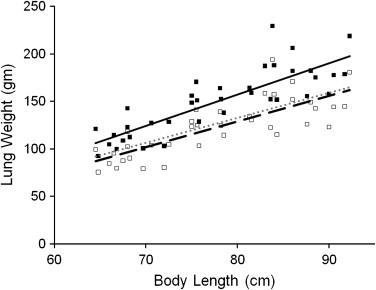
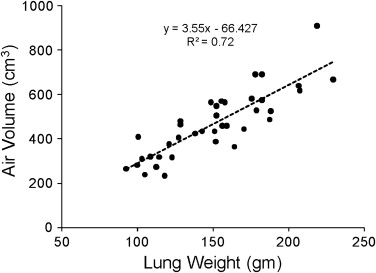
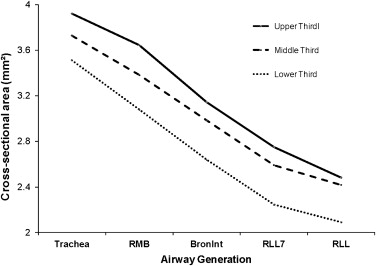
Lung volume, air volume, and tissue volume increased linearly with body length. The air and tissue components of the lung parenchyma increased at a constant rate with each other. In addition, airway caliber decreased with increasing generation from the trachea into each lobe. Airway caliber was also correlated with body length; however, there was no interaction effect between airway generation and body length on transformed airway size.
Conclusions
In vivo assessment suggests that the growth of the lung parenchyma in infants and toddlers occurred with a constant relationship between air volume and lung tissue, which is consistent with lung growth occurring primarily by the addition of alveoli rather than the expansion of alveoli. In addition, the central conducting airways grow proportionately in infants and toddlers. This information may be important for evaluating subjects with arrested lung development.
The lung undergoes significant growth and development early in life, with increases in lung volume and airway size. Increases in lung volume with somatic growth can occur by alveolarization or by expansion in size of existing alveoli. The former should produce a relatively constant relationship between the volume of air and parenchymal tissue, whereas the latter should produce a greater increase in volume relative to parenchymal tissue.
Most of our knowledge about lung structure for infants and toddlers has been derived from a very limited number of morphometric studies of autopsied lungs, which has provided conflicting results as to whether alveolarization of the lung is complete during infancy . In addition, morphometric studies have provided relatively limited data on growth of the conducting airways early in life . In contrast to assessing lung structure from autopsied lungs, in adults and cooperative older children, lung structure has been evaluated in vivo using high-resolution computed tomographic (HRCT) imaging, which can provide a quantitative assessment of the lung parenchyma, as well as airway dimensions .
Get Radiology Tree app to read full this article<
Get Radiology Tree app to read full this article<
Materials and methods
Subjects
Get Radiology Tree app to read full this article<
Table 1
Subject Demographics
Subject Length (cm) Weight (kg) Age (wk) Gender Race Reason for CT Scan 1 64.8 5 17 F Non-Caucasian Sarcoma 2 66 7.3 24 F Non-Caucasian Hearing loss 3 67.5 7.8 26 M Caucasian Scoliosis 4 68 7.3 27 M Caucasian Abnormal skull shape 5 66.5 6.4 29 M Caucasian Microtia 6 66.8 7 30 F Caucasian Hearing loss 7 64.5 8.6 31 F Non-Caucasian Hearing loss 8 68.25 8.4 32 M Non-Caucasian Macrocephalus 9 72 8.2 40 M Caucasian Hearing loss 10 75.5 12.1 43 M Caucasian Dermoid cyst 11 70.6 9.09 43 F Caucasian Hearing loss 12 68 10 45 M Caucasian Craniosynostosis 13 72.5 9.5 46 M Non-Caucasian Sarcoma 14 75.8 9.6 47 M Non-Caucasian Hearing loss 15 75 9.5 49 M Caucasian Hearing loss 16 75 10.9 50 M Caucasian Hepatoma 17 78.2 10.9 51 M Non-Caucasian Abnormal skull shape 18 75.6 10 54 F Caucasian Torticollis 19 72.5 9 61 F Caucasian Preauditory tag 20 83 10.9 66 F Caucasian Histiocytosis 21 84 11.8 73 F Non-Caucasian Dermoid cyst 22 78.5 8.2 78 F Caucasian Sarcoma 23 81.5 10.9 79 F Non-Caucasian Synostosis 24 69.7 7.7 79 F Caucasian Hearing loss 25 81.3 11.8 80 F Caucasian Thrombocytopenia 26 80.5 11.8 86 M Non-Caucasian Plagiocephaly 27 88 12.7 87 F Caucasian Retinoblastoma 28 86 14.1 91 F Caucasian Neuroblastoma 29 83.6 11.3 93 F Non-Caucasian Hearing loss 30 84.3 15.1 99 F Non-Caucasian Neuroblastoma 31 83.8 14.6 100 F Caucasian Neuroblastoma 32 87.6 10.7 103 F Caucasian Microtia 33 86 11.3 105 F Non-Caucasian Rhabdomyosarcoma 34 90.5 12.5 113 F Caucasian Hearing loss 35 90 13.2 120 F Non-Caucasian Hearing loss 36 91.7 12.5 124 F Non-Caucasian Lymphangioma 37 88.5 12.3 125 F Non-Caucasian Hearing loss 38 92.25 14.5 142 M Caucasian Club feet
CT, computed tomographic.
Get Radiology Tree app to read full this article<
High-resolution Imaging
Get Radiology Tree app to read full this article<
Get Radiology Tree app to read full this article<
Statistical Analysis
Get Radiology Tree app to read full this article<
Results
Subjects
Get Radiology Tree app to read full this article<
Lung Parenchyma
Get Radiology Tree app to read full this article<
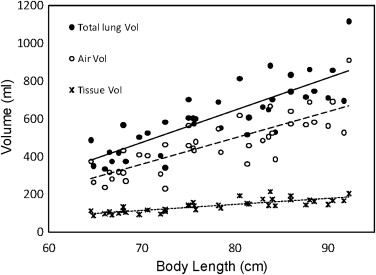
Table 2
Lung Volume and Weight Versus Body Length
Outcome Intercept SE Intercept Length (cm)P__R 2 n Total lung volume (cm 3 ) −718.62 151.47 17.07 <.0001 0.68 38 Air volume (cm 3 ) −613.40 133.23 13.90 <.0001 0.65 38 Tissue volume (cm 3 ) −105.22 29.11 3.17 <.0001 0.67 38 Lung tissue weight (g) −112.05 31.01 3.38 <.0001 0.67 38 Hounsfield units −651.94 45.49 −1.32 .0289 0.13 38
SE, standard error.
Get Radiology Tree app to read full this article<
Get Radiology Tree app to read full this article<
Get Radiology Tree app to read full this article<
Airways
Get Radiology Tree app to read full this article<
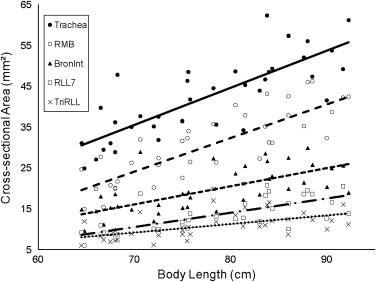
Table 3
Airway Size Versus Body Length
Airway Outcome Intercept SE Intercept Length_P_ Length_R_ 2 n Trachea Inner area (mm 2 ) −28.10 9.01 0.91 <.0001 0.63 38 Outer area (mm 2 ) −27.17 15.36 1.34 <.0001 0.56 38 Wall area (mm 2 ) 0.92 8.67 0.43 .0004 0.29 38 Outer/inner area 0.39 0.06 0.00 .007 0.19 38 RMB Inner area (mm 2 ) −33.32 7.77 0.82 <.0001 0.65 38 Outer area (mm 2 ) −48.80 13.24 1.39 <.0001 0.65 38 Wall area (mm 2 ) −15.48 6.59 0.57 <.0001 0.56 38 Outer/inner area 0.38 0.05 0.00 .0098 0.17 38 Bronint Inner area (mm 2 ) −14.80 6.34 0.44 <.0001 0.45 38 Outer area (mm 2 ) −20.75 11.14 0.81 <.0001 0.47 38 Wall area (mm 2 ) −5.95 5.53 0.36 <.0001 0.42 38 Outer/inner area 0.33 0.05 0.00 .013 0.16 38 TriRLL7 Inner area (mm 2 ) −14.03 4.62 0.35 <.0001 0.5 37 Outer area (mm 2 ) −19.61 8.43 0.65 <.0001 0.51 37 Wall area (mm 2 ) −5.58 4.41 0.30 <.0001 0.46 37 Outer/inner area 0.24 0.05 0.00 .0014 0.26 37 TriRLL Inner area (mm 2 ) −5.49 4.06 0.21 .0003 0.33 35 Outer area (mm 2 ) −7.82 7.56 0.45 <.0001 0.4 35 Wall area (mm 2 ) −2.33 4.06 0.24 <.0001 0.39 35 Outer/inner area 0.30 0.06 0.00 .1378 0.07 35
Bronint, bronchus intermedius; RMB, right main bronchus; SE, standard error.
Get Radiology Tree app to read full this article<
Get Radiology Tree app to read full this article<
Get Radiology Tree app to read full this article<
Discussion
Get Radiology Tree app to read full this article<
Get Radiology Tree app to read full this article<
Get Radiology Tree app to read full this article<
Get Radiology Tree app to read full this article<
Get Radiology Tree app to read full this article<
Get Radiology Tree app to read full this article<
Get Radiology Tree app to read full this article<
Get Radiology Tree app to read full this article<
Acknowledgments
Get Radiology Tree app to read full this article<
Get Radiology Tree app to read full this article<
References
1. Hislop A.A., Wigglesworth J.S., Desai R.: Alveolar development in the human fetus and infant. Early Hum Devel 1986; 13: pp. 1-11.
2. Thurlbeck W.M.: Post natal growth and development of the lung. Am Rev Respir Dis 1975; 111: pp. 803-844.
3. Zeltner T.B., Burri P.H.: The postnatal development and growth of the human lung. II. Morphology. Respir Physiol 1987; 67: pp. 269-282.
4. Zeltner T.B., Caduff J.H., Gehr P., et. al.: The postnatal development and growth of the human lung. I. Morphometry. Respir Physiol 1987; 67: pp. 247-267.
5. Davies G., Reid L.: Growth of the alveoli and pulmonary arteries in childhood. Thorax 1970; 25: pp. 669-681.
6. Dunnill M.S.: Postnatal growth of the lung. Thorax 1962; 17: pp. 329-333.
7. Hislop A., Muir D.C.F., Jacobsen M., et. al.: Postnatal growth and function of the pre-acinar airways. Thorax 1972; 27: pp. 265-274.
8. Horsfield K., Gordon W.I., Kemp W., et. al.: Growth of the bronchial tree in man. Thorax 1987; 42: pp. 383-388.
9. Washko G.R., Criner G.J., Mohsenifar Z., et. al.: Computed tomographic-based quantification of emphysema and correlation to pulmonary function and mechanics. Chron Obstr Pulmon Dis 2008; 5: pp. 177-186.
10. de Blic J., Tillie-Leblond I., Emond S., et. al.: High-resolution computed tomography scan and airway remodeling in children with severe asthma. J Allerg Clin Immunol 2005; 116: pp. 750-754.
11. Nakano Y., Muller N.L., King G.G., et. al.: Quantitative assessment of airway remodeling using high-resolution CT. Chest 2002; 122: pp. 275S.
12. de Jong P.A., Nakano Y., Hop W.C., et. al.: Changes in airway dimensions on computed tomography scans of children with cystic fibrosis. Am J Respir Crit Care Med 2005; 172: pp. 218-224.
13. Hislop A.A.: Lung growth and computed tomography. Eur Respir J 2003; 22: pp. 195-196.
14. de Jong P.A., Nakano Y., Lequin M.H., et. al.: Estimation of lung growth using computed tomography. Eur Respir J 2003; 22: pp. 235-238.
15. de Jong P.A., Long F.R., Wong J.C., et. al.: Computed tomographic estimation of lung dimensions throughout the growth period. Eur Respir J 2006; 27: pp. 261-267.
16. Long F.R., Williams R.S., Castile R.G.: Inspiratory and expiratory CT lung density in infants and young children. Pediatr Radiol 2005; 35: pp. 677-683.
17. Long F.R.: High-resolution CT of the lungs in infants and young children. J Thorac Imaging 2001; 16: pp. 251-258.
18. Martinez T.M., Llapur C.J., Williams T.H., et. al.: High-resolution computed tomography imaging of airway disease in infants with cystic fibrosis. Am J Respir Crit Care Med 2005; 172: pp. 1133-1138.
19. Tschirren J., Pal Gyi K., Reinhardt J.M., et. al.: Segmentation, skeletonization, and branchpoint matching—a fully automated quantitative evaluation of human intrathoracic airway trees.2002.Springer-VerlagBerlin, Germany 12–19
20. Tschirren J., McLennan G., Palagyi K., et. al.: Matching and anatomical labeling of human airway tree. IEEE Trans Med Imaging 2005; 24: pp. 1540-1547.
21. Pagano M., Gauvereau : Principles of biostatistics.2nd ed.2000.DuxburyPacific Grove, CA
22. Coppoletta J.M., Wolbach S.B.: Body length and organ weights of infants and children: a study of the body length and normal weights of the more important vital organs of the body between birth and twelve years of age. Am J Pathol 1933; 9: pp. 55-70.
23. Bucci G., Cook C.D., Barrie H.: Studies of respiratory physiology in children: total lung diffusion, diffusing capacity of pulmonary membrane, and pulmonary capillary blood volume in normal subjects from 7 to 40 years of age. J Pediatr 1961; 58: pp. 820-828.
24. Stigol L.C., Vawter G.F., Mead J.: Studies on elastic recoil of the lung in a pediatric population. Am Rev Respir Dis 1972; 105: pp. 552-563.
25. Balinotti J.E., Tiller C.J., Llapur C.J., et. al.: Growth of the lung parenchyma early in life. Am J Respir Crit Care Med 2009; 179: pp. 134-137.
26. Davis S., Jones M., Kisling J., et. al.: Density dependence of forced expiratory flows in healthy infants and toddlers. J Appl Physiol 1999; 87: pp. 1796-1801.
27. Jones M., Castile R., Davis S., et. al.: Forced expiratory flows and volumes in infants. Normative data and lung growth. Am J Respir Crit Care Med 2000; 161: pp. 353-359.
28. Hammer J., Numa A., Newth C.J.: Total lung capacity by N2 washout from high and low lung volumes in ventilated infants and children. Am J Respir Crit Care Med 1998; 158: pp. 526-531.
29. Tepper R.S., Hiatt P.W., Eigen H., et. al.: Total respiratory system compliance in asymptomatic infants with cystic fibrosis. Am Rev Respir Dis 1987; 135: pp. 1075-1079.
30. Tepper R.S., Williams T., Kisling J., et. al.: Static compliance of the respiratory system in healthy infants. Am J Respir Crit Care Med 2001; 163: pp. 91-94.
31. Brown R.H., Mitzner W., Wagner E., et. al.: Airway distension with lung inflation measured by HRCT1. Acad Radiol 2003; 10: pp. 1097-1103.
32. Shen X., Ramchandani R., Dunn B., et. al.: Effect of transpulmonary pressure on airway diameter and airway responsiveness of immature and mature rabbits. J Appl Physiol 2000; 89: pp. 1584-1590.