
Rationale and Objectives
Long-term survival after lung transplantation (LTx) is limited by bronchiolitis obliterans syndrome (BOS), defined as a sustained decline in forced expiratory volume in the first second (FEV 1 ) not explained by other causes. We assessed whether machine learning (ML) utilizing quantitative computed tomography (qCT) metrics can predict eventual development of BOS.
Materials and Methods
Paired inspiratory-expiratory CT scans of 71 patients who underwent LTx were analyzed retrospectively (BOS [ n = 41] versus non-BOS [ n = 30]), using at least two different time points. The BOS cohort experienced a reduction in FEV 1 of >10% compared to baseline FEV 1 post LTx. Multifactor analysis correlated declining FEV 1 with qCT features linked to acute inflammation or BOS onset. Student t test and ML were applied on baseline qCT features to identify lung transplant patients at baseline that eventually developed BOS.
Results
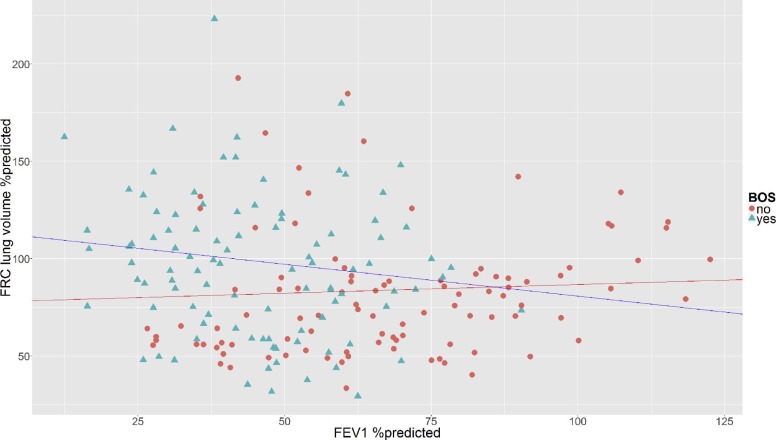
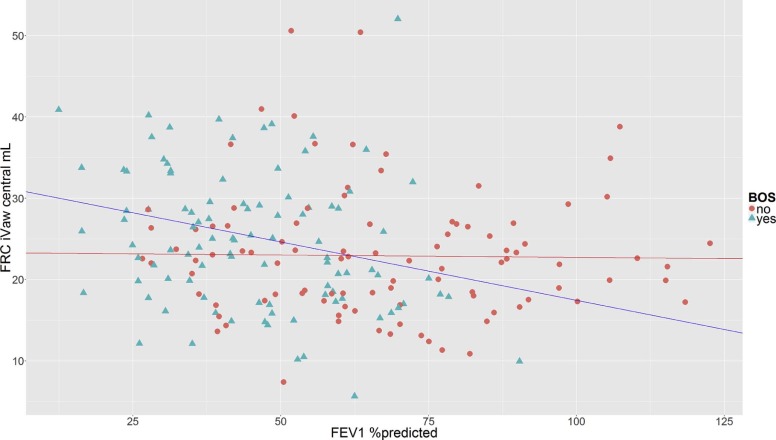
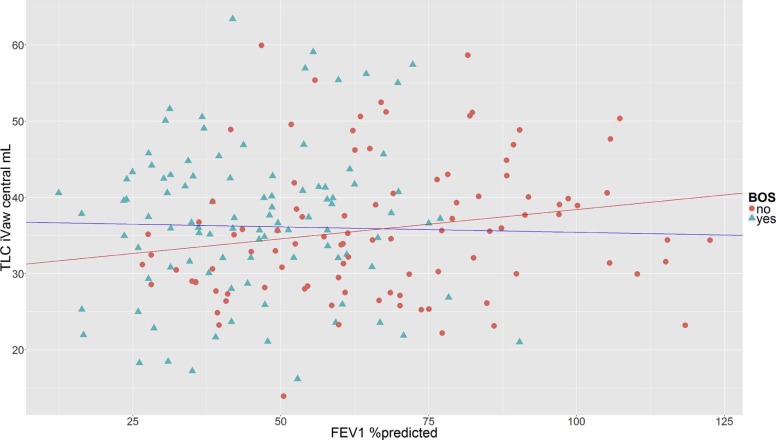
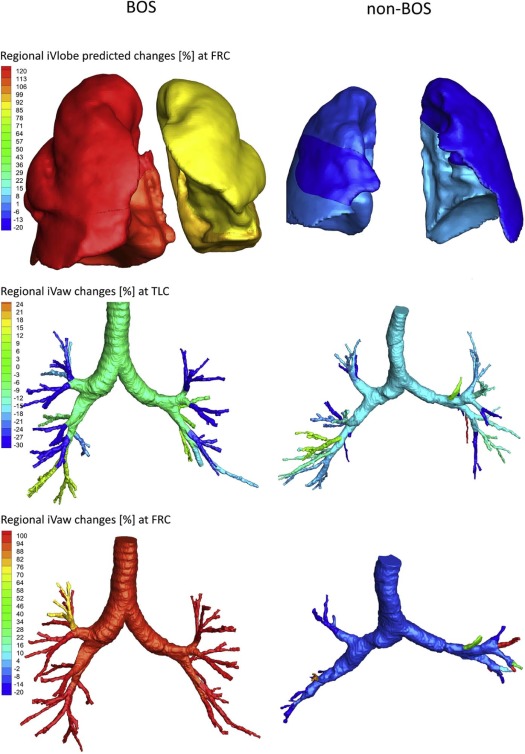
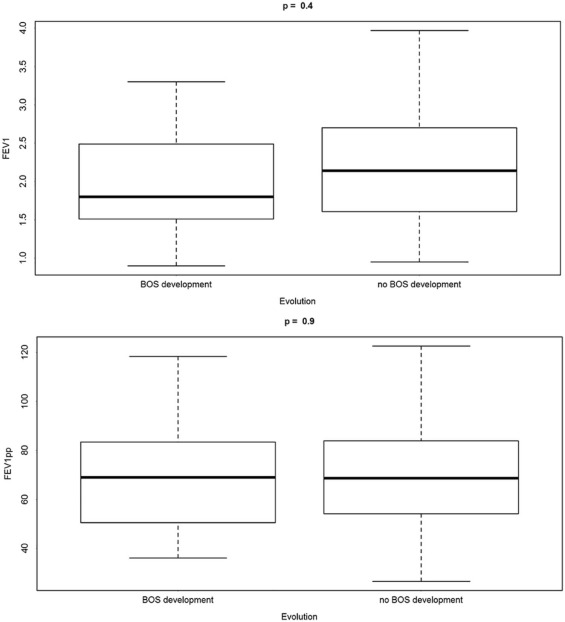
The FEV 1 decline in the BOS cohort correlated with an increase in the lung volume ( P = .027) and in the central airway volume at functional residual capacity ( P = .018), not observed in non-BOS patients, whereas the non-BOS cohort experienced a decrease in the central airway volume at total lung capacity with declining FEV 1 ( P = .039). Twenty-three baseline qCT parameters could significantly distinguish between non-BOS patients and eventual BOS developers ( P < .05), whereas no pulmonary function testing parameters could. Using ML methods (support vector machine), we could identify BOS developers at baseline with an accuracy of 85%, using only three qCT parameters.
Conclusions
ML utilizing qCT could discern distinct mechanisms driving FEV 1 decline in BOS and non-BOS LTx patients and predict eventual onset of BOS. This approach may become useful to optimize management of LTx patients.
Introduction
Lung transplantation (LTx) is an important treatment option for patients with advanced, irreversible lung disease . However, despite continued advancements in LTx techniques, long-term survival is limited by chronic lung allograft dysfunction (CLAD). The obstructive phenotype of CLAD is a form of chronic immune-mediated rejection that causes an obliterative bronchiolitis resulting in progressive airflow obstruction over time and eventual allograft failure and death . Because histopathologic confirmation of obliterative bronchiolitis is impractically obtained with surgical lung biopsy, given risks and cost, the clinically defined term bronchiolitis obliterans syndrome (BOS) was introduced . BOS is defined as a sustained decline in the forced expiratory volume in the first second (FEV 1 ) of the transplanted patient from the peak baseline post-transplant value not associated with other potential reversible causes such as pulmonary infections or pulmonary edema . Stage BOS 0-p is defined as a decline in FEV 1 of >10% from peak post-LTx FEV 1 .
The onset of BOS is associated with poor survival, with a median survival of 2.5 years after its onset . Its incidence is highest during the first 2 years after transplantation, but patients remain at risk indefinitely, and the cumulative incidence reaches more than 50% after 5 years . Although advances in LTx technique and postoperative care have resulted in improved short-term outcomes, there has been no substantial decrease in the incidence of BOS . Additionally, no effective treatments have been established yet, although there is evidence suggesting augmented immunosuppression may stabilize or cause regression of the disease if diagnosed in the early stages . Also, as BOS affects the small airways of the allograft, it may be that, by the time it is clinically diagnosed, a large proportion of the allograft airways have already been irreversibly affected. Therefore, earlier detection of BOS is of great interest because it might increase the probability of successful treatment with novel therapeutic agents in future clinical trials.
Get Radiology Tree app to read full this article<
Get Radiology Tree app to read full this article<
Materials and Methods
Study Population
Get Radiology Tree app to read full this article<
Table 1
Patient Characteristics
Study Population Total subjects 71 (41 BOS and 30 non-BOS) Gender Male: 53, female: 18 Transplant type 14 right, 17 left, 40 bilateral BOS onset 19 early onset (15 ± 9 mo after LTx), 13 late onset (56 ± 26 mo after LTx), 9 unknown Pretransplant diagnosis 26 IPF, 23 COPD, 7 CF, 5 A1AD, 10 other Number of scans per patient 3 ± 1 scans (mean ± SD), ranging from 2 to 8 Follow-up HRCT scans 4.1 ± 3.3 y (mean ± SD) after transplant, ranging from 15 d to 13 y
A1AD, alpha-1-antitrypsin deficiency; BOS, bronchiolitis obliterans syndrome; CF, cystic fibrosis; COPD, chronic obstructive pulmonary disease; HRCT, high-resolution computed tomography; LTx, lung transplantation; SD, standard deviation.
Get Radiology Tree app to read full this article<
Get Radiology Tree app to read full this article<
Get Radiology Tree app to read full this article<
Get Radiology Tree app to read full this article<
Table 2
Time to Bronchiolitis Obliterans Syndrome Onset
Type of Onset Number of Patients Median Time After Transplantation_P_ Value Early onset 19 15 ± 9 months .1354 Late onset 13 56 ± 26 months Unknown 9 Unknown
Get Radiology Tree app to read full this article<
Get Radiology Tree app to read full this article<
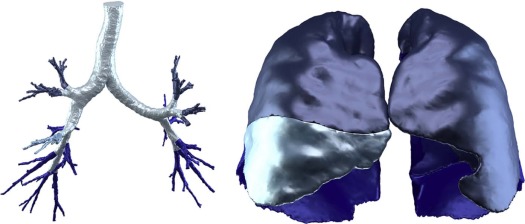
qCT Imaging Processing (with FRI)
Get Radiology Tree app to read full this article<
Get Radiology Tree app to read full this article<
Get Radiology Tree app to read full this article<
Get Radiology Tree app to read full this article<
Get Radiology Tree app to read full this article<
Statistical Analysis
Get Radiology Tree app to read full this article<
Get Radiology Tree app to read full this article<
Get Radiology Tree app to read full this article<
Results
Get Radiology Tree app to read full this article<
Table 3
Changes in FRI Parameters Related to Declines in FEV 1
FRI Parameter BOS Non-BOS_P_ Value Conditional R 2 FRC lung volume Increase No change .027 0.86 TLC iVaw central No change Decrease .039 0.89 FRC iVaw central Increase No change .018 0.70
BOS, bronchiolitis obliterans syndrome; FEV 1 , forced expiratory volume in the first second; FRC, functional residual capacity; FRI, functional respiratory imaging; iVaw, imaging airway volume; TLC, total lung capacity.
Get Radiology Tree app to read full this article<
Get Radiology Tree app to read full this article<
Get Radiology Tree app to read full this article<
Get Radiology Tree app to read full this article<
Get Radiology Tree app to read full this article<
Get Radiology Tree app to read full this article<
Table 4
Significant Baseline Predictors for BOS Development (Student t Test)
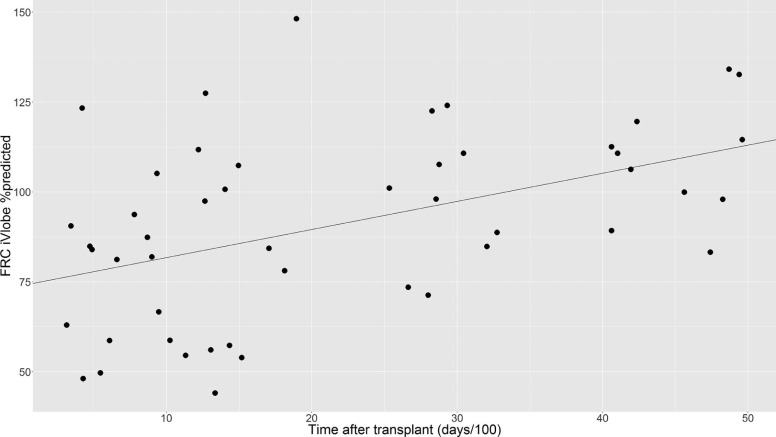
Type Level Feature Zone_P_ Value FRI FRC Lobe volume (iVlobe) RML <.0001 FRI FRC Lobe volume (iVlobe predicted) RML <.0001 FRI FRC Lobe (lung) volume (iVlobe) Right lung .001 FRI FRC Lobe volume (iVlobe) RUL .001 FRI FRC Lobe volume (iVlobe predicted) RUL .002 FRI TLC Lobe volume (iVlobe predicted) RML .009 FRI TLC Lobe volume (iVlobe) RML .009 FRI FRC Lobe volume (iVlobe) RLL .013 FRI FRC Airway volume (iVaw) LL .015 FRI FRC Airway volume (iVaw) Total .019 FRI FRC Airway volume (iVaw) LLL .021 FRI FRC Airway volume (iVaw) RLL .025 FRI FRC Lobe volume (iVlobe predicted) RLL .027 FRI FRC Airway resistance (iRaw) RUL .031 FRI FRC Airway volume (iVaw) Central .037 FRI FRC Airway volume (iVaw) Distal .040 FRI FRC Airway surface (iSaw) Total .040 FRI FRC Airway volume (iVaw) Left lung .041 FRI FRC Airway surface (iSaw) LL .043 FRI FRC Airway surface (iSaw) RLL .045 FRI FRC Airway surface (iSaw) Central .047 FRI FRC Specific airway volume (siVaw) LL .048 FRI FRC Airway resistance (iRaw) RML .049
FRC, functional residual capacity; FRI, functional respiratory imaging; iRaw, imaging airway resistance; iSaw, imaging airway surface; iVaw, imaging airway volume; iVlobe, imaging lobar volume; LL, lower lobes (right lower lobe AND left lower lobe); LLL, left lower lobe; RLL, right lower lobe; RML, right middle lobe; RUL, right upper lobe.
![Figure 7, Significant baseline qCT predictors for BOS development (Student t test). Please see Supplementary Figure S1 for individual detailed box plots. CM2, square centimeter; FRC, functional residual capacity; iRaw, imaging airway resistance; iSaw, imaging airway surface; iVaw, imaging airway volume; iVlobe, imaging lobar volume; iVlobepred, image-based lobar volume [percent predicted]; LL, lower lobes (left lower lobe + right lower lobe); LLL, left lower lobe; ML, milliliter; RE, right lung; RLL, right lower lobe; RML, right middle lobe; RUL, right upper lobe; siVaw, specific image-based airway volume; TLC, total lung capacity.](https://storage.googleapis.com/dl.dentistrykey.com/clinical/MachineLearningAlgorithmsUtilizingQuantitativeCTFeaturesMayPredictEventualOnsetofBronchiolitisObliteransSyndromeAfterLungTransplantation/6_1s20S1076633218300278.jpg)
Get Radiology Tree app to read full this article<
Get Radiology Tree app to read full this article<
Table 5
Accuracies for One-, Two-, and Three-dimensional Machine Learning Classification Based on Best Combinations of Baseline Predictors
Dimension (Number of Features) Accuracy (%) Baseline Features 1 76 Central airway volume (iVaw) at FRC 1 76 Total airway volume (iVaw) at FRC 2 83 Lobe volume (iVlobe) of RML at TLC Lobe volume (iVlobe) of RUL at FRC 3 85 Lobe volume (iVlobe) of RML at TLC Airway resistance (iRaw) of RUL at FRC Central airway surface (iSaw) at FRC
FRC, functional residual capacity; iRaw, imaging airway resistance; iSaw, imaging airway surface; iVaw, imaging airway volume; iVlobe, imaging lobar volume; RML, right middle lobe; RUL, right upper lobe.
Get Radiology Tree app to read full this article<
Discussion
Get Radiology Tree app to read full this article<
Get Radiology Tree app to read full this article<
Get Radiology Tree app to read full this article<
Get Radiology Tree app to read full this article<
Get Radiology Tree app to read full this article<
Get Radiology Tree app to read full this article<
Get Radiology Tree app to read full this article<
Get Radiology Tree app to read full this article<
Get Radiology Tree app to read full this article<
Get Radiology Tree app to read full this article<
Get Radiology Tree app to read full this article<
Supplementary Data
Get Radiology Tree app to read full this article<
Figure S1
Get Radiology Tree app to read full this article<
Get Radiology Tree app to read full this article<
Get Radiology Tree app to read full this article<
References
1. Hayes D.: A review of bronchiolitis obliterans syndrome and therapeutic strategies. J Cardiothorac Surg 2011; 6: pp. 92.
2. Verleden G.M., Raghu G., Meyer K.C., et. al.: A new classification system for chronic lung allograft dysfunction. J Heart Lung Transplant 2014; 33: pp. 127-133.
3. Hachem R.R., Trulock E.P.: Bronchiolitis obliterans syndrome: pathogenesis and management. Semin Thorac Cardiovasc Surg 2004; 16: pp. 350-355.
4. Estenne M., Maurer J.R., Boehler A., et. al.: Bronchiolitis obliterans syndrome 2001: an update of the diagnostic criteria. J Heart Lung Transplant 2002; 21: pp. 297-310.
5. Todd J.L., Palmer S.M.: Bronchiolitis obliterans syndrome: the final frontier for lung transplantation. Chest 2011; 140: pp. 502-508.
6. Brugière O., Pessione F., Thabut G., et. al.: Bronchiolitis obliterans syndrome after single-lung transplantation*: impact of time to onset on functional pattern and survival. Chest 2002; 121: pp. 1883-1889.
7. Miller W.T., Kotloff R.M., Blumenthal N.P., et. al.: Utility of high resolution computed tomography in predicting bronchiolitis obliterans syndrome following lung transplantation: preliminary findings. J Thorac Imaging 2001; 16: pp. 76-80.
8. Meyer K.C., Raghu G., Verleden G.M., et. al.: An international ISHLT/ATS/ERS clinical practice guideline: diagnosis and management of bronchiolitis obliterans syndrome. Eur Respir J 2014; 44: pp. 1479-1503.
9. Thompson B.R., Ellis M.J., Stuart-Andrews C., et. al.: Early bronchiolitis obliterans syndrome shows an abnormality of perfusion not ventilation in lung transplant recipients. Respir Physiol Neurobiol 2015; 216: pp. 28-34.
10. De Backer J.: Method for determining treatments using patient-specific lung models and computer methods. Google Patents2014.
11. De Backer J.W., Vos W.G., Vinchurkar S.C., et. al.: Validation of computational fluid dynamics in CT-based airway models with SPECT/CT. Radiology 2010; 257: pp. 854-862.
12. Vinchurkar S., De Backer L., Vos W., et. al.: A case series on lung deposition analysis of inhaled medication using functional imaging based computational fluid dynamics in asthmatic patients: effect of upper airway morphology and comparison with in vivo data. Inhal Toxicol 2012; 24: pp. 81-88.
13. De Backer J.W., Vos W.G., Devolder A., et. al.: Computational fluid dynamics can detect changes in airway resistance in asthmatics after acute bronchodilation. J Biomech 2008; 41: pp. 106-113.
14. Backer L.A.D., Vos W., Backer J.D., et. al.: The acute effect of budesonide/formoterol in COPD: a multi-slice computed tomography and lung function study. Eur Respir J 2012; 40: pp. 298-305.
15. De Backer L., Vos W.G., Salgado R., et. al.: Functional imaging using computer methods to compare the effect of salbutamol and ipratropium bromide in patient-specific airway models of COPD. Int J Chron Obstruct Pulmon Dis 2011; 6: pp. 637-646.
16. Bankier A.A., Van Muylem A., Knoop C., et. al.: Bronchiolitis obliterans syndrome in heart-lung transplant recipients: diagnosis with expiratory CT. Radiology 2001; 218: pp. 533-539.
17. Choi Y.W., Rossi S.E., Palmer S.M., et. al.: Bronchiolitis obliterans syndrome in lung transplant recipients: correlation of computed tomography findings with bronchiolitis obliterans syndrome stage. J Thorac Imaging 2003; 18: pp. 72-79.
18. Barbosa E.M., Simpson S., Lee J.C., et. al.: Multivariate modeling using quantitative CT metrics may improve accuracy of diagnosis of bronchiolitis obliterans syndrome after lung transplantation. Comput Biol Med 2017; 89: pp. 275-281.
19. Mortani Barbosa E.J., Shou H., Simpsom S., et. al.: Quantitative computed tomography metrics from the transplanted lung can predict forced expiratory volume in the first second after lung transplantation. J Thorac Imaging 2017; Epub ahead of print
20. Berstad A.E., Aaløkken T.M., Kolbenstvedt A., et. al.: Performance of long-term CT monitoring in diagnosing bronchiolitis obliterans after lung transplantation. Eur J Radiol 2006; 58: pp. 124-131.
21. Finlen Copeland C.A., Snyder L.D., Zaas D.W., et. al.: Survival after bronchiolitis obliterans syndrome among bilateral lung transplant recipients. Am J Respir Crit Care Med 2010; 182: pp. 784-789.
22. Ng L.Y., Paul N., Patsios D., et. al.: Imaging of lung transplantation: review. Am J Roentgenol 2009; 192: pp. S1-S13.