
Rationale and Objectives
In vivo tracking cells using gadolinium-based contrast agents have the important advantage of providing a positive contrast on T1-weighted images, which is less likely to be confused with artifacts because of postoperative local signal voids such as metal, hemorrhage, or air. The aim of this study is to paramagnetically and fluorescently label marrow with dual agents (gadolinium-diethylene triamine penta-acetic acid [Gd-DTPA] and PEI-FluoR) and track them after transplantation into spinal cord injury (SCI) with magnetic resonance imaging (MRI).
Materials and Methods
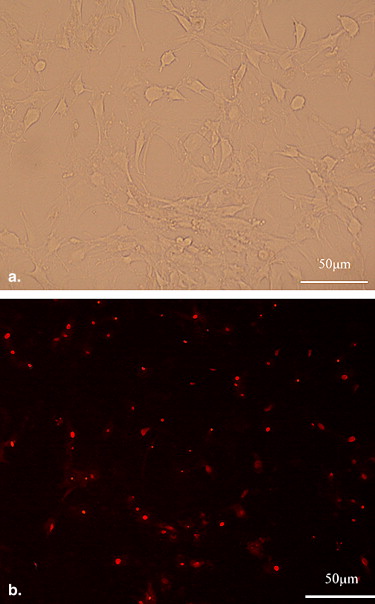
Marrow mesenchymal stem cells (MSCs) from Sprague-Dawley rats were incubated with PEI-FluoR (rhodamine-conjugated PEI-FluoR) and Gd-DTPA complex for labeling. After labeling, cellular viability, proliferation, and apoptosis were evaluated. T1 value and longevity of intracellular Gd-DTPA retention were measured on a 1.5 T MRI scanner. Thirty-six SCI rats were implanted with labeled and unlabeled MSCs and phosphate-buffered saline. Then, serial MRI and Basso-Beattie-Bresnehan (BBB) locomotor tests were performed and correlated with fluorescent microscopy. The relative signal intensity (RSL) of the engraftment in relation to normal cord was measured and the linear mixed model followed by post-hoc Bonferroni test was used to identify significant differences in RSL as well as BBB score.
Results
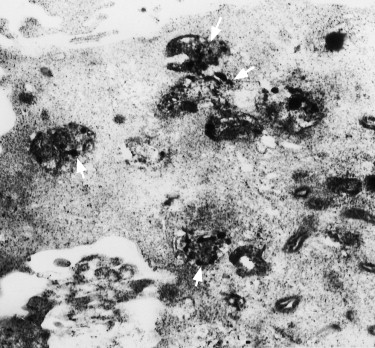
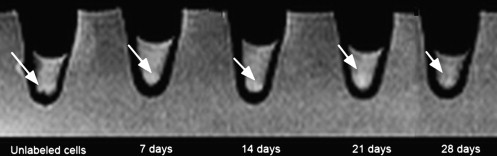
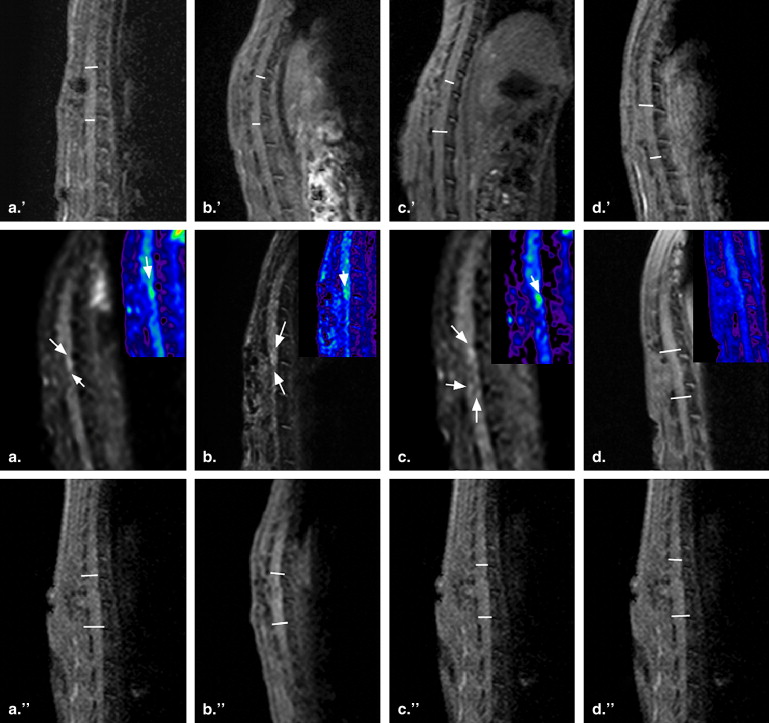
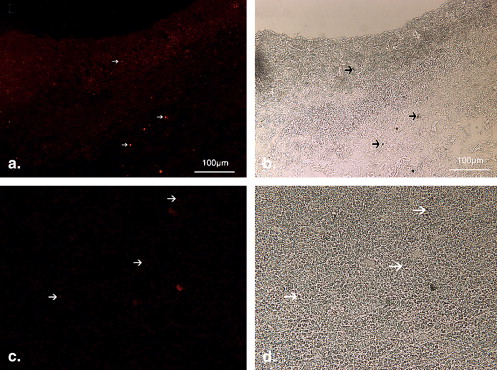
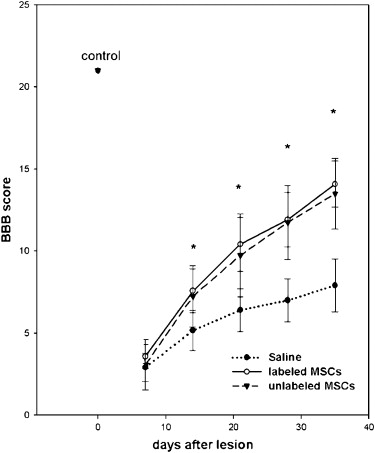
MSCs could be paramagnetically and fluorescently labeled by the dual agents. The labeling did not influence the cellular viability, proliferation, and apoptosis. The longevity of Gd-DTPA retention in labeled MSCs was up to 21 days. The distribution and migration of labeled MSCs in SCI lesions could be tracked until 7 days after implantation on MRI. The relative signal intensities of SCI rats treated with labeled cells at 1 day and 3 days (1.34 ± 0.02, 1.27 ± 0.03) were significantly higher than rats treated with unlabeled cells (0.94 ± 0.01, 0.99 ± 0.02) and phosphate-buffered saline (0.91 ± 0.01, 0.95 ± 0.01) ( P < .05). Rats treated with labeled MSCs or unlabeled MSCs achieved significantly higher BBB scores than controls at 14, 21, 28, and 35 days after injury ( P < .05).
Conclusions
Labeling MSCs with the dual agents may enable cellular MRI and tracking in experimental spinal cord injury.
Traumatic injuries to the spinal cord lead to severe and permanent neurological deficits. Stem cell transplantation strategies hold promise to enhance functional recovery after spinal cord injury (SCI). Transplanted stem cells can either differentiate into neural cells and replace lost populations of cells or they can produce cytokines or growth factors that can lead to neural cell rescue or enhance regeneration . Previously, embryonic stem cells, bone marrow mesenchymal stem cells, and neural stem cells have been used in cell therapy in animal models of SCI . There has no consensus yet on what kind of stem cells is an ideal source for cellular grafts. However, mesenchymal stem cells (MSCs) are preferred because of their advantages over other sources of cells (ie, relatively easy isolation, use in autologous transplantation protocols, a source of cells already approved for the treatment of hematopoietic diseases) .
For successful cellular transplantation treatment, a reliable method for in vivo evaluation of global cell distribution and cell dynamics is highly desirable. Unlike the current use of stem cells in animal models, the introduction of therapeutic cells in patients will require techniques that can monitor the tissue biodistribution of these cells noninvasively. Magnetic resonance imaging (MRI) is a well-suited tool to track stem cell persistence and migration over time after cell labeling with MRI-visible contrast agents. Cellular MRI-based cellular imaging allows in vivo visualization of the fate and the migration of cells after transplantation .
Get Radiology Tree app to read full this article<
Get Radiology Tree app to read full this article<
Materials and methods
Animals
Get Radiology Tree app to read full this article<
Spinal Cord Injury
Get Radiology Tree app to read full this article<
MSCs Preparation and Labeling
Get Radiology Tree app to read full this article<
Get Radiology Tree app to read full this article<
Cellular Viability and Contrast Agent Maintenance
Get Radiology Tree app to read full this article<
Get Radiology Tree app to read full this article<
Get Radiology Tree app to read full this article<
Spectrophotometry
Get Radiology Tree app to read full this article<
MSCs Transplantation
Get Radiology Tree app to read full this article<
MRI
Get Radiology Tree app to read full this article<
Get Radiology Tree app to read full this article<
Get Radiology Tree app to read full this article<
Get Radiology Tree app to read full this article<
Get Radiology Tree app to read full this article<
Histopathologic Evaluation
Get Radiology Tree app to read full this article<
Get Radiology Tree app to read full this article<
Behavioral Testing
Get Radiology Tree app to read full this article<
Statistical Analysis
Get Radiology Tree app to read full this article<
Results
Cell Labeling
Get Radiology Tree app to read full this article<
Get Radiology Tree app to read full this article<
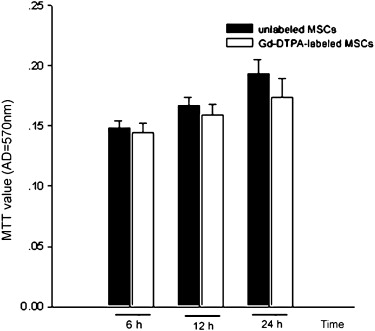
Toxicity and Proliferation
Get Radiology Tree app to read full this article<
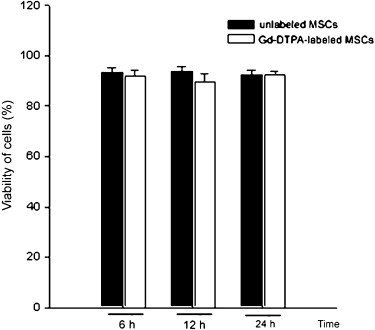
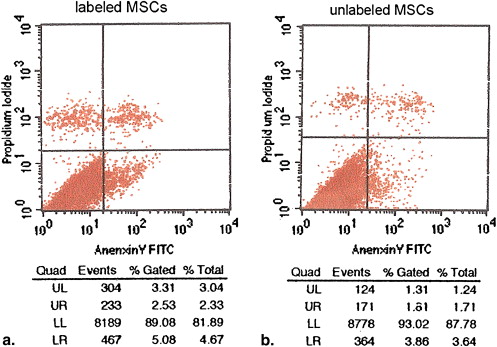
Table 1
MTT Assay of Labeled and Unlabeled Mesenchymal Stem Cells
Incubation time (h) 6 12 24 Unlabeled cells (A) 0.1481 ± 0.0067 0.1940 ± 0.0117 0.1675 ± 0.0063 Labeled cells (A) 0.1441 ± 0.0083 0.1741 ± 0.016 0.1594 ± 0.0084 MTT value 97.29% 89.74% 95.16%
Data were derived from 12 samples.
Get Radiology Tree app to read full this article<
In Vitro MRI of Labeled MSCs
Get Radiology Tree app to read full this article<
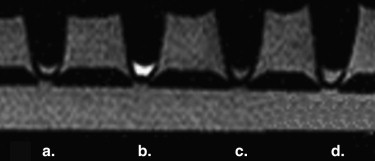
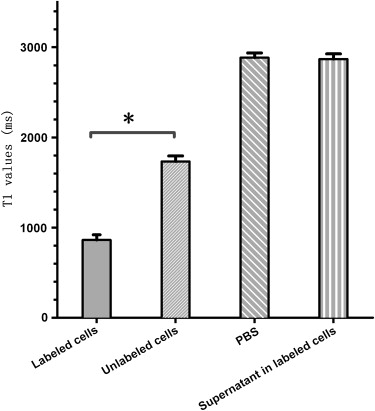
Get Radiology Tree app to read full this article<
In Vivo MR Imaging of Grafted MSCs
Get Radiology Tree app to read full this article<

Get Radiology Tree app to read full this article<
Detection of Grafted Cells by Histology
Get Radiology Tree app to read full this article<
Get Radiology Tree app to read full this article<
Functional Recovery
Get Radiology Tree app to read full this article<
Get Radiology Tree app to read full this article<
Discussion
Get Radiology Tree app to read full this article<
Get Radiology Tree app to read full this article<
Get Radiology Tree app to read full this article<
Get Radiology Tree app to read full this article<
Get Radiology Tree app to read full this article<
Get Radiology Tree app to read full this article<
Get Radiology Tree app to read full this article<
Get Radiology Tree app to read full this article<
Get Radiology Tree app to read full this article<
References
1. Kim B.G., Hwang D.H., Lee S.I., et. al.: Stem cell-based cell therapy for spinal cord injury. Cell Transplant 2007; 16: pp. 355-364.
2. McDonald J.W., Liu X.Z., Qu Y., et. al.: Transplanted embryonic stem cells survive, differentiate and promote recovery in injured rat spinal cord. Nat Med 1999; 5: pp. 1410-1412.
3. Parr A.M., Kulbatski I., Wang X.H., et. al.: Fate of transplanted adult neural stem/progenitor cells and bone marrow-derived mesenchymal stromal cells in the injured adult rat spinal cord and impact on functional recovery. Surg Neurol 2008; 70: pp. 600-607.
4. Syková E., Jendelová P.: Magnetic resonance tracking of implanted adult and embryonic stem cells in injured brain and spinal cord. Ann NY Acad Sci 2005; 1049: pp. 146-160.
5. Kraitchman D.L., Gilson W.D., Lorenz C.H.: Stem cell therapy: MRI guidance and monitoring. J Magn Reson Imaging 2008; 27: pp. 299-310.
6. Bulte J.W., Douglas T., Witwer B., et. al.: Magnetodendrimers allow endosomal magnetic labeling and in vivo tracking of stem cells. Nat Biotechnol 2001; 19: pp. 1141-1147.
7. Crichton R.R., Wilmet S., Legssyer R., et. al.: Molecular and cellular mechanisms of iron homeostasis and toxicity in mammalian cells. J Inorg Biochem 2002; 91: pp. 9-18.
8. Wilhelm C., Cebers A., Bacri J.C., et. al.: Deformation of intracellular endosomes under a magnetic field. Eur Biophys J 2003; 32: pp. 655-660.
9. Modo M., Cash D., Mellodew K., et. al.: Tracking transplanted stem cells migration using bifunctional contrast agent-enhanced, magnetic resonance imaging. NeuroImage 2002; 17: pp. 803-811.
10. Boussif O.F., Lezoualc’h M.A., Zanta M.D., et. al.: Versatile vector for gene and oligonucleotide transfer into cells in culture and in vivo: polyethylenimine. Proc Natl Acad Sci U S A 1995; 92: pp. 7297-7301.
11. Politi L.S.: MR-based imaging of neural stem cells. Neuroradiology 2007; 49: pp. 523-534.
12. Allen A.R., MacPhail R.C.: Surgery of experimental lesion of spinal cord equivalent to crush injury of fractured is location of spinal column. Pharmacol Biochem Behav 1911; 57: pp. 878-880.
13. Nagaya N., Fujii T., Iwase T., et. al.: Intravenous administration of mesenchymal stem cells improves cardiac function in rats with acute myocardial infarction through angiogenesis and myogenesis. Am J Physiol Heart Circ Physiol 2004; 287: pp. H2670-H2676.
14. Denizot F., Lang R.: Rapid colorimetric assay for cell growth and survival. Modifications to the tetrazolium dye procedure giving improved sensitivity and reliability. J Immunol Methods 1986; 89: pp. 271-277.
15. In den Kleef J.J.E., Cuppen J.J.M.: RLSQ: T1, T2 and rho calculations, combining ratios and least squares. Magn Reson Med 1987; 5: pp. 513-524.
16. Basso D.M., Beattie M.S., Bresnahan J.C.: A sensitive and reliable locomotor rating scale for open field testing in rats. J Neurotrauma 1995; 12: pp. 1-21.
17. Eftekharpour E., Karimi-Abdolrezaee S., Fehlings M.G.: Current status of experimental cell replacement approaches to spinal cord injury. Neurosurgical FOCUS 2008; 24: pp. E18.
18. Himes B.T., Neuhuber B., Coleman C., et. al.: Recovery of function following grafting of human bone marrow-derived stromal cells into the injured spinal cord. Neurorehabil Neural Repair 2006; 20: pp. 278-296.
19. Syková E., Jendelová P., Urdzíková L., et. al.: Bone marrow stem cells and polymer hydrogels—two strategies for spinal cord injury repair. Cell Mol Neurobiol 2006; 26: pp. 1113-1129.
20. Miyanji F., Furlan J.C., Aarabi B., et. al.: Acute cervical traumatic spinal cord injury: MR imaging findings correlated with neurologic outcome—prospective study with 100 consecutive patients. Radiology 2007; 243: pp. 820-827.
21. Walczak P., Bulte J.W.: The role of noninvasive cellular imaging in developing cell-based therapies for neurodegenerative disorders. Neurodegenerative Dis 2007; 4: pp. 306-313.
22. Bulte J.W., Duncan I.D., Frank J.A.: In vivo magnetic resonance tracking of magnetically labeled cells after transplantation. J Cereb Blood Flow Metab 2002; 22: pp. 899-907.
23. Budde M.D., Frank J.A.: Magnetic tagging of therapeutic cells for MRI. J Nucl Med 2009; 50: pp. 171-174.
24. Lee I.H., Bulte J.W., Schweinhardt P., et. al.: In vivo magnetic resonance tracking of olfactory ensheathing glia grafted into the rat spinal cord. Exp Neurol 2004; 187: pp. 509-516.
25. Urdzikova L., Jendelova P., Glogarova K., et. al.: Transplantation of bone marrow stem cells as well as mobilization by granulocyte-colony stimulating factor promotes recovery after spinal cord injury in rats. J Neurotrauma 2006; 23: pp. 1379-1391.
26. Jendelová P., Herynek V., Urdzíková L., et. al.: MR tracking of transplanted bone marrow and embryonic stem cells labeled by iron oxide nanoparticles in rat brain and spinal cord. J Neurosci Res 2004; 76: pp. 232-243.
27. Shyu W.C., Chen C.P., Lin S.Z., et. al.: Efficient Tracking of non–iron-labeled mesenchymal stem cells with serial MRI in chronic stroke rats. Stroke 2007; 38: pp. 367-374.
28. Giesel F.L., Stroick M., Griebe M., et. al.: Gadofluorine M uptake in stem cells as a new magnetic resonance imaging tracking method: an in vitro and in vivo study. Invest Radiol 2006; 41: pp. 868-873.
29. Anderson S.A., Lee K.K., Frank J.A.: Gadolinium-fullerenol as a paramagnetic contrast agent for cellular imaging. Invest Radiol 2006; 41: pp. 332-338.
30. Daldrup-Link H.E., Rudelius M., Oostendorp R.A., et. al.: Targeting of hematopoietic progenitor cells with MR contrast agents. Radiology 2003; 228: pp. 760-767.
31. Parac-Vogt T.N., Vander Elst L., Kimpe K., et. al.: Pharmacokinetic and in vivo evaluation of a self-assembled gadolinium(III)-iron(II) contrast agent with high relaxivity. Contrast Media Mol Imaging 2006; 1: pp. 267-278.
32. Crich S.G., Biancone L., Cantaluppi V., et. al.: Improved route for the visualization of stem cells labeled with a Gd-/Eu-chelate as dual (MRI and fluorescence) agent. Magn Reson Med 2004; 51: pp. 938-944.
33. Ludemann L., Wurm R., Zimmer C.: Pharmacokinetic modeling of GD-DTPA extravasation in brain tumors. Invest Radiol 2002; 37: pp. 562-570.
34. Walczak P., Kedziorek D.A., Gilad A.A., et. al.: Applicability and limitations of MR tracking of neural stem cells with asymmetric cell division and rapid turnover: the case of the shiverer dysmyelinated mouse brain. Magn Reson Med 2007; 58: pp. 261-269.