
Rationale and Objectives
We aimed to investigate the role of magnetic resonance imaging parameters in predicting the treatment outcome of high-intensity focused ultrasound (HIFU) ablation of uterine fibroids with a nonperfused volume (NPV) ratio of at least 90%.
Material and Methods
A total of 120 women who underwent HIFU treatment were divided into groups 1 ( n = 72) and 2 ( n = 48), comprising patients with an NPV ratio of at least 90% and less than 90%, respectively. Multivariate logistic regression analyses were carried out to investigate the potential predictors of the NPV ratio of at least 90%. The NPV ratios immediately post-treatment, therapeutic efficacy at 6 months’ follow-up, and safety in terms of adverse effects and changes in anti-Mullerian hormone level were assessed.
Results
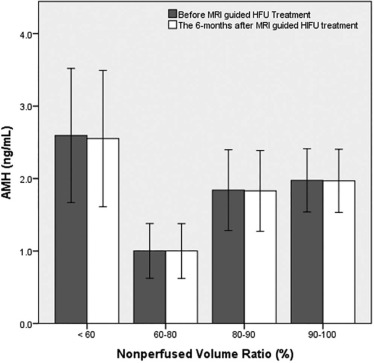
By introducing multiple predictors obtained from multivariate analyses into a generalized estimating equation model, the results showed that the thickness of the subcutaneous fat layer in the anterior abdominal wall, peak enhancement of fibroid, time to peak of fibroid, and the ratio of area under the curve of fibroid to myometrium were statistically significant, except T2 signal intensity ratio of fibroid to myometrium, hence predicting an NPV ratio of at least 90%. No serious adverse effects and no significant difference between the anti-Mullerian hormone levels before or 6 months post-treatment were reported.
Conclusions
The findings in this study suggest that the achievement of NPV ratio of at least 90% in magnetic resonance imaging-guided HIFU treatment of uterine fibroids based on prediction model appears clinically possible without compromising the safety of patients.
Introduction
Uterine fibroids, also known as leiomyomas, represent the most common tumor in women. These fibroids disrupt the functions of the uterus and cause menorrhagia, dysmenorrhea, anemia, pelvic pressure or pain, urinary incontinence, recurrent pregnancy loss, and infertility. The lifetime prevalence of uterine fibroids ranges from 70% to 80% .
Magnetic resonance imaging (MRI)-guided high-intensity focused ultrasound (HIFU), which combines the anatomical and functional imaging of magnetic resonance (MR) with the thermal ablation possibilities of HIFU, is a promising minimally invasive therapy for the treatment of uterine fibroids. MRI is of great importance in HIFU treatments and not only contributes in patient selection, an essential step toward obtaining good treatment results, but also facilitates planning the treatment, monitoring the safety of the delivery, and verifying the outcome.
Get Radiology Tree app to read full this article<
Get Radiology Tree app to read full this article<
Get Radiology Tree app to read full this article<
Materials and Methods
Get Radiology Tree app to read full this article<
Patients
Get Radiology Tree app to read full this article<
Get Radiology Tree app to read full this article<
MRI Sequences
Get Radiology Tree app to read full this article<
Get Radiology Tree app to read full this article<
Get Radiology Tree app to read full this article<
Get Radiology Tree app to read full this article<
Get Radiology Tree app to read full this article<
Assessment of T2W Images and Perfusion MRI
Get Radiology Tree app to read full this article<
Get Radiology Tree app to read full this article<
Get Radiology Tree app to read full this article<
MR-guided High-intensity Focused Ultrasound Treatment
Get Radiology Tree app to read full this article<
Get Radiology Tree app to read full this article<
Therapeutic Efficacy and Safety Assessment
Get Radiology Tree app to read full this article<
Get Radiology Tree app to read full this article<
Data Analysis and Statistics
Get Radiology Tree app to read full this article<
Get Radiology Tree app to read full this article<
Get Radiology Tree app to read full this article<
Results
Baseline Characteristics
Get Radiology Tree app to read full this article<
TABLE 1
Comparison of Baseline Characteristics According to the NPV Ratio of at Least 90% and Less Than 90%
Characteristics All Patients NPV Ratio ≥90% NPV Ratio <90%P Value Patients 120 72 48 Subcutaneous fat thickness (mm) 11.9 ± 4.3 (3.0–26.0) 11.0 ± 4.4 (3.0–25.0) 13.3 ± 3.8 (5.0–26.0) .004 ‡ Presence of abdominal scars Yes 31 17 14 .528 No 89 55 34 Uterus position .060 Anteverted 87 48 39 Retroverted 33 24 9 Diameter (cm) \* 7.1 ± 2.6 (2.4–15.1) 7.3 ± 3.0 (2.4–15.1) 6.8 ± 1.9 (3.0–11.8) .337 Distance (mm) † 94.5 ± 15.0 (57.0–133.0) 94.1 ± 15.6 (57.0–130.0) 95.2 ± 14.2 (59.0–133.0) .686 Fibroid types .526 Intramural 68 38 30 Subserosal 21 13 8 Submucosal 31 21 10
NPV, nonperfused volume.
Values in parentheses represent ranges.
Get Radiology Tree app to read full this article<
Get Radiology Tree app to read full this article<
Get Radiology Tree app to read full this article<
Get Radiology Tree app to read full this article<
Characteristics of MRI-guided HIFU Treatment of Uterine Fibroids
Get Radiology Tree app to read full this article<
Get Radiology Tree app to read full this article<
Get Radiology Tree app to read full this article<
Get Radiology Tree app to read full this article<
Analysis of Factors Influencing NPV Ratio of at Least 90%
Get Radiology Tree app to read full this article<
Get Radiology Tree app to read full this article<
TABLE 2
Independent Factors of Each Group Associated With an NPV Ratio of at Least 90%: Multivariate Analysis
Parameters Multivariate Analysis Estimate 95% CI_P_ ValueBaseline parameters Intercept −3.025 −6.176 to 0.126 .060 Uterus position 0.879 −0.198 to 1.955 .110 Subcutaneous fat thickness (mm) 0.117 0.018–0.215 .021 \* Fibroid diameter (cm) −0.012 −0.030 to 0.006 .188 Distance (mm) \* 0.013 −0.017 to 0.043 .403 Fibroid type 0.480 −0.698 to 1.657 .424 T 2 SI parameters Intercept −1.978 −3.051 to −0.906 <.001 SI of uterine fibroids 0.004 −0.003 to 0.010 .257 SI ratio of fibroid to muscle 0.187 −0.150 to 0.525 .277 SI ratio of fibroid to myometrium 1.236 0.045–2.427 .042 † Semiquantitative perfusion MR parameters Intercept −6.055 −11.671 to −0.439 .035 Relative enhancement (in percentage) −0.001 −0.063 to 0.061 .971 Peak enhancement 0.006 0.00005 to 0.012 .048 † Relative peak enhancement (in percentage) −0.007 −0.071 to 0.058 .832 Time to peak (in seconds) −0.009 −0.017 to −0.001 .021 † Wash-in rate (per second) 0.093 −0.011 to 0.196 .079 Area under the curve −0.00001 −0.00003 to 0.000006 .220 Ratio of relative enhancement of fibroid to myometrium −1.099 −5.590 to 3.392 .632 Ratio of peak enhancement of fibroid to myometrium −3.096 −6.313 to 0.120 .059 Ratio of relative peak enhancement of fibroid to myometrium 3.108 −1.398 to 7.615 .176 Ratio of time to peak of fibroid to myometrium 0.381 −1.740 to 2.501 .725 Ratio of wash-in rate of fibroid to myometrium −0.261 −1.829 to 1.308 .745 Ratio of area under the curve of fibroid to myometrium 6.307 1.337–11.277 .013 †
CI, confidence interval; MR, magnetic resonance; NPV, nonperfused volume; SI signal intensity.
Get Radiology Tree app to read full this article<
Get Radiology Tree app to read full this article<
Get Radiology Tree app to read full this article<
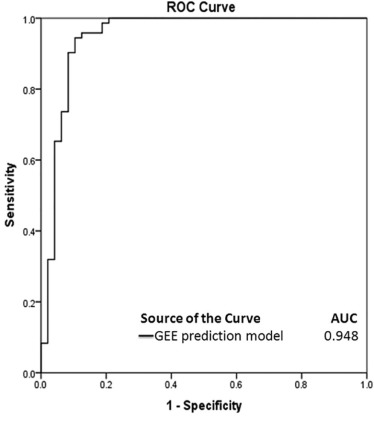
Prediction Model
Get Radiology Tree app to read full this article<
y=e−6.958+0.143×1+0.189×2+0.008×3−0.015×4+4.785×51+e−6.958+0.143×1+0.189×2+0.008×3−0.015×4+4.785×5 y
=
e
−
6.958
+
0.143
×
1
+
0.189
×
2
+
0.008
×
3
−
0.015
×
4
+
4.785
×
5
1
+
e
−
6.958
+
0.143
×
1
+
0.189
×
2
+
0.008
×
3
−
0.015
×
4
+
4.785
×
5
for predicting an NPV ratio of at least 90% with five statistically significant predictors from multivariate analyses, where ×1 = thickness of the subcutaneous fat layer in the anterior abdominal wall (millimeters), ×2 = T2 SI ratio of fibroid to myometrium, ×3 = peak enhancement of fibroid, ×4 = time to peak of fibroid (in seconds), and ×5 = ratio of AUC of fibroid to myometrium. All the perfusion MRI parameters (ie, ×3, ×4, and ×5) and baseline parameter (ie, ×1) were statistically significant ( P < .05, Table 3 ), with the exception of T2 SI ratio of fibroid to myometrium (ie, ×2; P = .715, Table 3 ).
TABLE 3
Results of Generalized Estimating Equation (GEE) Analyses for Predicting the Treatment Outcome of MRI-guided HIFU Ablation With an NPV Ratio of at Least 90%
Parameters Estimate Standard Error 95% CI_P_ Value Intercept −6.958 2.385 −11.633 to −2.282 .004 Subcutaneous fat thickness (mm) 0.143 0.065 0.014–0.271 .030 \* SI ratio of fibroid to myometrium 0.189 0.518 −0.826 to 1.205 .715 Peak enhancement 0.008 0.002 0.003–0.012 .001 \* Time to peak (in seconds) −0.015 0.004 −0.023 to −0.007 .001 \* Ratio of area under the curve of fibroid to myometrium 4.785 1.666 1.519–8.051 .004 \*
CI, confidence interval; HIFU, high-intensity focused ultrasound; MRI, magnetic resonance imaging; NPV, nonperfused volume; SI, signal intensity.
Get Radiology Tree app to read full this article<
Get Radiology Tree app to read full this article<
Get Radiology Tree app to read full this article<
Get Radiology Tree app to read full this article<
Assessment of 6 Months’ Follow-Up: Fibroid Volume and Symptom Changes
Get Radiology Tree app to read full this article<
Get Radiology Tree app to read full this article<
Get Radiology Tree app to read full this article<
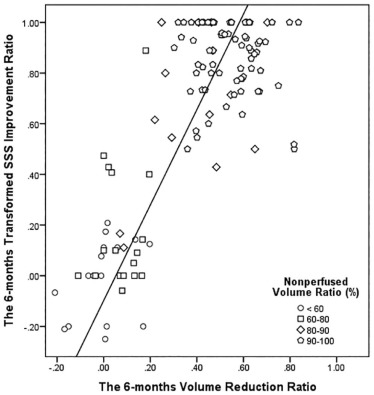
TABLE 4
Comparison of Fibroid Tumor Volume and Symptom Changes Based on the NPV Ratio of at Least 90% and Less Than 90%
Treatment Outcome All Patients ( n = 120) NPV Ratio ≥90% ( n = 72) NPV Ratio <90% ( n = 48)P ValueFibroid volume (mL) \* Baseline .011 ‡ Mean ± SD 197.3 ± 155.7 226.7 ± 181.6 153.2 ± 90.7 Range 6.0–794.0 6.0–794.0 12.0–478.0 6 mo .004 ‡ Mean ± SD 113.2 ± 89.3 94.4 ± 70.8 141.4 ± 106.1 Range 4.0–578.0 4.0–400.0 10.0–578.0 Reduction ratio .001 ‡ Mean ± SD 0.38 ± 0.26 0.54 ± 0.13 0.14 ± 0.21 Range −0.21–0.84 0.30–0.84 −0.21 to 0.70Symptom severity score † Baseline .151 Mean ± SD 57.8 ± 16.0 56.1 ± 16.6 60.4 ± 14.9 Range 21.9–93.8 21.9–87.5 31.2–93. 6 mo .001 ‡ Mean ± SD 23.6 ± 26.3 8.0 ± 9.1 46.9 ± 26.5 Range 0.0–100.0 0.0–43.8 0.0–100.0 Improvement ratio .001 ‡ Mean ± SD 0.62 ± 0.39 0.86 ± 0.14 0.26 ± 0.37 Range −0.25–1.0 0.5–1.0 −0.25 to 1.0
NPV, nonperfused volume; SD, standard deviation.
Get Radiology Tree app to read full this article<
Get Radiology Tree app to read full this article<
Get Radiology Tree app to read full this article<
Get Radiology Tree app to read full this article<
Safety Assessments
Get Radiology Tree app to read full this article<
TABLE 5
Complications and Adverse Effects of MRI-guided HIFU Treatment According to the NPV Ratio of at Least 90% and Less Than 90%
SIR Classification All Patients ( n = 120) NPV Ratio ≥90% ( n = 72) NPV Ratio <90% ( n = 48)P Value Class A Skin burn grade 1 3 (2.5) 0 (0) 3 (6.25) .062 Skin burn grade 2 1 (0.83) 0 (0) 1 (2.1) .400 Back pain 8 (6.7) 3 (4.2) 5 (10.4) .264 Pelvic pain 12 (10) 10 (13.9) 2 (4.2) .121 Leg pain 12 (10) 8 (11.1) 4 (8.3) .761 Nausea 6 (5) 6 (8.3) 0 (0) .080 Numbness 12 (10) 8 (11.1) 4 (8.3) .761 Vaginal discharge 13 (10.8) 10 (13.9) 3 (6.25) .154 Cystitis 1 (0.83) 1(1.4) 0 (0) 1.000
HIFU, high intensity focused ultrasound; MRI, magnetic resonance imaging; NPV, nonperfused volume; SIR, Society of Interventional Radiology.
Values in parentheses represent percentages.
Get Radiology Tree app to read full this article<
Get Radiology Tree app to read full this article<
Get Radiology Tree app to read full this article<
Discussion
Get Radiology Tree app to read full this article<
Get Radiology Tree app to read full this article<
Get Radiology Tree app to read full this article<
Get Radiology Tree app to read full this article<
Get Radiology Tree app to read full this article<
Get Radiology Tree app to read full this article<
Get Radiology Tree app to read full this article<
Get Radiology Tree app to read full this article<
Get Radiology Tree app to read full this article<
Get Radiology Tree app to read full this article<
Get Radiology Tree app to read full this article<
Get Radiology Tree app to read full this article<
Conclusion
Get Radiology Tree app to read full this article<
References
1. Baird D.D., Dunson D.B., Hill M.C., et. al.: High cumulative incidence of uterine leiomyoma in black and white women: ultrasound evidence. Am J Obstet Gynecol 2003; 188: pp. 100-107.
2. Tempany C.M., Stewart E.A., McDannold N., et. al.: MR imaging-guided focused ultrasound surgery of uterine leiomyomas: a feasibility study. Radiology 2003; 226: pp. 897-905.
3. Stewart E.A., Gedroyc W.M., Tempany C.M., et. al.: Focused ultrasound treatment of uterine fibroid tumors: safety and feasibility of a noninvasive thermoablative technique. Am J Obstet Gynecol 2003; 189: pp. 48-54.
4. Hindley J., Gedroyc W.M., Regan L., et. al.: MRI guidance of focused ultrasound therapy of uterine fibroids: early results. AJR Am J Roentgenol 2004; 183: pp. 1713-1719.
5. Funaki K., Fukunishi H., Funaki T., et. al.: Magnetic resonance-guided focused ultrasound surgery for uterine fibroids: relationship between the therapeutic effects and signal intensity of preexisting T2 weighted magnetic resonance images. Am J Obstet Gynecol 2007; 196:
6. Funaki K., Fukunishi H., Funaki T., et. al.: Mid-term outcome of magnetic resonance-guided focused ultrasound surgery for uterine myomas: from six to twelve months after volume reduction. J Minim Invasive Gynecol 2007; 14: pp. 616-621.
7. Stewart E.A., Gostout B., Rabinovici J., et. al.: Sustained relief of leiomyoma symptoms by using focused ultrasound surgery. Obstet Gynecol 2007; 110: pp. 279-287.
8. Funaki K., Sawada K., Maeda F., et. al.: Subjective effect of magnetic resonance-guided focused ultrasound surgery for uterine fibroids. J Obstet Gynaecol Res 2007; 33: pp. 834-839.
9. Lenard Z.M., McDannold N.J., Fennessy F.M., et. al.: Uterine leiomyomas: MR imaging-guided focused ultrasound surgery—imaging predictors of success. Radiology 2008; 249: pp. 187-194.
10. Morita Y., Ito N., Hikida H., et. al.: Non-invasive magnetic resonance imaging-guided focused ultrasound treatment for uterine fibroids—early experience. Eur J Obstet Gynecol Reprod Biol 2008; 139: pp. 199-203.
11. Mikami K., Murakami T., Okada A., et. al.: Magnetic resonance imaging-guided focused ultrasound ablation of uterine fibroids: early clinical experience. Radiat Med 2008; 26: pp. 198-205.
12. Funaki K., Fukunishi H., Sawada K.: Clinical outcomes of magnetic resonance-guided focused ultrasound surgery for uterine myomas: 24-month follow-up. Ultrasound Obstet Gynecol 2009; 34: pp. 584-589.
13. LeBlang S.D., Hoctor K., Steinberg F.L.: Leiomyoma shrinkage after MRI-guided focused ultrasound treatment: report of 80 patients. AJR Am J Roentgenol 2010; 194: pp. 274-280.
14. Kim Y.S., Keserci B., Partanen A., et. al.: Volumetric MR-HIFU ablation of uterine fibroids: role of treatment cell size in the improvement of energy efficiency. Eur J Radiol 2012; 81: pp. 3652-3659.
15. Ikink M.E., Voogt M.J., Verkooijen H.M., et. al.: Mid-term clinical efficacy of a volumetric magnetic resonance-guided high-intensity focused ultrasound technique for treatment of symptomatic uterine fibroids. Eur Radiol 2013; 23: pp. 3054-3061.
16. Park M.J., Kim Y.S., Rhim H.C., et. al.: Safety and therapeutic efficacy of complete or near- complete ablation of symptomatic uterine fibroid tumors by MR imaging-guided high-intensity focused US therapy. J Vasc Interv Radiol 2014; 25: pp. 231-239.
17. Mindjuk I., Trumm C.G., Herzog P., et. al.: MRI predictors of clinical success in MR-guided focused ultrasound (MRgFUS) treatments of uterine fibroids: results from a single centre. Eur Radiol 2015; 25: pp. 1317-1328.
18. Thiburce A.C., Frulio N., Hocquelet A., et. al.: Magnetic resonance-guided high-intensity focused ultrasound for uterine fibroids: mid-term outcomes of 36 patients treated with the Sonalleve system. Int J Hyperthermia 2015; 31: pp. 764-770.
19. Kim Y.S., Kim B.G., Rhim H., et. al.: Uterine fibroids: semiquantitative perfusion MR imaging parameters associated with the intra-procedural and immediate postprocedural treatment efficiencies of MR imaging-guided high-intensity focused ultrasound ablation. Radiology 2014; 273: pp. 462-471.
20. Kim Y.S., Lim H.K., Park M.J., et. al.: Screening magnetic resonance imaging-based prediction model for assessing immediate therapeutic response to magnetic resonance imaging-guided high-intensity focused ultrasound ablation of uterine fibroids. Invest Radiol 2016; 51: pp. 15-24.
21. Kim Y.S., Lee J.W., Choi C.H., et. al.: Uterine fibroids: correlation of T2 signal intensity with semiquantitative perfusion MR parameters in patients screened for MR-guided high-intensity focused ultrasound ablation. Radiology 2016; 278: pp. 925-935.
22. Keserci B., Nguyen M.D.: Magnetic resonance-guided high-intensity focused ultrasound ablation of uterine fibroids: T1 perfusion based time-signal intensity curves in screening MRI as predictor of immediate non-perfused volume and treatment outcome. Eur Radiol 2017; 27: pp. 5299-5308.
23. Köhler M.O., Mougenot C., Quesson B., et. al.: Volumetric HIFU ablation under 3D guidance of rapid MRI thermometry. Med Phys 2009; 36: pp. 3521-3535.
24. Spies J.B., Coyne K., Guaou N., et. al.: The UFS-QOL, a new disease-specific symptom and health-related quality of life questionnaire for leiomyomata. Obstet Gynecol 2002; 99: pp. 290-300.
25. Sacks D., McClenny T.E., Cardella J., et. al.: Society of Interventional Radiology clinical practice guidelines. J Vasc Interv Radiol 2003; 14: pp. 199-202.
26. Practice Committee of the American Society for Reproductive Medicine : Testing and interpreting measures of ovarian reserve: a committee opinion. Fertil Steril 2015; 103: pp. 9-17.
27. Henriques F.C., Moritz A.R.: Studies of thermal injury in the conduction of heat to and through skin and the temperatures attained therein: a theoretical and experimental investigation. Am J Pathol 1947; 23: pp. 531-549.
28. Anderson G.S.: Human morphology and temperature regulation. Int J Biometeorol 1999; 43: pp. 99-109.
29. Cohen M.L.: Measurement of the thermal properties of human skin: a review. J Invest Dermatol 1977; 69: pp. 333-338.
30. Heinonen I., Kemppainen J., Kaskinoro K., et. al.: Capacity and hypoxic response of subcutaneous adipose tissue blood flow in humans. Circ J 2014; 78: pp. 1501-1506.
31. Yamashita Y., Torashima M., Takahashi M., et. al.: Hyperintense uterine leiomyoma at T2-weighted MR imaging: differentiation with dynamic enhanced MR imaging and clinical implications. Radiology 1993; 189: pp. 721-725.
32. Zhao W.P., Chen J.Y., Zhang L., et. al.: Feasibility of ultrasound-guided high intensity focused ultrasound ablating uterine fibroids with hyperintense on T2-weighted MR imaging. Eur J Radiol 2013; 82: pp. 43-49.
33. Yoon S.W., Lee C., Kim K.A., et. al.: Contrast-enhanced dynamic MR imaging of uterine fibroids as a potential predictor of patient eligibility for MR guided focused ultrasound (MRgFUS) treatment for symptomatic uterine fibroids. Obstet Gynecol Int 2010; 2010: pp. 1-4. Article ID:834275
34. Pennes H.H.: Analysis of tissue and arterial blood temperatures in the resting human forearm. J Appl Physiol 1948; 1: pp. 93-122.
35. Zhao W.P., Chen J.Y., Chen W.Z.: Effect of biological characteristics of different types of uterine fibroids, as assessed with T2-weighted magnetic resonance imaging, on ultrasound-guided high intensity focused ultrasound ablation. Ultrasound Med Biol 2015; 41: pp. 423-431.
36. Arthur R., Kachura J., Liu G., et. al.: Laparoscopic myomectomy versus uterine artery embolization: long-term impact on markers of ovarian reserve. J Obstet Gynaecol Can 2014; 36: pp. 240-247.
37. Hehenkamp W.J., Volkers N.A., Broekmans F.J., et. al.: Loss of ovarian reserve after uterine artery embolization: a randomized comparison with hysterectomy. Hum Reprod 2007; 22: pp. 1996-2005.
38. Kim C.H., Shim S.H., Jang H., et. al.: The effects of uterine artery embolization on ovarian reserve. Eur J Obstet Gynecol Reprod Biol 2016; 206: pp. 172-176.
39. Cheung V.Y., Lam T.P., Jenkins C.R., et. al.: Ovarian reserve after ultrasound-guided high-intensity focused ultrasound for uterine fibroids: preliminary experience. J Obstet Gynaecol Can 2016; 38: pp. 357-361.
40. Lee J.S., Hong G.Y., Lee K.H., et. al.: Changes in anti-Müllerian hormone levels as a biomarker for ovarian reserve after ultrasound-guided high-intensity focused ultrasound treatment of adenomyosis and uterine fibroid. BJOG 2017; 124: pp. 18-22.