
Rationale and Objectives
To determine the accuracy of magnetic resonance imaging (MRI) with gadoxetic acid disodium for the detection of hepatocellular carcinoma (HCC).
Materials and Methods
Various databases were searched for original articles published before May 2013. Studies were selected, which performed MRI with gadoxetic acid disodium to detect and diagnose HCC and which presented sufficient data to allow construction of contingency tables. For each study, the true-positive, false-positive, true-negative, and false-negative values were extracted or derived, and 2 × 2 contingency tables were constructed. The heterogeneity test, the threshold effect test, the publication bias analysis, and subgroup analyses were performed.
Results
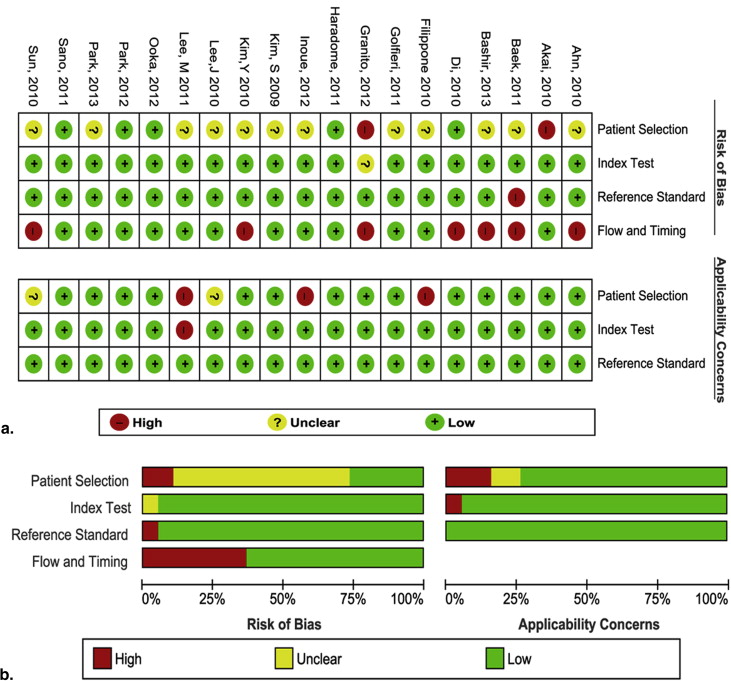
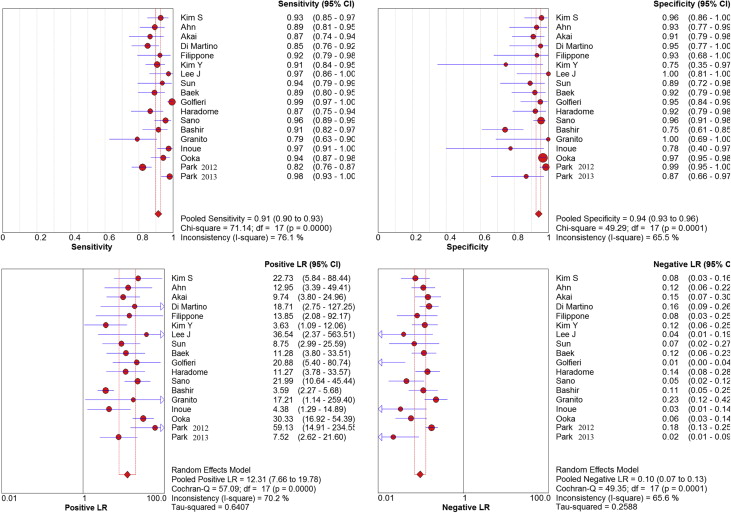
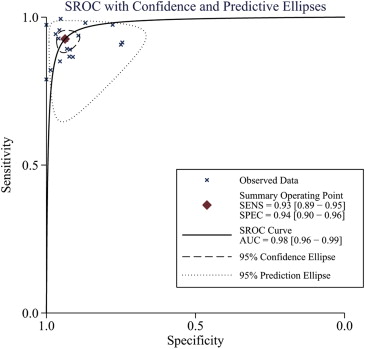
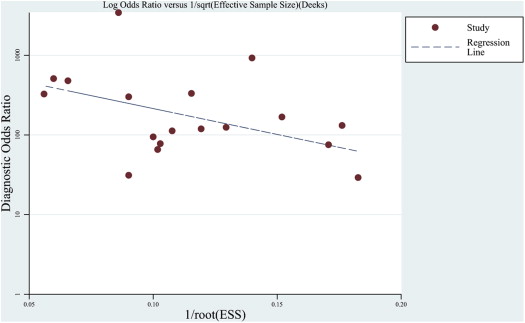
From 623 citations, 18 were included in the meta-analysis with a total of 2572 lesions. We detected heterogeneity between studies and evidence of publication bias. The methodological quality was moderate. The pooled weighted sensitivity was 0.91 (95% confidence interval [CI], 0.90–0.93), the specificity was 0.94 (95% CI, 0.93–0.96), the positive likelihood ratio was 12.31 (95% CI, 7.66–19.78), the negative likelihood ratio was 0.10 (95% CI, 0.07–0.13), and the diagnostic odds ratio was 159.72 (95% CI, 91.72–276.08). The area under the receiver operating characteristic curve was 0.98 (95% CI, 0.96–0.99).
Conclusions
MRI with gadoxetic acid disodium is a noninvasive and no radiation exposure imaging modality with high sensitivity and specificity for the detection of HCC. Nonetheless, it should be applied cautiously in liver nodule <1 cm, and large-scale well-designed trials are necessary to assess its clinical value.
Hepatocellular carcinoma (HCC) is a major contributor to cancer incidence and mortality worldwide . HCC incidence rates have been increasing in the United States among most racial and ethnic groups . The prognosis for HCC has improved in recent years because more cases are diagnosed at an early stage . To provide better treatment options for patients, it is important to improve the diagnostic accuracy of HCC detection methods, especially at early stages of the disease.
To diagnose HCC, some useful, noninvasive, imaging tests, such as computed tomography (CT) and magnetic resonance imaging (MRI), can be used. In contrast to multidetector CT (MDCT) techniques, MRI has emerged as the preferred radiologic tool for the investigation of HCC. Dynamic contrast-enhanced (DCE) MRI with liver-specific contrast agents, such as gadolinium ethoxybenzyl diethylenetriamine pentaacetic acid (gadoxetic acid disodium or Gd-EOB-DTPA, Primovist; Schering, Berlin, Germany) can provide tissue-specific physiological information, thereby facilitating liver cancer characterization . Gadoxetate disodium has several advantageous properties for evaluating liver lesions. After injection, normal areas of the liver exhibit T1 shortening because of specific hepatocyte uptake, whereas most focal liver lesions, such as HCC and hepatic metastases, do not exhibit T1 shortening . Combined with the three-dimensional gradient-echo sequence technique, which provides excellent spatial resolution, gadoxetate disodium–enhanced MRI may be useful in detecting small HCC .
Get Radiology Tree app to read full this article<
Materials and methods
Literature Search
Get Radiology Tree app to read full this article<
Selection of Articles
Get Radiology Tree app to read full this article<
Get Radiology Tree app to read full this article<
Get Radiology Tree app to read full this article<
Get Radiology Tree app to read full this article<
Quality Assessment and Data Extraction
Get Radiology Tree app to read full this article<
Get Radiology Tree app to read full this article<
Meta-analysis
Get Radiology Tree app to read full this article<
Get Radiology Tree app to read full this article<
Get Radiology Tree app to read full this article<
Get Radiology Tree app to read full this article<
Results
Get Radiology Tree app to read full this article<
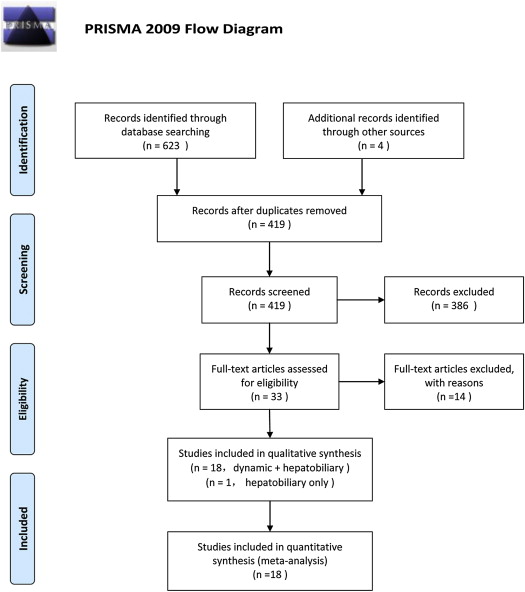
Table 1
Characteristics of the Included Studies
Study Year Nation TP FP FN TN Patient Spectrum Disease Spectrum Size Study Design Blind Field Dose Sequence Kim et al. 2009 Korea 77 2 6 47 CLD or not Suspected HCC 2.9 (0.5–10.5) Retrospective Y 3.0 T 0.1 mL/kg w/o DWI Ahn et al. 2010 Korea 75 2 9 27 CLD or not Suspected HCC 2.8 (0.4–11.0) Retrospective Y 1.5/3.0 T 0.1 mL/kg w/o DWI Akai et al. 2010 Japan 45 4 7 41 CLD or not Suspected HCC 2.6 (0.4–15.2) Prospective Y 1.5 T 0.1 mL/kg w/o DWI Di Martino et al. 2010 Italy 74 1 13 21 CLD only Suspected HCC 1.8 (0.3–7.0) Prospective Y 1.5 T 0.1 mL/kg w/o DWI Filippone et al. 2010 Italy 36 1 3 14 CLD only HCC and DN 3.2 (0.8–7.5) Retrospective Y 1.5 T 0.1 mL/kg w/o DWI Kim et al. 2010 Korea 107 2 11 6 CLD or not Suspected HCC 1.5 (0.6–3.0) Retrospective Y 1.5 T 0.1 mL/kg w/o DWI Lee et al. 2010 Korea 37 0 1 18 CLD only Suspected HCC 2.8 (0.8–10.2) Retrospective Y 3.0 T 0.1 mL/kg w/o DWI Sun et al. 2010 Korea 30 3 2 25 CLD only HCC and AEP ≤2 Retrospective Y 3.0 T 10 mL w/o DWI Baek et al. 2011 Korea 65 3 8 35 CLD only Suspected HCC 2.98 (0.2–10) Retrospective Y 3.0 T 0.1 mL/kg w/o DWI Golfieri et al. 2011 Italy 172 2 1 40 CLD or not Suspected HCC 1.6 (0.4–2.0) Prospective Y 1.5 T 0.1 mL/kg w/o DWI Haradome et al. 2011 Italy 52 3 8 36 CLD or not HCC and DN 1.74 (0.5–2.8) Retrospective Y 1.5 T 0.1 mL/kg w/o DWI Lee et al. ∗ 2011 Korea 21 3 10 8 CLD only Well-differentiated HCC 2.4 (1.4–4.4) Retrospective Y 3.0 T 0.1 mL/kg w/DWI Sano et al. 2011 Japan 87 7 4 154 CLD only HCC and DN 1.3 (0.4–2.0) Retrospective Y 1.5 T 0.1 mL/kg w/o DWI Granito et al. 2012 Italy 30 0 8 10 CLD only Suspected HCC 1.8 (1.0–3.0) Prospective Y 1.5 T 0.1 mL/kg w/o DWI Inoue et al. 2012 Japan 75 2 2 7 CLD only HCC and DN 2.1 (0.6–4.0) Retrospective Y 1.5/3.0 T 0.1 mL/kg w/o DWI Ooka et al. 2012 Japan 82 11 5 343 CLD or not Suspected HCC 1.8 (0.3–6.5) Retrospective Y 1.5 T 0.1 mL/kg w/o DWI Park et al. 2012 Korea 147 3 32 141 CLD or not Suspected HCC 1.6 (0.8–2.0) Retrospective Y 3.0 T 0.1 mL/kg w/DWI Bashir et al. 2013 USA 64 14 6 41 CLD only Suspected HCC — Retrospective Y 1.5/3.0 T 10 mL w/o DWI Park et al. 2013 Korea 100 3 2 20 CLD only Suspected HCC 1.3 (0.6–2.0) Retrospective Y 3.0 T 0.1 mL/kg w/DWI
AEP, arterial-enhancing pseudolesions; CLD, chronic liver disease; DN, dysplastic nodule; DWI, diffusion-weighted imaging; HCC, hepatocellular carcinoma; w/o DWI, without DWI; w/DWI, without DWI.
Get Radiology Tree app to read full this article<
Get Radiology Tree app to read full this article<
Get Radiology Tree app to read full this article<
Get Radiology Tree app to read full this article<
Get Radiology Tree app to read full this article<
Get Radiology Tree app to read full this article<
Table 2
Sensitivity and Specificity Estimates for Each Subgroup
Subgroup Number of Studies Sensitivity (%) Specificity (%) Lesion size ≥20 mm 12 91 (90–93) 94 (93–96) <20 mm 7 85 (82–88) 94 (93–97) <10 mm 2 73 (63–82) 97 (87–100) Reference standard Histopathologic only 9 93 (91–95) 96 (95–97) Histopathologic and other 9 89 (86–91) 88 (83–92) Magnetic field strength 1.5 T 9 91 (90–93) 96 (94–97) 3.0 T 6 90 (88–92) 96 (93–98) 1.5 T/3.0 T 3 92 (90–93) 94 (92–96) Study design Retrospective 12 92 (90–93) 96 (94–97) Prospective 6 91 (88–93) 89 (84–93) Patient spectrum CLD only 10 91 (88–92) 93 (90–95) CLD or not 8 92 (90–94) 95 (93–97) Sequences With DWI 2 89 (85–94) 96 (92–99) Without DWI 17 91 (89–93) 94 (93–96)
CLD, chronic liver disease; DWI, diffusion-weighted imaging.
Numbers in parentheses are the 95% confidence intervals.
Get Radiology Tree app to read full this article<
Get Radiology Tree app to read full this article<
Get Radiology Tree app to read full this article<
Discussion
Get Radiology Tree app to read full this article<
Get Radiology Tree app to read full this article<
Get Radiology Tree app to read full this article<
Get Radiology Tree app to read full this article<
Get Radiology Tree app to read full this article<
Get Radiology Tree app to read full this article<
Get Radiology Tree app to read full this article<
Get Radiology Tree app to read full this article<
Conclusions
Get Radiology Tree app to read full this article<
Appendix
Get Radiology Tree app to read full this article<
 PRISMA 2009 Checklist
From: Moher D, Liberati A, Tetzlaff J, Altman DG, The PRISMA Group (2009). Preferred reporting items for systematic reviews and meta-analyses: The PRISMA Statement. PLoS Med 6(6): e1000097. http://dx.doi.org/10.1371/journal.pmed1000097 .
Section/topic # Checklist item Reported on page #TITLE Title 1 Identify the report as a systematic review, meta-analysis, or both. TitleABSTRACT Structured summary 2 Provide a structured summary including, as applicable: background; objectives; data sources; study eligibility criteria, participants, and interventions; study appraisal and synthesis methods; results; limitations; conclusions and implications of key findings; systematic review registration number. AbstractINTRODUCTION Rationale 3 Describe the rationale for the review in the context of what is already known. Introduction Objectives 4 Provide an explicit statement of questions being addressed with reference to participants, interventions, comparisons, outcomes, and study design (PICOS). IntroductionMETHODS Protocol and registration 5 Indicate if a review protocol exists, if and where it can be accessed (e.g., Web address), and, if available, provide registration information including registration number. Eligibility criteria 6 Specify study characteristics (e.g., PICOS, length of follow-up) and report characteristics (e.g., years considered, language, publication status) used as criteria for eligibility, giving rationale. Selection of articles Information sources 7 Describe all information sources (e.g., databases with dates of coverage, contact with study authors to identify additional studies) in the search and date last searched. Literature search Search 8 Present full electronic search strategy for at least one database, including any limits used, such that it could be repeated. Literature search Study selection 9 State the process for selecting studies (i.e., screening, eligibility, included in systematic review, and, if applicable, included in the meta-analysis). Selection of articles Data collection process 10 Describe method of data extraction from reports (e.g., piloted forms, independently, in duplicate) and any processes for obtaining and confirming data from investigators. data extraction Data items 11 List and define all variables for which data were sought (e.g., PICOS, funding sources) and any assumptions and simplifications made. data extraction Risk of bias in individual studies 12 Describe methods used for assessing risk of bias of individual studies (including specification of whether this was done at the study or outcome level), and how this information is to be used in any data synthesis. Quality assessment Summary measures 13 State the principal summary measures (e.g., risk ratio, difference in means). Meta-analysis Synthesis of results 14 Describe the methods of handling data and combining results of studies, if done, including measures of consistency (e.g., I 2 ) for each meta-analysis. Meta-analysis Risk of bias across studies 15 Specify any assessment of risk of bias that may affect the cumulative evidence (e.g., publication bias, selective reporting within studies). Quality assessment Additional analyses 16 Describe methods of additional analyses (e.g., sensitivity or subgroup analyses, meta-regression), if done, indicating which were pre-specified. Meta-analysisRESULTS Study selection 17 Give numbers of studies screened, assessed for eligibility, and included in the review, with reasons for exclusions at each stage, ideally with a flow diagram. Results Study characteristics 18 For each study, present characteristics for which data were extracted (e.g., study size, PICOS, follow-up period) and provide the citations. Results Risk of bias within studies 19 Present data on risk of bias of each study and, if available, any outcome level assessment (see item 12). Results Results of individual studies 20 For all outcomes considered (benefits or harms), present, for each study: (a) simple summary data for each intervention group (b) effect estimates and confidence intervals, ideally with a forest plot. Results Synthesis of results 21 Present results of each meta-analysis done, including confidence intervals and measures of consistency. Results Risk of bias across studies 22 Present results of any assessment of risk of bias across studies (see Item 15). Results Additional analysis 23 Give results of additional analyses, if done (e.g., sensitivity or subgroup analyses, meta-regression [see Item 16]). ResultsDISCUSSION Summary of evidence 24 Summarize the main findings including the strength of evidence for each main outcome; consider their relevance to key groups (e.g., healthcare providers, users, and policy makers). Discussion Limitations 25 Discuss limitations at study and outcome level (e.g., risk of bias), and at review-level (e.g., incomplete retrieval of identified research, reporting bias). Discussion Conclusions 26 Provide a general interpretation of the results in the context of other evidence, and implications for future research. DiscussionFUNDING Funding 27 Describe sources of funding for the systematic review and other support (e.g., supply of data); role of funders for the systematic review. Funding Statement
For more information, visit: www.prisma-statement.org .
Get Radiology Tree app to read full this article<
Get Radiology Tree app to read full this article<
Get Radiology Tree app to read full this article<
References
1. McGlynn K.A., London W.T.: The global epidemiology of hepatocellular carcinoma: present and future. Clin Liver Dis 2011; 15: pp. 223-243. vii-x
2. Jemal A., Bray F., Center M.M., et. al.: Global cancer statistics. CA: A Cancer J Clin 2011; 61: pp. 69-90.
3. Altekruse S.F., McGlynn K.A., Dickie L.A., et. al.: Hepatocellular carcinoma confirmation, treatment, and survival in surveillance, epidemiology, and end results registries, 1992–2008. Hepatology 2012; 55: pp. 476-482.
4. Ba-Ssalamah A., Uffmann M., Saini S., et. al.: Clinical value of MRI liver-specific contrast agents: a tailored examination for a confident non-invasive diagnosis of focal liver lesions. Eur Radiol 2009; 19: pp. 342-357.
5. Motosugi U., Ichikawa T., Sou H., et. al.: Distinguishing hypervascular pseudolesions of the liver from hypervascular hepatocellular carcinomas with gadoxetic acid-enhanced MR imaging. Radiology 2010; 256: pp. 151-158.
6. Hamm B., Staks T., Muhler A., et. al.: Phase I clinical evaluation of Gd-EOB-DTPA as a hepatobiliary MR contrast agent: safety, pharmacokinetics, and MR imaging. Radiology 1995; 195: pp. 785-792.
7. Reimer P., Rummeny E.J., Shamsi K., et. al.: Phase II clinical evaluation of Gd-EOB-DTPA: dose, safety aspects, and pulse sequence. Radiology 1996; 199: pp. 177-183.
8. Kim S.H., Lee J., Kim M.J., et. al.: Gadoxetic acid-enhanced MRI versus triple-phase MDCT for the preoperative detection of hepatocellular carcinoma. AJR Am J Roentgenol 2009; 192: pp. 1675-1681.
9. Filippone A., C R., Patriarca G., et. al.: The value of gadoxetic acid-enhanced hepatospecific phase MR imaging for characterization of hepatocellular nodules in the cirrhotic liver. European J Clin Med Oncol 2010; 2: pp. p1.
10. Baek C.K., Choi J.Y., Kim K.A., et. al.: Hepatocellular carcinoma in patients with chronic liver disease: a comparison of gadoxetic acid-enhanced MRI and multiphasic MDCT. Clin Radiol 2012; 67: pp. 148-156.
11. Park M.J., Kim Y.K., Lee M.W., et. al.: Small hepatocellular carcinomas: improved sensitivity by combining gadoxetic acid-enhanced and diffusion-weighted MR imaging patterns. Radiology 2012; 264: pp. 761-770.
12. Di Martino M., Marin D., Guerrisi A., et. al.: Intraindividual comparison of gadoxetate disodium-enhanced MR imaging and 64-section multidetector CT in the detection of hepatocellular carcinoma in patients with cirrhosis. Radiology 2010; 256: pp. 806-816.
13. Sano K., Ichikawa T., Motosugi U., et. al.: Imaging study of early hepatocellular carcinoma: usefulness of gadoxetic acid-enhanced MR imaging. Radiology 2011; 261: pp. 834-844.
14. Golfieri R., Renzulli M., Lucidi V., et. al.: Contribution of the hepatobiliary phase of Gd-EOB-DTPA-enhanced MRI to dynamic MRI in the detection of hypovascular small (≤2 cm) HCC in cirrhosis. Eur Radiol 2011; 21: pp. 1233-1242.
15. Sun H.Y., Lee J.M., Shin C.I., et. al.: Gadoxetic acid-enhanced magnetic resonance imaging for differentiating small hepatocellular carcinomas (< or =2 cm in diameter) from arterial enhancing pseudolesions: special emphasis on hepatobiliary phase imaging. Invest Radiol 2010; 45: pp. 96-103.
16. Inoue T., Kudo M., Komuta M., et. al.: Assessment of Gd-EOB-DTPA-enhanced MRI for HCC and dysplastic nodules and comparison of detection sensitivity versus MDCT. J Gastroenterol 2012; 47: pp. 1036-1047.
17. Lee M.H., Kim S.H., Park M.J., et. al.: Gadoxetic acid-enhanced hepatobiliary phase MRI and high-b-value diffusion-weighted imaging to distinguish well-differentiated hepatocellular carcinomas from benign nodules in patients with chronic liver disease. AJR Am J Roentgenol 2011; 197: pp. W868-W875.
18. Lee J.Y., Kim S.H., Jeon Y.H., et. al.: Ferucarbotran-enhanced magnetic resonance imaging versus gadoxetic acid-enhanced magnetic resonance imaging for the preoperative detection of hepatocellular carcinoma: initial experience. J Computer Assist Tomogr 2010; 34: pp. 127-134.
19. Kim Y.K., Kim C.S., Han Y.M., et. al.: Comparison of gadoxetic acid-enhanced MRI and superparamagnetic iron oxide-enhanced MRI for the detection of hepatocellular carcinoma. Clin Radiol 2010; 65: pp. 358-365.
20. Akai H., Kiryu S., Matsuda I., et. al.: Detection of hepatocellular carcinoma by Gd-EOB-DTPA-enhanced liver MRI: Comparison with triple phase 64 detector row helical CT. Eur J Radiol 2010; 80: pp. 310-315.
21. Haradome H., Grazioli L., Tinti R., et. al.: Additional value of gadoxetic acid-DTPA-enhanced hepatobiliary phase MR imaging in the diagnosis of early-stage hepatocellular carcinoma: comparison with dynamic triple-phase multidetector CT imaging. J Magn Reson Imaging 2011; 34: pp. 69-78.
22. Ahn S.S., Kim M.J., Lim J.S., et. al.: Added value of gadoxetic acid-enhanced hepatobiliary phase MR imaging in the diagnosis of hepatocellular carcinoma. Radiology 2010; 255: pp. 459-466.
23. Bashir M.R., Gupta R.T., Davenport M.S., et. al.: Hepatocellular carcinoma in a North American population: does hepatobiliary MR imaging with Gd-EOB-DTPA improve sensitivity and confidence for diagnosis?. J Magn Reson Imaging 2013; 37: pp. 398-406.
24. Ooka Y., Kanai F., Okabe S., et. al.: Gadoxetic acid-enhanced MRI compared with CT during angiography in the diagnosis of hepatocellular carcinoma. Magn Reson Imaging 2012; 31: pp. 748-754.
25. Park M.J., Kim Y.K., Lee M.H., et. al.: Validation of diagnostic criteria using gadoxetic acid-enhanced and diffusion-weighted MR imaging for small hepatocellular carcinoma (<= 2.0 cm) in patients with hepatitis-induced liver cirrhosis. Acta Radiol 2013; 54: pp. 127-136.
26. Granito A., Galassi M., Piscaglia F., et. al.: Impact of gadoxetic acid (Gd-EOB-DTPA)-enhanced magnetic resonance on the non-invasive diagnosis of small hepatocellular carcinoma: a prospective study. Aliment Pharmacol Ther 2013; 37: pp. 355-363.
27. Liu X., Zou L., Liu F., et. al.: Gadoxetic acid disodium-enhanced magnetic resonance imaging for the detection of hepatocellular carcinoma: a meta-analysis. PloS One 2013; 8: pp. e70896.
28. Whiting P., Rutjes A.W., Reitsma J.B., et. al.: The development of QUADAS: a tool for the quality assessment of studies of diagnostic accuracy included in systematic reviews. BMC Med Res Methodol 2003; 3: pp. 25.
29. Whiting P.F., Weswood M.E., Rutjes A.W., et. al.: Evaluation of QUADAS, a tool for the quality assessment of diagnostic accuracy studies. BMC Med Res Methodol 2006; 6: pp. 9.
30. Whiting P.F., Rutjes A.W., Westwood M.E., et. al.: QUADAS-2: a revised tool for the quality assessment of diagnostic accuracy studies. Ann Intern Med 2011; 155: pp. 529-536.
31. Higgins J.P., Thompson S.G., Deeks J.J., et. al.: Measuring inconsistency in meta-analyses. BMJ 2003; 327: pp. 557-560.
32. Leeflang M.M., Deeks J.J., Gatsonis C., et. al.: Systematic reviews of diagnostic test accuracy. Ann Intern Med 2008; 149: pp. 889-897.
33. Zamora J., Abraira V., Muriel A., et. al.: Meta-DiSc: a software for meta-analysis of test accuracy data. BMC Med Res Methodol 2006; 6: pp. 31.
34. Moses L.E., Shapiro D., Littenberg B.: Combining independent studies of a diagnostic test into a summary ROC curve: data-analytic approaches and some additional considerations. Stat Med 1993; 12: pp. 1293-1316.
35. Reitsma J.B., Glas A.S., Rutjes A.W., et. al.: Bivariate analysis of sensitivity and specificity produces informative summary measures in diagnostic reviews. J Clin Epidemiol 2005; 58: pp. 982-990.
36. Menke J.: Bivariate random-effects meta-analysis of sensitivity and specificity with SAS PROC GLIMMIX. Methods Inf Med 2010; 49: pp. 54-62. 62-4
37. StataCorp: Stata Statistical Software: Release 10.2009.College StationTexas
38. Deeks J.J., Macaskill P., Irwig L.: The performance of tests of publication bias and other sample size effects in systematic reviews of diagnostic test accuracy was assessed. J Clin Epidemiol 2005; 58: pp. 882-893.
39. Zech C.J., Grazioli L., Breuer J., et. al.: Diagnostic performance and description of morphological features of focal nodular hyperplasia in Gd-EOB-DTPA-enhanced liver magnetic resonance imaging: results of a multicenter trial. Invest Radiol 2008; 43: pp. 504-511.
40. Grazioli L., Bondioni M.P., Haradome H., et. al.: Hepatocellular adenoma and focal nodular hyperplasia: value of gadoxetic acid-enhanced MR imaging in differential diagnosis. Radiology 2012; 262: pp. 520-529.
41. Chen L., Zhang J., Zhang L., et. al.: Meta-analysis of gadoxetic acid disodium (Gd-EOB-DTPA)-enhanced magnetic resonance imaging for the detection of liver metastases. PloS One 2012; 7: pp. e48681.
42. Bruix J., Sherman M.: Management of hepatocellular carcinoma: an update. Hepatology 2011; 53: pp. 1020-1022.
43. EASL-EORTC clinical practice guidelines: management of hepatocellular carcinoma. Eur J Cancer 2012; 48: pp. 599-641.
44. Chernyak V., Kim J., Rozenblit A.M., et. al.: Hepatic enhancement during the hepatobiliary phase after gadoxetate disodium administration in patients with chronic liver disease: the role of laboratory factors. J Magn Reson Imaging 2011; 34: pp. 301-309.
45. American College of Radiology. Quality and safety resources: Liver Imaging–Reporting and Data System.; Available at: http://www.acr.org/Quality-Safety/Resources/LIRADS . Accessed August 3, 2014.
46. Rutjes A.W., Reitsma J.B., Di Nisio M., et. al.: Evidence of bias and variation in diagnostic accuracy studies. CMAJ 2006; 174: pp. 469-476.
47. Brazzelli M., Sandercock P.A., Chappell F.M., et. al.: Magnetic resonance imaging versus computed tomography for detection of acute vascular lesions in patients presenting with stroke symptoms. Cochrane Database Syst Rev 2009; pp. CD007424.
48. McAuley L., Pham B., Tugwell P., et. al.: Does the inclusion of grey literature influence estimates of intervention effectiveness reported in meta-analyses?. Lancet 2000; 356: pp. 1228-1231.