
Rationale and Objectives
To investigate agreement on mammographic breast density (MD) assessment between automated volumetric software and Breast Imaging Reporting and Data System (BIRADS) categorization by expert radiologists.
Materials and Methods
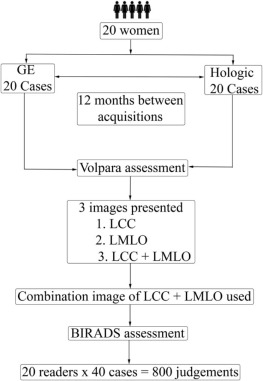
Forty cases of left craniocaudal and mediolateral oblique mammograms from 20 women were used. All images had their volumetric density classified using Volpara density grade (VDG) and average volumetric breast density percentage. The same images were then classified into BIRADS categories (I–IV) by 20 American Board of Radiology examiners.
Results
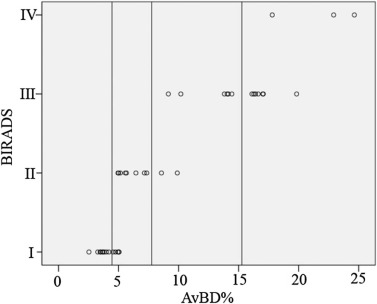
The results demonstrated a moderate agreement (κ = 0.537; 95% CI = 0.234–0.699) between VDG classification and radiologists’ BIRADS density assessment. Interreader agreement using BIRADS also demonstrated moderate agreement (κ = 0.565; 95% CI = 0.519–0.610) ranging from 0.328 to 0.669. Radiologists’ average BIRADS was lower than average VDG scores by 0.33, with their mean being 2.13, whereas the mean VDG was 2.48 (U = −3.742; P < 0.001). VDG and BIRADS showed a very strong positive correlation (ρ = 0.91; P < 0.001) as did BIRADS and average volumetric breast density percentage (ρ = 0.94; P < 0.001).
Conclusions
Automated volumetric breast density assessment shows moderate agreement and very strong correlation with BIRADS; interreader variations still exist within BIRADS. Because of the increasing importance of MD measurement in clinical management of patients, widely accepted, reproducible, and accurate measures of MD are required.
Introduction
Women with dense breasts have a two- to sixfold increased risk of breast cancer compared to fatty breasts . Mammographic density (MD), the most common measure of breast density, is defined by the relative amount of fat and fibroglandular tissue in the breast as seen on a mammogram. This is usually expressed as a percentage, where MD is the proportion of the breast area on a mammogram that is radiodense or opaque . However, area-based, two-dimensional measures of MD such as semiautomated Cumulus do not take the volume of density into account. It has been proposed that MD might be used to stratify women into different screening regimes, such as increasing the frequency of screening or using adjunctive imaging modalities for women with dense breasts . However, this would rely on reproducible and accurate measurement of MD, which to date has proven to be troublesome . Measurement reproducibility is important if MD is to be incorporated into breast screening imaging pathways and cancer risk predictive models .
There is no gold standard method for measuring actual breast density, although attempts to quantify this feature using mammography are well reported. The most common (conventional) method in practice involves visual (qualitative) assessment by the radiologist, for example, the fourth edition of the Breast Imaging Reporting and Data System (BIRADS) , which defines MD from I (describing an entirely fatty breast) to IV (representing an extremely dense breast) . The recent update in the BIRADS standard changed numbered categories to letters and removed percentage descriptors from the four categories .
Get Radiology Tree app to read full this article<
Get Radiology Tree app to read full this article<
Get Radiology Tree app to read full this article<
Get Radiology Tree app to read full this article<
Get Radiology Tree app to read full this article<
Materials and Methods
Get Radiology Tree app to read full this article<
Selection of Images
Get Radiology Tree app to read full this article<
Image Display and MD Quantification using BIRADS
Get Radiology Tree app to read full this article<
Get Radiology Tree app to read full this article<
Breast Density Quantification Using Volpara Automated Software
Get Radiology Tree app to read full this article<
Agreement Between BIRADS and Volpara (VDG and AvBD%)
Get Radiology Tree app to read full this article<
Statistics
Get Radiology Tree app to read full this article<
Results
Get Radiology Tree app to read full this article<
Get Radiology Tree app to read full this article<
Get Radiology Tree app to read full this article<
Correlation Between BIRADS and Volpara (VDG and AvBD%)
Get Radiology Tree app to read full this article<
Agreement Between BIRADS and Volpara (VDG and AvBD%)
Get Radiology Tree app to read full this article<
Table 1
Mean Difference in Time Spent on Each BIRADS Category Assessment by Radiologists
BIRADS BIRADS Mean Difference Std. Error_P_ Value 95% Confidence Interval Lower Bound Upper Bound I II −0.55317 .51747 1.000 −1.9218 .8155 III −2.54092 \* .49325 .000 −3.8455 −1.2363 IV −3.96609 \* .74457 .000 −5.9354 −1.9968 II III −1.98775 \* .52820 .001 −3.3848 −.5907 IV −3.41293 \* .76817 .000 −5.4446 −1.3812 III IV −1.42518 .75207 .351 −3.4143 .5640
Get Radiology Tree app to read full this article<
Get Radiology Tree app to read full this article<
Get Radiology Tree app to read full this article<
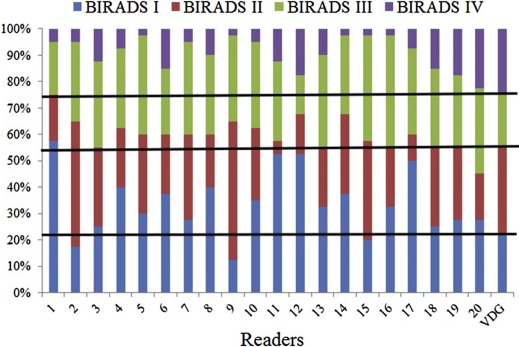
Interreader Agreement on BIRADS Categorization
Get Radiology Tree app to read full this article<
Get Radiology Tree app to read full this article<
Get Radiology Tree app to read full this article<
Table 2
The Number of Images Allocated to BIRADS Categories I, II, II, and IV in Our Research Setting and VDG Categories 1, 2, 3, and 4 as well as the Number of Images on which BIRADS and VGD Agreed for Each Category (Shown in Squares)
VDG Total 1 2 3 4 BIRADS I 9 5 0 0 14 II 0 8 2 0 10 III 0 0 6 7 13 IV 0 0 0 3 3 Total 9 13 8 10 40
Get Radiology Tree app to read full this article<
Discussion
Get Radiology Tree app to read full this article<
Comparison Between BIRADS and Volpara MD Assessments
Get Radiology Tree app to read full this article<
Get Radiology Tree app to read full this article<
Get Radiology Tree app to read full this article<
Get Radiology Tree app to read full this article<
Get Radiology Tree app to read full this article<
Get Radiology Tree app to read full this article<
Get Radiology Tree app to read full this article<
Get Radiology Tree app to read full this article<
Conclusions
Get Radiology Tree app to read full this article<
Acknowledgments
Get Radiology Tree app to read full this article<
References
1. McCormack V.A., dos Santos Silva I.: Breast density and parenchymal patterns as markers of breast cancer risk: a meta-analysis. Cancer Epidemiol Biomarkers Prev 2006; 15: pp. 1159-1169.
2. Ursin G.Q.S.: Mammographic density—a useful biomarker for the breast cancer risk in epidemiologic studies. Norsk Epidermiologi 2009; 19: pp. 59-68.
3. Yaffe M.J.: Mammographic density. Measurement of mammographic density. Breast Cancer Res 2008; 10: pp. 209.
4. Harvey J.A., Bovbjerg V.E.: Quantitative assessment of mammographic breast density: relationship with breast cancer risk. Radiology 2004; 230: pp. 29-41.
5. Ng K.H., Yip C.H., Taib N.A.M.: Standardisation of clinical breast-density measurement. Lancet Oncol 2012; 13: pp. 334-336.
6. Shepherd J.A., Kerlikowske K., Ma L., et. al.: Volume of mammographic density and risk of breast cancer. Cancer Epidemiol Biomarkers Prev 2011; 20: pp. 1473-1482.
7. D’Orsi C.J., Bassett L.W., Berg W.A., et. al.: BI-RADS mammography.D’Orsi C.J.Mendelson E.B.Ikeda D.M. et. al.Breast imaging reporting and data system: ACR BI-RADS—breast imaging atlas.2003.American College of RadiologyReston, VA:pp. 61-128.
8. Radiology ACo : The American College of radiology BIRADS ATLAS and MQSA: frequently asked questions. Available at: http://www.acr.org/~/media/ACR/Documents/PDF/QualitySafety/Resources/BIRADS/BIRADSFAQs.pdf Accessed September 25
9. Radiology ACo : BI-RADS mammography 2013-ACR BI-RADS atlas.5th ed.2014. Available at: http://www.acr.org/Quality-Safety/Resources/BIRADS Accessed March 17
10. Andersson I., Ikeda D.M., Zackrisson S., et. al.: Breast tomosynthesis and digital mammography: a comparison of breast cancer visibility and BIRADS classification in a population of cancers with subtle mammographic findings. Eur Radiol 2008; 18: pp. 2817-2825.
11. Duffy S.W., Nagtegaal I.D., Astley S.M., et. al.: Visually assessed breast density, breast cancer risk and the importance of the craniocaudal view. Breast Cancer Res 2008; 10: pp. R64.
12. Nicholson B.T., LoRusso A.P., Smolkin M., et. al.: Accuracy of assigned BI-RADS breast density category definitions. Acad Radiol 2006; 13: pp. 1143-1149.
13. Zhou C., Chan H.P., Petrick N., et. al.: Computerized image analysis: estimation of breast density on mammograms. Med Phys 2001; 28: pp. 1056-1069.
14. McCormack V.A., Highnam R., Perry N., et. al.: Comparison of a new and existing method of mammographic density measurement: intramethod reliability and associations with known risk factors. Cancer Epidemiol Biomarkers Prev 2007; 16: pp. 1148-1154.
15. Ciatto S., Bernardi D., Calabrese M., et. al.: A first evaluation of breast radiological density assessment by QUANTRA software as compared to visual classification. Breast 2012; 21: pp. 503-506.
16. Ooms E.A., Zonderland H.M., Eijkemans M.J.C., et. al.: Mammography: interobserver variability in breast density assessment. Breast 2007; 16: pp. 568-576.
17. Highnam R., Brady M., Yaffe M.J., et. al.: Robust breast composition measurement: Volpara.Marti J.Oliver A.Freixenet J. et. al.Digital mammography.2010.pp. 342-349.
18. Tagliafico A., Tagliafico G., Tosto S., et. al.: Mammographic density estimation: comparison among BI-RADS categories, a semi-automated software and a fully automated one. Breast 2009; 18: pp. 35-40.
19. Byng J.W., Boyd N.F., Fishell E., et. al.: Automated analysis of mammographic densities. Phys Med Biol 1996; 41: pp. 909-923.
20. Alonzo-Proulx O., Mawdsley G.E., Patrie J.T., et. al.: Reliability of automated breast density measurement. Radiology 2015; 275: pp. 366-376.
21. Sauber N., Chan A., Highnam R.: BI-RADS breast density classification—an international standard. ECR2013.
22. Wang K., Chan A., Highnam R.: Robustness of automated volumetric breast density estimation for assessing temporal changes in breast density. ECR2015.
23. Gweon H.M., Youk J.H., Kim J.A., et. al.: Radiologist assessment of breast density by BI-RADS categories versus fully automated volumetric assessment. Am J Roentgenol 2013; 201: pp. 692-697.
24. Damases C.N., Brennan P.C., McEntee M.F.: Mammographic density measurements are not affected by mammography system. J Med Imag 2015; 2: pp. 15501-15505.
25. McEntee M.F., Damases C.N.: Mammographic density measurement: a comparison of automated volumetric density measurement to BIRADS. Med Imag 2014: Image Percept, Obs Perform, Technol Assess 2014; 9037: pp. 8.
26. Wanders J.O., Holland K., Veldhuis W.B., et. al.: Effect of volumetric mammographic density on performance of a breast cancer screening program using full-field digital mammography. ECR2015.
27. Börjesson S., Håkansson M., Båth M., et. al.: A software tool for increased efficiency in observer performance studies in radiology. Radiat Prot Dosimetry 2005; 114: pp. 45-52.
28. Brennan P.C., McEntee M., Evanoff M., et. al.: Ambient lighting: effect of illumination on soft-copy viewing of radiographs of the wrist. Am J Roentgenol 2007; 188: pp. W177-W180.
29. Volpara Solutions : Volpara clinical breast density and its implications for your patients. Available at: http://www.volparadensity.com/clinicians/ Accessed March 27
30. Berg W.A., Campassi C., Langenberg P., et. al.: Breast imaging reporting and data system: inter- and intraobserver variability in feature analysis and final assessment. Am J Roentgenol 2000; 174: pp. 1769-1777.
31. Viera A.J., Garrett J.M.: Understanding interobserver agreement: the kappa statistic. Fam Med 2005; 37: pp. 360-363.
32. Martin K.E., Helvie M.A., Zhou C., et. al.: Mammographic density measured with quantitative computer-aided method: comparison with radiologists’ estimates and BI-RADS categories. Radiology 2006; 240: pp. 656-665.
33. Ciatto S., Houssami N., Apruzzese A., et. al.: Categorizing breast mammographic density: intra- and interobserver reproducibility of BI-RADS density categories. Breast 2005; 14: pp. 269-275.
34. Kerlikowske K., Grady D., Barclay J., et. al.: Variability and accuracy in mammographic interpretation using the American College of Radiology Breast Imaging Reporting and Data System. J Natl Cancer Inst 1998; 90: pp. 1801-1809.
35. Jeffreys M., Harvey J., Highnam R.: Comparing a new volumetric breast density method (Volpara™) to Cumulus.Marti J.Oliver A.Freixenet J. et. al.Digital mammography.2010.Springer-Verlag BerlinBerlin:pp. 408-413.
36. Byng J.W., Boyd N.F., Fishell E., et. al.: The quantitative analysis of mammographic densities. Phys Med Biol 1994; 39: pp. 1629-1638.
37. Byng J.W., Yaffe M.J., Jong R.A., et. al.: Analysis of mammographic density and breast cancer risk from digitized mammograms. Radiographics 1998; 18: pp. 1587-1598.
38. Boyd N.F., Byng J.W., Jong R.A., et. al.: Quantitative classification of mammographic densities and breast cancer risk: results from the Canadian National Breast Screening Study. J Natl Cancer Inst 1995; 87: pp. 670-675.
39. Morris O.W.E., Tucker L., Black R., et. al.: Mammographic breast density: comparison of methods for qualitative evaluation. Radiology 2015; 275: pp. 356-365.
40. Holland K., Kallenberg M., Mann R., et. al.: Stability of volumetric tissue composition measured in serial screening mammograms.Fujita H.Hara T.Muramatsu C.Breast imaging.2014.Springer International PublishingSwitzerland:pp. 239-244.
41. Schilling K., The J., Griff S., et. al.: Impact of quantitative breast density on experienced radiologists’ assessment of mammographic breast density.2015.European Congress of RadiologyVienna, Austria: C-1281
42. Elmore J.G., Wells C.K., Lee C.H., et. al.: Variability in radiologists’ interpretations of mammograms. NEJM 1994; 331: pp. 1493-1499.