
Rationale and Objectives
To investigate the impact of breast density on the performance of radiologists when mammograms are digitally acquired and displayed.
Materials and Methods
A total of 150 craniocaudal digital mammograms including 75 cases with cancer were examined by 14 radiologists divided into two groups: those who read more (six) and less (eight) than 2000 mammograms per year. Cases were classified as low or high mammographic density. For both types of cases, detection of cancers within and outside the dense fibroglandular tissue was investigated. The performance of radiologist was measured using jack-knife free-response receiver operating characteristic (JAFROC) figure of merit (FOM).
Results
Radiologists with over 2000 annual reads had significantly higher JAFROC FOM ( P = .03) for high (0.76) mammographic density compared to low (0.70) mammographic density cases. When lesions overlaid the fibroglandular tissue, cases with high mammographic density compared to low mammographic density displayed increased location sensitivity for all radiologists ( P = .03) and for those radiologists reading more than 2000 mammograms annually ( P = .04), whereas JAFROC FOMs increased for all radiologists ( P = .05). No significant changes were observed when the lesion was outside the fibroglandular region.
Conclusions
Increased mammographic density improves the performance of experienced radiologists when using digital mammograms. This finding, which does not align with those previously reported for film screen systems, may be because of windowing/leveling opportunities available with digital images.
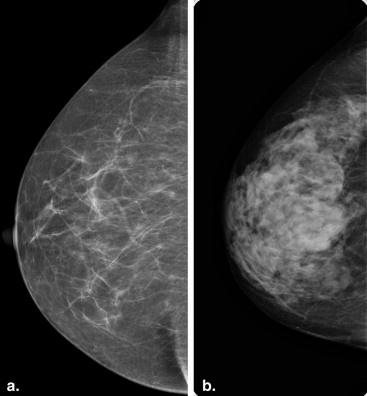
Mammography is the leading imaging modality for early detection of breast cancer, and as a screening tool it has significantly decreased breast cancer mortality . Mammographic images depict adipose and fibroglandular tissues, with the latter appearing as visually bright because of its higher attenuation coefficient compared to the more radiolucent adipose tissue . The visual representation of increased amounts of fibroglandular tissue is often referred to as mammographic density .
Previous studies have shown that increased mammographic density is associated with higher risk of missed malignancies and interval cancers , with sensitivity dropping from 80%–98% in fatty breasts to 29%–75% in mammographically dense breasts . In addition, increased numbers of large screen-detected tumors (>15 mm) , higher recall rates , and decreased efficiency of breast screening programs have all been linked to high levels of mammographic density.
Get Radiology Tree app to read full this article<
Get Radiology Tree app to read full this article<
Get Radiology Tree app to read full this article<
Materials and methods
Get Radiology Tree app to read full this article<
Table 1
Demographic Details on Participating Radiologists
Radiologist Grouping Radiologist Number Age Years as a Certified Radiologist Years Reading Mammography Number of Mammograms Read per Year Read over 2000 mammograms/yr 1 43 14 13 20,000 2 61 27 25 5500 3 47 14 13 5000 4 39 12 11 2500 5 56 25 16 2000 6 48 11 5 2000 Mean 49 17.2 13.9 6166.7 Read under 2000 mammograms/yr 7 31 5 2 1000 8 31 3 1 500 9 66 43 20 500 10 42 1.5 1 300 11 36 10 3 100 12 40 12 11 50 13 37 5 1 20 14 ∗ 32 1 1 N/A Mean 39.4 10.1 4.9 352.9
Get Radiology Tree app to read full this article<
Get Radiology Tree app to read full this article<
Get Radiology Tree app to read full this article<
Selection of Images
Get Radiology Tree app to read full this article<
Get Radiology Tree app to read full this article<
Get Radiology Tree app to read full this article<
Get Radiology Tree app to read full this article<
Get Radiology Tree app to read full this article<
Get Radiology Tree app to read full this article<
Get Radiology Tree app to read full this article<
Get Radiology Tree app to read full this article<
Table 2
Number and Lesion Diameter in High- and Low-Density Cases
Case Type Number of Lesions Median Lesion Diameter (mm) (IQR) Low-density cases 41 12.7 (5.8) High-density cases 37 12 (3.2) Low-density cases with lesion overlaying fibroglandular region 20 11.8 (5.5) Low-density cases with lesion outside fibroglandular region 21 12.8 (6.4) High-density cases with lesion overlaying fibroglandular region 21 12.0 (5.2) High-density cases with lesion outside fibroglandular region 16 11.6 (2.3)
IQR, interquartile range.
Get Radiology Tree app to read full this article<
Get Radiology Tree app to read full this article<
Get Radiology Tree app to read full this article<
Get Radiology Tree app to read full this article<
Table 3
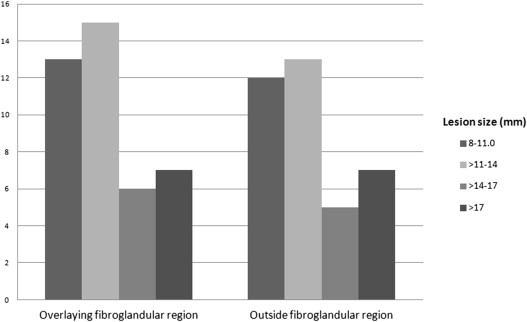
Distribution of Lesion Types Overlaying or Outside the Fibroglandular Dense Tissue
Lesion Type Lesions Overlaying the Fibroglandular Region Lesions outside the Fibroglandular Region Calcification 3 1 Focal asymmetry 8 6 Architectural distortion 10 2 Round ill-defined mass 5 6 Oval ill-defined mass 4 5 Lobular ill-defined mass 4 5 Irregular ill-defined mass 1 2 Round spiculated mass 1 2 Irregular spiculated mass 4 6 Round circumscribed mass 1 2
Get Radiology Tree app to read full this article<
Experimental protocol
Get Radiology Tree app to read full this article<
Get Radiology Tree app to read full this article<
Data Analysis
Get Radiology Tree app to read full this article<
Get Radiology Tree app to read full this article<
Get Radiology Tree app to read full this article<
Get Radiology Tree app to read full this article<
Get Radiology Tree app to read full this article<
Results
Impact of Mammographic Density Across all Images
Get Radiology Tree app to read full this article<
Table 4
Impact of Mammographic Density Across all Images
Radiologist Grouping Metric Low-Density ∗ Median (IQR) High-Density † Median (IQR)P Value All Location sensitivity 63.8 (23.12) 57.9 (28.94) .12 Specificity 77.0 (25.68) 76.3 (38.16) .41 JAFROC FOM 0.69 (0.09) 0.69 (0.08) .16 Over 2000 mammograms/yr Location sensitivity 67.5 (8.75) 76.3 (22.37) .06 Specificity 71.62 (25.68) 80.27 (35.83) .84 JAFROC FOM 0.70 (0.09) 0.76 (0.12) .03 Under 2000 mammograms/yr Location sensitivity 48.8 (34.38) 54.0 (27.63) .95 Specificity 77.03 (39.19) 76.32 (34.87) .53 JAFROC FOM 0.66 (0.16) 0.67 (0.14) .94
FOM, figure of merit; IQR, interquartile range; JAFROC, jack-knife free-response receiver operating characteristic.
Get Radiology Tree app to read full this article<
Get Radiology Tree app to read full this article<
Get Radiology Tree app to read full this article<
Impact of Mammographic Density: Lesions Overlaying the Fibroglandular Tissue
Get Radiology Tree app to read full this article<
Table 5
Impact of Mammographic Density: Lesion Overlaying the Fibroglandular Tissue
Radiologist Grouping Metric Low-Density ∗ Median (IQR) High-Density † Median (IQR)P Value All Location sensitivity 50.0 (20.84) 59.1 (38.64) .03 Specificity 77.0 (25.68) 76.3 (38.16) .41 JAFROC FOM 0.63 (0.1) 0.68 (0.13) .05 Over 2000 mammograms/yr Location sensitivity 55.6 (12.5) 81.8 (20.64) .04 Specificity 71.62 (25.68) 80.27 (35.83) .84 JAFROC FOM 0.69 (0.08) 0.77 (0.19) .16 Under 2000 mammograms/yr Location sensitivity 41.7 (25.01) 47.7 (27.27) .26 Specificity 77.03 (39.19) 76.32 (34.87) .53 JAFROC FOM 0.61 (0.13) 0.65 (0.14) .21
FOM, figure of merit; IQR, interquartile range; JAFROC, jack-knife free-response receiver operating characteristic.
Get Radiology Tree app to read full this article<
Get Radiology Tree app to read full this article<
Get Radiology Tree app to read full this article<
Impact of Mammographic Density: Lesion Outside the Fibroglandular Region
Get Radiology Tree app to read full this article<
Table 6
Impact of Mammographic Density: Lesion Outside the Fibroglandular Region
Radiologist Grouping Metric Low-Density ∗ Median (IQR) High-Density † Median (IQR)P Value All Location sensitivity 65.8 (35.52) 62.5 (39.06) .22 Specificity 77.0 (25.68) 76.3 (38.16) .41 JAFROC FOM 0.71 (0.14) 0.72 (0.09) .13 Over 2000 mammograms/yr Location sensitivity 73.7 (15.78) 81.3 (35.93) .25 Specificity 71.62 (25.68) 80.27 (35.83) .84 JAFROC FOM 0.71 (0.13) 0.78 (0.15) .14 Under 2000 mammograms/yr Location sensitivity 52.63 (44.74) 56.25 (37.5) .74 Specificity 77.03 (39.19) 76.32 (34.87) .53 JAFROC FOM 0.69 (0.2) 0.70 (0.19) .73
FOM, figure of merit; IQR, interquartile range; JAFROC, jack-knife free-response receiver operating characteristic.
Get Radiology Tree app to read full this article<
Get Radiology Tree app to read full this article<
Get Radiology Tree app to read full this article<
Discussion
Get Radiology Tree app to read full this article<
Get Radiology Tree app to read full this article<
Get Radiology Tree app to read full this article<
Get Radiology Tree app to read full this article<
Get Radiology Tree app to read full this article<
Get Radiology Tree app to read full this article<
Conclusions
Get Radiology Tree app to read full this article<
Acknowledgments
Get Radiology Tree app to read full this article<
Get Radiology Tree app to read full this article<
References
1. Otto S.J., Fracheboud J., Looman C.W.N., et. al.: Initiation of population-based mammography screening in Dutch municipalities and effect on breast-cancer mortality: a systematic review. Lancet 2003; 361: pp. 1411-1417.
2. Duffy S.W., Tabar L., Olsen A.H., et. al.: Absolute numbers of lives saved and overdiagnosis in breast cancer screening, from a randomized trial and from the Breast Screening Programme in England. J Med Screen 2010; 17: pp. 25-30.
3. Kalager M., Zelen M., Langmark F., et. al.: Effect of screening mammography on breast-cancer mortality in Norway. N Engl J Med 2010; 363: pp. 1203-1210.
4. Tabár L., Vitak B., Chen T.H., et. al.: Swedish two-county trial: impact of mammographic screening on breast cancer mortality during 3 decades. Radiology 2011; 260: pp. 658-663.
5. Paci E.: Summary of the evidence of breast cancer service screening outcomes in Europe and first estimate of the benefit and harm balance sheet. J Med Screen 2012; 19: pp. 5-13.
6. Smith R.A., Duffy S.W., Tabar L.: Breast cancer screening: the evolving evidence. Oncology (Williston Park) 2012; 26: pp. 471-486. Available at: http://www.ncbi.nlm.nih.gov/pubmed/22730603 Accessed October 29, 2012
7. Boyd N.F., Guo H., Martin L.J., et. al.: Mammographic density and the risk and detection of breast cancer. N Engl J Med 2007; 356: pp. 227-236.
8. Boyd N.F., Martin L.J., Bronskill M., et. al.: Breast tissue composition and susceptibility to breast cancer. J Natl Cancer Inst 2010; 102: pp. 1224-1237.
9. McCormack V.A., dos Santos Silva I.: Breast density and parenchymal patterns as markers of breast cancer risk: a meta-analysis. Cancer Epidemiol Biomarkers Prev 2006; 15: pp. 1159-1169.
10. Kavanagh A.M., Byrnes G.B., Nickson C., et. al.: Using mammographic density to improve breast cancer screening outcomes. Cancer Epidemiol Biomarkers Prev 2008; 17: pp. 2818-2824.
11. Bird R.E., Wallace T.W., Yankaskas B.C.: Analysis of cancers missed at screening mammography. Radiology 1992; 184: pp. 613-617.
12. Chiarelli A.M., Kirsh V.A., Klar N.S., et. al.: Influence of patterns of hormone replacement therapy use and mammographic density on breast cancer detection. Cancer Epidemiol Biomarkers Prev 2006; 15: pp. 1856-1862.
13. Mandelson M.T., Oestreicher N., Porter P.L., et. al.: Breast density as a predictor of mammographic detection: comparison of interval- and screen-detected cancers. J Natl Cancer Inst 2000; 92: pp. 1081-1087.
14. Ciatto S., Visioli C., Paci E., et. al.: Breast density as a determinant of interval cancer at mammographic screening. Br J Cancer 2004; 90: pp. 393-396.
15. Rosenberg R.D., Hunt W.C., Williamson M.R., et. al.: Effects of age, breast density, ethnicity, and estrogen replacement therapy on screening mammographic sensitivity and cancer stage at diagnosis: review of 183, 134 screening mammograms in Albuquerque, New Mexico. Radiology 1998; 209: pp. 511-518.
16. Kolb T.M., Lichy J., Newhouse J.H.: Comparison of the performance of screening mammography, physical examination, and breast US and evaluation of factors that influence them: an analysis of 27,825 patient evaluations. Radiology 2002; 225: pp. 165-175.
17. Carney P.A., Miglioretti D.L., Yankaskas B.C., et. al.: Individual and combined effects of age, breast density, and hormone replacement therapy use on the accuracy of screening mammography. Ann Intern Med 2003; 138: pp. 168-175.
18. Buist D.S.M., Porter P.L., Lehman C., et. al.: Factors contributing to mammography failure in women aged 40-49 years. J Natl Cancer Inst 2004; 96: pp. 1432-1440.
19. Cawson J.N., Nickson C., Amos A., et. al.: Invasive breast cancers detected by screening mammography: a detailed comparison of computer-aided detection-assisted single reading and double reading. J Med Imaging Radiat Oncol 2009; 53: pp. 442-449.
20. Roubidoux M.A., Bailey J.E., Wray L.A., et. al.: Invasive cancers detected after breast cancer screening yielded a negative result: relationship of mammographic density to tumor prognostic factors1. Radiology 2004; 230: pp. 42-48.
21. Porter G.J.R., Evans A.J., Cornford E.J., et. al.: Influence of mammographic parenchymal pattern in screening-detected and interval invasive breast cancers on pathologic features, mammographic features, and patient survival. AJR Am J Roentgenol 2007; 188: pp. 676-683.
22. Nickson C., Kavanagh A.M.: Tumour size at detection according to different measures of mammographic breast density. J Med Screen 2009; 16: pp. 140-146.
23. Kerlikowske K., Grady D., Barclay J., et. al.: Effect of age, breast density, and family history on the sensitivity of first screening mammography. JAMA 1996; 276: pp. 33-38.
24. Litherland J.C., Evans A.J., Wilson A.R.: The effect of hormone replacement therapy on recall rate in the National Health Service Breast Screening Programme. Clin Radiol 1997; 52: pp. 276-279.
25. Persson I., Thurfjell E., Holmberg L.: Effect of estrogen and estrogen-progestin replacement regimens on mammographic breast parenchymal density. J Clin Oncol 1997; 15: pp. 3201-3207.
26. Berg W.A., Gutierrez L., NessAiver M.S., et. al.: Diagnostic accuracy of mammography, clinical examination, US, and MR imaging in preoperative assessment of breast cancer1. Radiology 2004; 233: pp. 830-849.
27. Pisano E.D., Hendrick R.E., Yaffe M.J., et. al.: Diagnostic accuracy of digital versus film mammography: exploratory analysis of selected population subgroups in DMIST. Radiology 2008; 246: pp. 376-383.
28. Kerlikowske K., Hubbard R.A., Miglioretti D.L., et. al.: Comparative effectiveness of digital versus film-screen mammography in community practice in the United States: a cohort study. Ann Intern Med 2011; 155: pp. 493-502.
29. Ciatto S., Houssami N., Bernardi D., et. al.: Integration of 3D digital mammography with tomosynthesis for population breast-cancer screening (STORM): a prospective comparison study. Lancet Oncol 2013; 14: pp. 583-589.
30. Boyd N.F., Byng J.W., Jong R.A., et. al.: Quantitative classification of mammographic densities and breast cancer risk: results from the Canadian National Breast Screening Study. J Natl Cancer Inst 1995; 87: pp. 670-675.
31. Boyd N.F., Lockwood G.A., Byng J.W., et. al.: Mammographic densities and breast cancer risk. Cancer Epidemiol Biomarkers Prev 1998; 7: pp. 1133-1144.
32. Harvey J.A.: Quantitative assessment of percent breast density: analog versus digital acquisition. Technol Cancer Res Treat 2004; 3: pp. 611-616.
33. Kan L., Olivotto I.A., Warren Burhenne L.J., et. al.: Standardized abnormal interpretation and cancer detection ratios to assess reading volume and reader performance in a breast screening program. Radiology 2000; 215: pp. 563-567.
34. Esserman L., Cowley H., Eberle C., et. al.: Improving the accuracy of mammography: volume and outcome relationships. J Natl Cancer Inst 2002; 94: pp. 369-375.
35. Reed W.M., Lee W.B., Cawson J.N., et. al.: Malignancy detection in digital mammograms: important reader characteristics and required case numbers. Acad Radiol 2010; 17: pp. 1409-1413.
36. BreastScreen Australia, National accreditation handbook: endorsed by the Australian Screening Advisory Committee November 2004. Available at: http://www.cancerscreening.gov.au/internet/screening/publishing.nsf/Content/br-accreditation/$File/handbook.pdf . Accessed March 15, 2013.
37. National Breast Cancer Center. Synoptic breast imaging report: National Breast Cancer Center 2007. Available at: http://canceraustralia.nbocc.org.au/view-document-details/rsig-1-synoptic-breast-imaging-report-update . Accessed August 1, 2012.
38. American College of Radiology. American College of Radiology Breast Imaging Reporting and Data System (BI-RADS). 4th ed. Reston, VA: American College of Radiology.
39. National Electrical Manufacturer’s Association. Digital Imaging and Communication in Medicine (DICOM) Part 14: grayscale standard display function. Available at: http://medical.nema.org/Dicom/2011/11_14pu.pdf . Accessed October 10, 2012.
40. EIZO NANAO Corporation. RadiCS—Quality Control Software. Available at: http://www.eizo.com/global/products/radiforce/radics/index.html . Accessed October 1, 2012.
41. Chakraborty D.P.: Recent advances in observer performance methodology: jackknife free-response ROC (JAFROC). Radiat Prot Dosimetry 2005; 114: pp. 26-31.
42. Chakraborty D.P.: Analysis of location specific observer performance data: validated extensions of the jackknife free-response (JAFROC) method. Acad Radiol 2006; 13: pp. 1187-1193.
43. Byrne C., Schairer C., Wolfe J., et. al.: Mammographic features and breast cancer risk: effects with time, age, and menopause status. J Natl Cancer Inst 1995; 87: pp. 1622-1629.
44. Reed W.M., Ryan J.T., McEntee M.F., et. al.: The effect of abnormality-prevalence expectation on expert observer performance and visual search. Radiology 2011; 258: pp. 938-943.
45. Reiner B., Siegel E., McLaurin T., et. al.: Evaluation of soft-tissue foreign bodies: comparing conventional plain film radiography, computed radiography printed on film, and computed radiography displayed on a computer workstation. AJR Am J Roentgenol 1996; 167: pp. 141-144.
46. O’Connor P.J., Davies A.G., Fowler R.C., et. al.: Reporting requirements for skeletal digital radiography: comparison of soft-copy and hard-copy presentation. Radiology 1998; 207: pp. 249-254.
47. Lev M.H., Farkas J., Gemmete J.J., et. al.: Acute stroke: improved nonenhanced CT detection—benefits of soft-copy interpretation by using variable window width and center level settings1. Radiology 1999; 213: pp. 150-155.
48. Obenauer S., Hermann K.-P., Marten K., et. al.: Soft copy versus hard copy reading in digital mammography. J Digit Imaging 2003; 16: pp. 341-344.
49. Robinson J.W., Ryan J.T., McEntee M.F., et. al.: Grey-scale inversion improves detection of lung nodules. Br J Radiol 2013; 86: pp. 27961545.
50. Krupinski E., Roehrig H., Dallas W., et. al.: Differential use of image enhancement techniques by experienced and inexperienced observers. J Digit Imaging 2005; 18: pp. 311-315.
51. Séradour B., Heid P., Estève J.: Comparison of direct digital mammography, computed radiography, and film-screen in the French National Breast Cancer Screening Program. AJR Am J Roentgenol 2014; 202: pp. 229-236.