
Rationale and Objectives
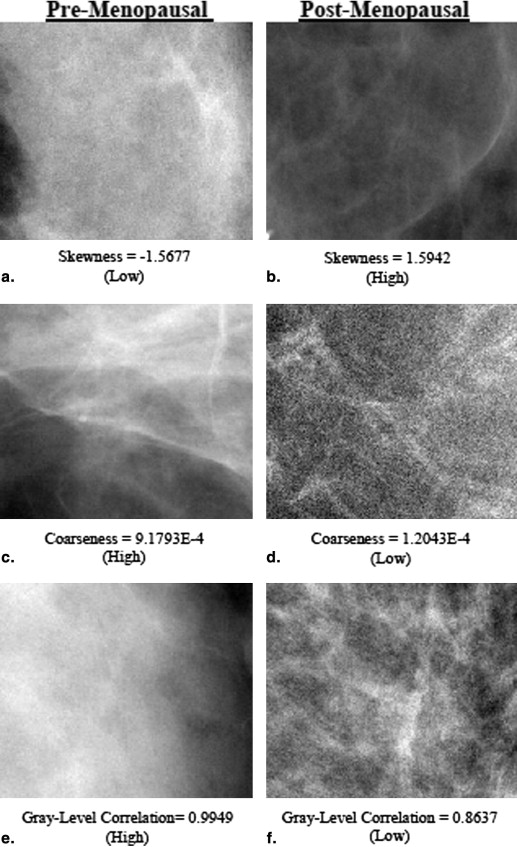
Parenchymal texture patterns have been previously associated with breast cancer risk, yet their underlying biological determinants remain poorly understood. Here, we investigate the potential of mammographic parenchymal texture as a phenotypic imaging marker of endogenous hormonal exposure.
Materials and Methods
A retrospective cohort study was performed. Digital mammography (DM) images in the craniocaudal (CC) view from 297 women, 154 without breast cancer and 143 with unilateral breast cancer, were analyzed. Menopause status was used as a surrogate of cumulative endogenous hormonal exposure. Parenchymal texture features were extracted and mammographic percent density (MD%) was computed using validated computerized methods. Univariate and multivariable logistic regression analysis was performed to assess the association between texture features and menopause status, after adjusting for MD% and hormonally related confounders. The receiver operating characteristic (ROC) area under the curve (AUC) of each model was estimated to evaluate the degree of association between the extracted mammographic features and menopause status.
Results
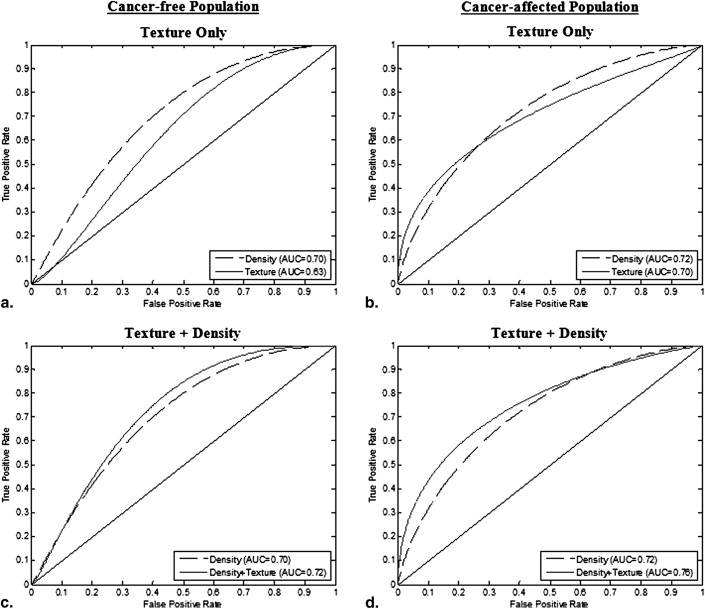
Coarseness, gray-level correlation, and fractal dimension texture features have a significant independent association with menopause status in the cancer-affected population; skewness and fractal dimension exhibit a similar association in the cancer-free population ( P < .05). The ROC AUC of the logistic regression model including all texture features was 0.70 ( P < .05) for cancer-affected and 0.63 ( P < .05) for cancer-free women. Texture features retained significant association with menopause status ( P < .05) after adjusting for MD%, age at menarche, ethnicity, contraception use, hormone replacement therapy, parity, and age at first birth.
Conclusion
Mammographic texture patterns may reflect the effect of endogenous hormonal exposure on the breast tissue and may capture such effects beyond mammographic density. Differences in texture features between pre- and postmenopausal women are more pronounced in the cancer-affected population, which may be attributed to an increased association to breast cancer risk. Texture features could ultimately be incorporated in breast cancer risk assessment models as markers of hormonal exposure.
As new strategies for breast cancer prevention and early detection become available , it is essential to provide accurate, clinically relevant methods, to identify women at high risk of breast cancer. Although a lot of progress has been made, current approaches still face limitations. Most research to date has focused on identifying women at increased familial risk (ie, BRCA1/2 carriers), which only account for the 5%–10% of incident breast cancers . On the other hand, the National Cancer Institute’s breast cancer risk assessment tool for the general population, the Gail model, has only modest discriminatory accuracy at the individual level . Studies suggest that risk prediction could be improved by incorporating mammographic parenchymal pattern descriptors . Parenchymal texture features characterize the spatial distribution and structure of the breast tissue pattern and could potentially complement the widely used measure of breast density, which is typically captured using coarse measures of the overall percent of mammographically dense tissue in the breast . Studies suggest that texture features, particularly in the low spatial frequencies, are strong predictors of cancer risk , even when breast density is considered .
Mammographic breast density, which is currently the most commonly used parenchymal pattern descriptor, has been identified as a strong independent risk factor for breast cancer and is also shown to correlate with certain modifiable risk factors, such as endogenous cumulative and circulating hormone levels, exogenous hormonal exposure, diet, and body mass index . Studies suggest that the biological basis of these associations can be mediated through a number of mechanisms that include increased hormonal exposure, prolactin secretion, or the production of growth factors and non–growth factor peptides , which may lead to tissue progression from normal growth to hyperplasia to neoplasia . Over the past decade, novel parenchymal descriptors characterizing the texture of the breast tissue have also emerged as potentially additional breast cancer risk indicators . Yet, although the biological basis of breast density as a risk factor is starting to be elucidated, the biological determinants of parenchymal texture and its association to breast cancer risk are still not well understood.
Get Radiology Tree app to read full this article<
Get Radiology Tree app to read full this article<
Materials and methods
Study Population
Get Radiology Tree app to read full this article<
Get Radiology Tree app to read full this article<
Table 1
Characteristics of Our Study Population
Cancer-Free Women Cancer-Affected Women Premenopausal Postmenopausal Premenopausal Postmenopausal Total number 88 66 73 70 Mean age (years) 44.41 ± 7.78 52.39 ± 18.32 45.43 ± 6.02 62.77 ± 7.59 Gail 5-year risk (%) 1.51 ± 1.28 2.85 ± 1.99 1.03 ± 0.70 1.81 ± 0.96 Gail lifetime risk (%) 17.63 ± 8.38 17.62 ± 10.89 12.11 ± 5.18 10.22 ± 4.97 Ethnicity Caucasian 76 (87%) 51 (77%) 59 (81%) 54 (77%) African American 7 (8%) 8 (12%) 8 (11%) 13 (20%) Asian 2 (2%) 2 (3%) 2 (3%) 1 (1%) Mixed 1 (1%) 1 (2%) 1 (1%) 1 (1%) Other, not available 2 (2%) 4 (6%) 3 (4%) 1 (1%) Estrogen therapy Yes 1 (1%) 3 (5%) 1 (1%) 2 (3%) No 87 (99%) 63 (95%) 72 (99%) 68 (97%) Contraceptive use Yes 2 (2%) 0 (0%) 6 (8%) 0 (0%) No 86 (98%) 66 (100%) 67 (92%) 70 (100%) Mean age at menarche (years) 12.57 ± 1.71 12.45 ± 2.74 12.59 ± 1.16 12.33 ± 1.49 Mean age at first birth (years) 27.32 ± 5.68 25.59 ± 6.47 28.40 ± 5.09 24.27 ± 5.33 Parity Yes 55 (63%) 56 (85%) 55 (75%) 59 (84%) No 33 (37%) 10 (15%) 18 (25%) 11 (16%)
Get Radiology Tree app to read full this article<
Image Dataset
Get Radiology Tree app to read full this article<
Parenchymal Texture Analysis
Get Radiology Tree app to read full this article<
Get Radiology Tree app to read full this article<
Get Radiology Tree app to read full this article<
Mammographic Density Estimation
Get Radiology Tree app to read full this article<
Data Analysis
Get Radiology Tree app to read full this article<
Get Radiology Tree app to read full this article<
Get Radiology Tree app to read full this article<
Get Radiology Tree app to read full this article<
Results
Get Radiology Tree app to read full this article<
Table 2
Summary of Texture Feature Characteristics in Cancer-Free and Cancer-Affected Women
Premenopausal Postmenopausal Mean SD CV ICC Mean SD CV ICC Cancer-free population Coarseness 4.139E-4 1.688E-4 0.40 0.68 4.498E-4 2.898E-4 0.43 0.66 Contrast 3.528E2 107.05 0.31 0.87 3.443E2 89.459 0.26 0.77 Gray level correlation 9.655E-1 3.450E-2 0.03 0.39 9.658E-1 3.470E-2 0.03 0.71 Energy 8.697E-5 3.054E-5 0.36 0.42 7.874E-5 3.327E-5 0.42 0.67 Homogeneity 1.379E-1 1.370E-2 0.07 0.90 1.384E-1 1.280E-2 0.07 0.91 Fractal dimension* 2.556 0.251 0.10 0.71 2.669 0.163 0.06 0.65 Skewness* −1.882E-1 0.527 −2.79 0.52 −1.30E-2 0.559 −55.00 0.27 MD (%)** 43.72 15.36 0.34 0.80 34.57 15.37 0.42 0.66 Cancer-affected population Coarseness* 4.705E-4 1.617E-4 0.34 0.44 4.085E-4 1.754E-4 0.44 0.63 Contrast 3.266E2 1.609E1 0.49 0.09 3.444E2 1.006E1 0.29 0.68 Gray level correlation* 9.751E-1 2.000E-2 0.02 0.35 9.574E-1 4.200E-2 0.043 0.80 Energy 8.217E-5 3.370E-5 0.41 0.63 9.955E-5 5.575E-5 0.59 0.73 Homogeneity 1.440E-1 1.340E-2 0.07 0.56 1.396E-1 1.220E-2 0.09 0.81 Fractal dimension* 2.658 0.210 0.08 0.59 2.591 0.176 0.07 0.62 Skewness −0.855E-1 1.166 −13.00 0.07 0.0934 0.492 5.56 0.31 MD (%)** 44.61 14.96 0.33 0.76 33.36 14.09 0.46 0.73
CV, coefficient of variation; ICC: intra-class correlation; MD, mammographic density; SD, standard deviation.
\* P < .05, ** P < .001. P values are from t -test comparing differences in feature means between pre- and postmenopausal women.
Table 3
Interfeature Spearman Correlation Coefficients in Cancer-Free and Cancer-Affected Women
Coarseness Contrast Gray-Level Correlation Energy Homogeneity Fractal Dimension Skewness MD Cancer-free population Coarseness 1.00 Contrast −0.44** 1.00 Gray-level correlation 0.91** −0.29** 1.00 Energy −0.73** −0.22* −0.72** 1.00 Homogeneity 0.47** −0.99** 0.32** 0.20* 1.00 Fractal dimension 0.61** −0.41** 0.52** −0.30** 0.41** 1.00 Skewness 0.01 −0.12 −0.15 0.11 0.15 0.12 1.00 MD (%) 0.09 −0.15 0.16* 0.01 0.13 −0.09 −0.34** 1.00 Cancer-affected population Coarseness 1.00 Contrast −0.35** 1.00 Gray level correlation 0.95** −0.31** 1.00 Energy −0.77** −0.20* −0.76** 1.00 Homogeneity 0.34** −0.93** 0.29** 0.24* 1.00 Fractal dimension 0.58** −0.24* 0.54** −0.42** 0.20* 1.00 Skewness −0.20* 0.01 −0.35** 0.29** 0.05 −0.02 1.00 MD (%) 0.13 −0.18* 0.23* −0.05 0.17* 0.09 −0.45** 1.00
MD, mammographic density.
\* P < 0.05, P < .001.
Get Radiology Tree app to read full this article<
Get Radiology Tree app to read full this article<
Table 4
Univariate Logistic Regression and ROC Curve Performance in Distinguishing between Pre- and Postmenopausal Women for Each of the Texture Features Alone and after Adjusting for Density and Hormonal Factors
Texture Feature Texture Feature + Density Texture Feature + Density + Hormonal Factors Regression Coefficient AUC Regression Coefficient AUC Regression Coefficient AUC Cancer-free population Coarseness 1200 0.55 1600 0.70** 1700 0.71** Contrast −0.001 0.50 −0.002 0.71** −0.002 0.72** Gray level Correlation 1.80 0.51 4.70 0.70** 4.10 0.70** Energy −5700 0.56 −5200 0.70** −5400 0.70** Homogeneity 5.20 0.50 13 0.70** 13.10 0.71** Fractal Dimension 2.30* 0.62* 2.20* 0.71** 2.10* 0.73** Skewness 0.62* 0.58* 0.24 0.70** 0.27 0.71** MD (%) — −0.05** 0.70** −0.05** 0.71** Cancer-affected population Coarseness −2500* 0.64* −2600* 0.75** −2600* 0.77** Contrast 0.0010 0.57 0.0004 0.73** 0.0008 0.76** Gray level Correlation −24.00* 0.66** −23.00* 0.76** −24.00* 0.78** Energy 7700 0.59 1100* 0.74** 8800 0.77** Homogeneity −25.00 0.57 −18.00 0.74** −29.00 0.77** Fractal dimension −1.90* 0.61* −2.40* 0.75** −2.60* 0.78** Skewness 0.33 0.67 0.05 0.74** 0.03 0.76** MD (%) — −0.05** 0.72** −0.06** 0.76**
AUC, area under the curve; MD, mammographic density; ROC, receiver operating characteristic.
\* P < .05, ** P < .001. Asterisk notation on AUC reflects overall P value of regression model.
Get Radiology Tree app to read full this article<
Get Radiology Tree app to read full this article<
Table 5
Logistic Regression Results for Each Partial Regression Coefficient before and after the Addition of Density and Hormonal Variables to the Multivariable Texture Feature Models
Texture Only Texture + Density Texture + Density + Hormonal Factors Regression Coefficient_P_ Value Regression Coefficient_P_ Value Regression Coefficient_P_ Value Cancer-free population Model constant 20 .15 20 .19 23 .13 Coarseness 920 .65 1400 .50 1600 .48 Contrast −0.01 .28 −0.01 .17 −0.01 .14 Gray-level correlation −15 .18 −8.35 .51 −11 .40 Energy −5700 .73 4200 .98 −2100 .91 Homogeneity −76 .27 −98 .18 −100 .17 Fractal dimension 3.30 <.01 2.68 .04 2.60 .04 Skewness 0.48 .15 0.18 .60 0.19 .59 MD (%) −0.05 <.01 −0.05 <.01 Age at menarche 0.01 .92 Estrogen therapy 0.90 .49 Contraceptive use 0.49 .71 Ethnicity 0.02 .49 Parity/age at first birth 0.45 .104 Model P value .017 <.001 <.001 Cancer-affected population Model constant 39 .01 37 .02 44 .01 Coarseness 3200 .15 2500 .27 330 .17 Contrast −0.01 <.01 −0.01 .04 −0.01 .04 Gray-level correlation −24 .12 −24 .15 −29 .11 Energy 10,000 .12 10,000 .17 9400 .21 Homogeneity −95 <.01 −65 .04 −78 .03 Fractal dimension −0.62 .61 −1.01 .43 −1.20 .38 Skewness 0.99 .02 0.56 .19 0.56 .22 MD (%) −0.04 <.01 −0.03 <.01 Age at menarche 0.04 .79 Estrogen therapy −1.00 .48 Contraceptive use −1.60 .178 Ethnicity 0.07 .433 Parity/age at first birth −0.46 .142 Model P value <.001 <.001 <.001
MD, mammographic density.
P values are shown for the Wald test for each partial regression coefficient and for overall model significance.
Get Radiology Tree app to read full this article<
Get Radiology Tree app to read full this article<
Discussion
Get Radiology Tree app to read full this article<
Get Radiology Tree app to read full this article<
Get Radiology Tree app to read full this article<
Get Radiology Tree app to read full this article<
Get Radiology Tree app to read full this article<
Get Radiology Tree app to read full this article<
Conclusion
Get Radiology Tree app to read full this article<
Acknowledgments
Get Radiology Tree app to read full this article<
Appendix
Get Radiology Tree app to read full this article<
skewness=w3w322where s
k
e
w
n
e
s
s
=
w
3
w
2
3
2
w
h
e
r
e
wk=∑gmaxi=0ni(i−i¯)k/N,N=∑gmaxi=0ni,i¯=∑gmaxi=0(ini/N) w
k
=
∑
i
=
0
g
max
n
i
(
i
−
i
¯
)
k
/
N
,
N
=
∑
i
=
0
g
max
n
i
,
i
¯
=
∑
i
=
0
g
max
(
i
n
i
/
N
)
and n__i represents the number of times that gray level value i takes place in the image region, g max is the maximum gray-level value, and N is the total number of image pixels.
Get Radiology Tree app to read full this article<
Get Radiology Tree app to read full this article<
coarseness=(∑gmaxi=0piv(i))−1,wherev(i)={∑∣∣i−L¯¯¯i∣∣fori∈{ni}ifni≠0istheNGTDM0otherwise c
o
a
r
s
e
n
e
s
s
=
(
∑
i
=
0
g
max
p
i
v
(
i
)
)
−
1
,
where
v
(
i
)
=
{
∑
|
i
−
L
¯
i
|
f
o
r
i
∈
{
n
i
}
i
f
n
i
≠
0
is
the
NGTDM
0
o
t
h
e
r
w
i
s
e
Get Radiology Tree app to read full this article<
Get Radiology Tree app to read full this article<
L¯¯¯i=1S−1∑tk=−t∑tl=−tj(x+k,y+l), L
¯
i
=
1
S
−
1
∑
k
=
−
t
t
∑
l
=
−
t
t
j
(
x
+
k
,
y
+
l
)
,
where j(x,y) is the pixel located at (x,y) with gray level value i , (k,l)≠(0,0) and S = (2 d + 1) 2 , with d specifying the neighborhood size around the pixel located at (x,y) .
Get Radiology Tree app to read full this article<
Get Radiology Tree app to read full this article<
contrast=∑gi∑gj|i−j|2C(i,j), c
o
n
t
r
a
s
t
=
∑
i
g
∑
j
g
|
i
−
j
|
2
C
(
i
,
j
)
,
energy=∑gi∑gjC(i,j), e
n
e
r
g
y
=
∑
i
g
∑
j
g
C
(
i
,
j
)
,
correlation=∑i∑j(ij)p(i,j)−μxμyσxσy,homogeneity=∑gmaxi=0∑gmaxj=0C(i,j)1+|i−j| c
o
r
r
e
l
a
t
i
o
n
=
∑
i
∑
j
(
i
j
)
p
(
i
,
j
)
−
μ
x
μ
y
σ
x
σ
y
,
h
o
m
o
g
e
n
e
i
t
y
=
∑
i
=
0
g
m
a
x
∑
j
=
0
g
m
a
x
C
(
i
,
j
)
1
+
|
i
−
j
|
where g is the total number of gray levels, μ and σ are the mean and standard deviation of the partial probability density function p , and C is the normalized cooccurrence matrix .
Get Radiology Tree app to read full this article<
Get Radiology Tree app to read full this article<
F(u,v)=∑M−1m=0∑N−1n=0I(m,n)e−j(2πM)ume−j(2πN)vn,u=0,1,…,M−1v=0,1,…,N−1 F
(
u
,
v
)
=
∑
m
=
0
M
−
1
∑
n
=
0
N
−
1
I
(
m
,
n
)
e
−
j
(
2
π
M
)
u
m
e
−
j
(
2
π
N
)
v
n
,
u
=
0
,
1
,
…
,
M
−
1
v
=
0
,
1
,
…
,
N
−
1
where I is the 2D image region of size ( M , N ), and u and v are the spatial frequencies in the x and y directions. The power spectral density P was estimated from F ( u , v ) as:
P(u,v)=|F(u,v)|2 P
(
u
,
v
)
=
|
F
(
u
,
v
)
|
2
Get Radiology Tree app to read full this article<
Get Radiology Tree app to read full this article<
Get Radiology Tree app to read full this article<
FD=3DT+2−β2=8−β2 F
D
=
3
D
T
+
2
−
β
2
=
8
−
β
2
where DT is the topological dimension, and is equal to 2 for a 2D image.
Get Radiology Tree app to read full this article<
References
1. Armstrong K., Quistberg D.A., Micco E., et. al.: Prescription of tamoxifen for breast cancer prevention by primary care physicians. Arch Intern Med 2006; 166: pp. 2260-2265.
2. Singh V., Saunders C., Wylie L., et. al.: New diagnostic techniques for breast cancer detection. Future Oncol 2008; 4: pp. 501-513.
3. Gulati A.P., Domchek S.M.: The clinical management of BRCA1 and BRCA2 mutation carriers. Curr Oncol Rep 2008; 10: pp. 47-53.
4. Rockhill B., Spiegelman D., Byrne C., et. al.: Validation of the Gail et al. model of breast cancer risk prediction and implications for chemoprevention. J Natl Cancer Inst 2001; 93: pp. 358-366.
5. Tice J.A., Cummings S.R., Smith-Bindman R., et. al.: Using clinical factors and mammographic breast density to estimate breast cancer risk: development and validation of a new predictive model. Ann Intern Med 2008; 148: pp. 337-347.
6. Boyd N.F., Martin L.J., Yaffe M.J., et. al.: Mammographic density and breast cancer risk: current understanding and future prospects. Breast Cancer Res 2011; 13: pp. 223.
7. Li H., Giger M.L., Olopade O.I., et. al.: Fractal analysis of mammographic parenchymal patterns in breast cancer risk assessment. Acad Radiol 2007; 14: pp. 513-521.
8. Huo Z., Giger M.L., Olopade O.I., et. al.: Computerized analysis of digitized mammograms of BRCA1 and BRCA2 gene mutation carriers. Radiology 2002; 225: pp. 519-526.
9. Caldwell C.B., Stapleton S.J., Holdsworth D.W., et. al.: Characterisation of mammographic parenchymal pattern by fractal dimension. Phys Med Biol 1990; 35: pp. 235-247.
10. Li H., Giger M.L., Olopade O.I., et. al.: Computerized texture analysis of mammographic parenchymal patterns of digitized mammograms. Acad Radiol 2005; 12: pp. 863-873.
11. Boyd N.F., Guo H., Martin L.J., et. al.: Mammographic density and the risk and detection of breast cancer. N Engl J Med 2007; 356: pp. 227-236.
12. Manduca A., Carston M.J., Heine J.J., et. al.: Texture features from mammographic images and risk of breast cancer. Cancer Epidemiol Biomarkers Prev 2009; 18: pp. 837-845.
13. Haberle L., Wagner F., Fasching P.A., et. al.: Characterizing mammographic images by using generic texture features. Breast Cancer Res 2012; 14: pp. R59.
14. Chlebowski R.T., McTiernan A.: Biological significance of interventions that change breast density. J Natl Cancer Inst 2003; 95: pp. 4-5.
15. Greendale G.A., Reboussin B.A., Slone S., et. al.: Postmenopausal hormone therapy and change in mammographic density. J Natl Cancer Inst 2003; 95: pp. 30-37.
16. Prowell T.M., Blackford A.L., Byrne C., et. al.: Changes in breast density and circulating estrogens in postmenopausal women receiving adjuvant anastrozole. Cancer Prev Res (Phila) 2011; 4: pp. 1993-2001.
17. Clemons M., Goss P.: Estrogen and the risk of breast cancer. N Engl J Med 2001; 344: pp. 276-285.
18. Kerlikowske K., Cook A.J., Buist D.S., et. al.: Breast cancer risk by breast density, menopause, and postmenopausal hormone therapy use. J Clin Oncol 2010; 28: pp. 3830-3837.
19. Daye D., Bobo E., Baumann B., et. al.: Mammographic parenchymal texture as an imaging marker of hormonal activity: a comparative study between pre- and post-menopausal women. Medical Imaging 2011: Computer-Aided Diagnosis, Proc SPIE 2011; 7963: 79631N–79631N
20. Key T., Appleby P., Barnes I., et. al.: Endogenous sex hormones and breast cancer in postmenopausal women: reanalysis of nine prospective studies. J Natl Cancer Inst 2002; 94: pp. 606-616.
21. Missmer S.A., Eliassen A.H., Barbieri R.L., et. al.: Endogenous estrogen, androgen, and progesterone concentrations and breast cancer risk among postmenopausal women. J Natl Cancer Inst 2004; 96: pp. 1856-1865.
22. Pike M.C., Krailo M.D., Henderson B.E., et. al.: ‘Hormonal’ risk factors, ‘breast tissue age’ and the age-incidence of breast cancer. Nature 1983; 303: pp. 767-770.
23. Grady D.: Clinical practice. Management of menopausal symptoms. N Engl J Med 2006; 355: pp. 2338-2347.
24. Kontos D., Bakic P.R., Carton A.K., et. al.: Parenchymal texture analysis in digital breast tomosynthesis for breast cancer risk estimation: a preliminary study. Acad Radiol 2009; 16: pp. 283-298.
25. Kontos D., Ikejimba L., Bakic P.R., et. al.: Digital breast tomosynthesis parenchymal texture analysis: comparison with digital mammography and implications for cancer risk assessment. Radiology 2011; 261: pp. 80-91.
26. Oliver A., Freixenet J., Marti R., et. al.: A novel breast tissue density classification methodology. IEEE Trans Inf Technol Biomed 2008; 12: pp. 55-65.
27. Kontos D., Ikejimba L.C., Bakic P.R., et. al.: Analysis of parenchymal texture with digital breast tomosynthesis: comparison with digital mammography and implications for cancer risk assessment. Radiology 2011; 261: pp. 80-91.
28. Haralick R.M., Shanmugam K., Dinstein I.: Textural features for image classification. IEEE Trans Syst Man Cybernetics 1973; 3: pp. 610-621.
29. Amadasum M., King R.: Textural features corresponding to textural properties. IEEE Trans Syst Man Cybernetics 1989; 19: pp. 1264-1274.
30. Wei J., Chan H.P., Wu Y.T., et. al.: Association of computerized mammographic parenchymal pattern measure with breast cancer risk: a pilot case-control study. Radiology 2011; 260: pp. 42-49.
31. Huo Z., Giger M.L., Wolverton D.E., et. al.: Computerized analysis of mammographic parenchymal patterns for breast cancer risk assessment: feature selection. Med Phys 2000; 27: pp. 4-12.
32. Li H., Giger M.L., Huo Z., et. al.: Computerized analysis of mammographic parenchymal patterns for assessing breast cancer risk: effect of ROI size and location. Med Phys 2004; 31: pp. 549-555.
33. McCormack V.A., dos Santos Silva I.: Breast density and parenchymal patterns as markers of breast cancer risk: a meta-analysis. Cancer Epidemiol Biomarkers Prev 2006; 15: pp. 1159-1169.
34. Keller B., Nathan D., Wang Y., et. al.: Adaptive multi-cluster fuzzy C-means segmentation of breast parenchymal tissue in digital mammography. Med Image Comput Comput Assist Interv 2011; 14: pp. 562-569.
35. Keller B.M., Nathan D.L., Wang Y., et. al.: Estimation of breast percent density in raw and processed full field digital mammography images via adaptive fuzzy C-means clustering and support vector machine segmentation. Med Phys 2012; 39: pp. 4903-4917.
36. Brodersen K.H., Ong C.S., Stephan K.E., et. al.: The binormal assumption on precision-recall curves. Proceedings of the 20th International Conference on Pattern Recognition (ICPR) 2010; pp. 4263-4266.
37. Pepe M., Longton G., Janes H.: Estimation and comparison of receiver operating characteristic curves. Stata J 2009; 9: pp. 1.
38. Boyd N., Melnichouk O., Martin L.J., et. al.: Mammographic density, response to hormones, and breast cancer risk. J Clin Oncol 2011; 29: pp. 2985-2992.
39. Boyd N., Martin L., Stone J., et. al.: A longitudinal study of the effects of menopause on mammographic features. Cancer Epidemiol Biomarkers Prev 2002; 11: pp. 1048-1053.
40. Greendale G.A., Reboussin B.A., Sie A., et. al.: Effects of estrogen and estrogen-progestin on mammographic parenchymal density. Postmenopausal Estrogen/Progestin Interventions (PEPI) Investigators. Ann Intern Med 1999; 130: pp. 262-269.
41. Cuzick J., Warwick J., Pinney E., et. al.: Tamoxifen and breast density in women at increased risk of breast cancer. J Natl Cancer Inst 2004; 96: pp. 621-628.
42. Kontos D, Berger R, Bakic PR, et al. Breast tissue classification in digital breast tomosynthesis images using texture features: a feasibility study. In SPIE Medical Imaging: Computer-Aided Diagnosis M.L. Giger, and N. Karssemeijer, editors. Orlando, FL; 2009.
43. Raundahl J., Loog M., Pettersen P., et. al.: Automated effect-specific mammographic pattern measures. IEEE Trans Med Imaging 2008; 27: pp. 1054-1060.
44. Haralick R.M.: Statistical and structural approaches to texture. Proc IEEE 1979; 67: pp. 786-804.
45. Li H., Giger M.L., Olopade O.I., et. al.: Power spectral analysis of mammographic parenchymal patterns for breast cancer risk assessment. J Digit Imaging 2008; 21: pp. 145-152.