
Rationale and Objectives
Chronic obstructive pulmonary disease (COPD) is characterized by progressive respiratory function impairment and respiratory muscle dysfunction. We hypothesized that the mass and fat infiltration of respiratory muscles correlates with COPD severity and emphysema extent.
Materials and Methods
Ninety-eight male patients with COPD underwent chest computed tomography (CT) and spirometry. The mass and fat infiltrations of intercostal and latissimus muscles were quantified as the cross-sectional area (CSA) and attenuation of these muscles using CT histogram analysis. Intercostal index and latissimus index were defined as intercostal CSAs and latissimus CSAs divided by body mass index. The emphysema extent was measured as the ratio of the emphysematous lung volume to the total lung volume using a density-mask technique. Pearson correlation analyses were performed to evaluate the relationships between these parameters. Multiple regression analysis was performed using forced expiratory volume in 1 second (FEV 1 ) as the dependent parameter and the clinical and CT data as the independent parameters.
Results
FEV 1 was significantly correlated with intercostal index ( r = 0.57), latissimus index ( r = 0.34), intercostal attenuation ( r = 0.62), and latissimus attenuation ( r = 0.38). Emphysema extent was significantly correlated with intercostal index ( r = −0.36) and intercostal attenuation ( r = −0.50). Multiple regression analysis showed that FEV 1 was predicted by intercostal attenuation ( B = 0.40), intercostal CSA ( B = 0.23), emphysema extent ( B = −0.23), and age ( B = −0.21, R 2 = 0.64, P < .001).
Conclusions
A decrease in intercostal mass and an increase in intercostal fat are associated with worsening of COPD severity.
Chronic obstructive pulmonary disease (COPD) is a heterogeneous disease by progressive respiratory function impairment and skeletal muscle dysfunction . The emphysema extent measured by computed tomography (CT) has been correlated with COPD severity (forced expiratory volume in 1 second [FEV 1 ]) and airflow obstruction (FEV 1 / forced vital capacity [FVC]) in the previous studies . The loss of muscle mass and change of muscle composition are important factors for assessing the skeletal muscle dysfunction. It has been demonstrated that quadriceps muscle area was correlated with COPD severity , and the depletion of peripheral muscle mass was a better predictor of mortality than body mass index (BMI) in patients with COPD . Furthermore, the attenuation of the mid-thigh muscle in elderly persons was associated with muscle strength and mobility performance .
Among skeletal muscles, respiratory muscles are unique and crucial for alveolar ventilation . Respiratory muscle weakness may result in dyspnea and respiratory failure, which are associated with high risks of mortality in patients with COPD . Intercostal and latissimus dorsi muscles have major and minor roles for respiration, respectively. Few studies have investigated the structure and function of intercostal muscle and latissimus muscle , but they did not fully address the mass and tissue composition of these muscles in patients with COPD. Therefore, we aimed to quantify the mass and fat infiltration of intercostal and latissimus dorsi muscles and the emphysema extent using chest CT and to investigate their relationship with COPD severity and airflow obstruction.
Materials and methods
Subjects
Get Radiology Tree app to read full this article<
Get Radiology Tree app to read full this article<
Pulmonary Function Tests
Get Radiology Tree app to read full this article<
Chest CT Protocol
Get Radiology Tree app to read full this article<
Respiratory Muscle Measurement
Get Radiology Tree app to read full this article<
![Figure 1, A 63-year-old man with Global Initiative for Chronic Obstructive Lung Disease 3. (a) In a coronal image, the region of interest ( red line ) was drawn at the outermost border of right fifth intercostal muscle ( black arrow ). (b) The cross-sectional area (CSA) and attenuation of the fifth intercostal muscle was automatically measured by computed tomography (CT) histogram analysis (CT attenuation ranged from −29 to 100 Hounsfield units [HU]). The CSA and attenuation of this muscle were 35 mm 2 and −12.1 HU, respectively. (c) In an axial image, the region of interest ( red line ) was drawn at the outermost border of right latissimus dorsi muscle at eighth thoracic vertebral level. (d) The CSA and attenuation of latissimus dorsi muscle using CT histogram analysis were 1015 mm 2 and 37.3 HU, respectively. (Color version of figure is available online.)](https://storage.googleapis.com/dl.dentistrykey.com/clinical/MassandFatInfiltrationofIntercostalMusclesMeasuredbyCTHistogramAnalysisandTheirCorrelationswithCOPDSeverity/0_1s20S1076633214000774.jpg)
Get Radiology Tree app to read full this article<
Get Radiology Tree app to read full this article<
Get Radiology Tree app to read full this article<
Get Radiology Tree app to read full this article<
Emphysema Extent
Get Radiology Tree app to read full this article<
Statistical Analysis
Get Radiology Tree app to read full this article<
Results
Clinical Characteristics and Interobserver Reliability of Respiratory Muscle Measurements
Get Radiology Tree app to read full this article<
Table 1
Comparison of the Clinical, Pulmonary Function and Quantitative CT Parameters According to the COPD Severity in 98 Patients
Severity of COPD GOLD 1 ( n = 23) GOLD 2 ( n = 33) GOLD 3 ( n = 22) GOLD 4 ( n = 20)P Value Age (years) 67.0 ± 7.7 71.0 ± 7.7 70.1 ± 8.5 72.8 ± 10.0 .105 BMI (kg/m 2 ) 23.4 ± 2.8 21.4 ± 3.9 21.5 ± 2.6 19.8 ± 2.9 ∗ .002 Smoker (pack-years) 41.9 ± 10.7 37.7 ± 20.0 40.3 ± 16.5 44.0 ± 14.1 .891 FEV 1 \* (L) 2.6 ± 0.39 1.5 ± 0.38 ∗ 1.0 ± 0.38 ∗ , † 0.7 ± 0.39 ∗ , † <.001 FEV 1 pred (%) 94.8 ± 8.3 64.7 ± 8.1 ∗ 41.3 ± 8.1 ∗ , † 30.4 ± 8.3 ∗ , † , ‡ <.001 FEV 1 /FVC (%) 64.8 ± 8.7 52.2 ± 8.5 ∗ 39.8 ± 8.5 ∗ , † 36.7 ± 8.8 ∗ , † <.001 CT emphysema index (%) 1.7 ± 2.2 6.9 ± 7.0 14.2 ± 8.7 ∗ , † 18.4 ± 8.7 ∗ , † <.001 Intercostal CSAs (cm 2 ) 151.5 ± 26.5 130.7 ± 30.3 94.0 ± 31.0 ∗ , † 72.6 ± 24.3 ∗ , † <.001 Intercostal index (cm 2 /kg/m 2 ) 8.2 ± 2.9 5.9 ± 2.0 5.0 ± 1.9 ∗ 3.4 ± 1.4 ∗ , † <.001 Intercostal attenuation (HU) 9.8 ± 7.4 2.8 ± 7.0 ∗ −5.4 ± 7.0 ∗ , † −5.9 ± 7.3 ∗ , † <.001 Latissimus CSAs (cm 2 ) 2344.7 ± 548.2 2074.3 ± 610.2 1662.1 ± 496.2 ∗ 1654.4 ± 566.9 ∗ .001 Latissimus index (cm 2 /kg/m 2 ) 99.8 ± 24.4 94.2 ± 29.6 78.5 ± 28.1 84.8 ± 23.2 .065 Latissimus attenuation (HU) 33.2 ± 9.3 31.2 ± 7.1 28.0 ± 8.0 24.1 ± 7.2 ∗ .013
BMI, body mass index; COPD, chronic obstructive pulmonary disease; CSA, cross-sectional area; CT, computed tomography; FEV 1 *, absolute value of forced expiratory volume in 1 second; FEV 1 pred, percentage of predicted value for forced expiratory volume in 1 second; FVC, forced vital capacity; GOLD, Global Initiative for Chronic Obstructive Lung Disease; HU, Hounsfield unit.
CT emphysema index = ratio of emphysematous to total lung volumes on CT scan; Intercostal index = intercostal CSAs/BMI; Latissimus index = latissimus CSAs/BMI.
The values are expressed as mean ± standard deviation.
Get Radiology Tree app to read full this article<
Get Radiology Tree app to read full this article<
Get Radiology Tree app to read full this article<
Get Radiology Tree app to read full this article<
Get Radiology Tree app to read full this article<
Mass and Fat Infiltration of Respiratory Muscle
Get Radiology Tree app to read full this article<
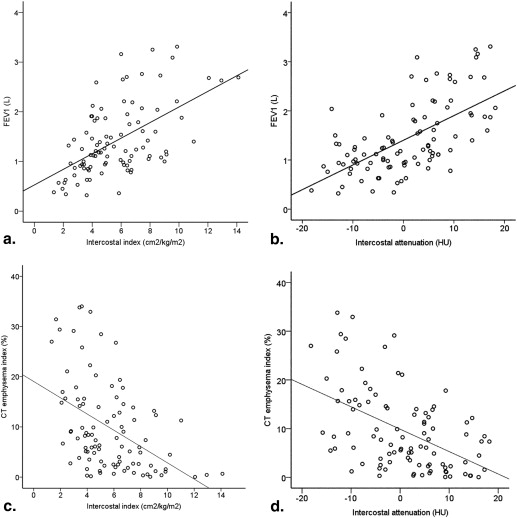
Table 2
Pearson Correlation Analysis of the Clinical, Pulmonary Function and Quantitative CT Parameters
Parameters Intercostal Index Intercostal Attenuation Latissimus Index Latissimus Attenuation Age −0.30 (.003) −0.31 (.002) −0.38 (<.001) −0.42 (<.001) BMI 0.29 (.004) 0.28 (.004) 0.24 (.020) 0.26 (.010) FEV 1 \* (L) 0.57 (<.001) 0.62 (<.001) 0.34 (.001) 0.38 (<.001) FEV 1 pred (%) 0.58 (<.001) 0.58 (<.001) 0.28 (.009) 0.36 (<.001) FEV 1 /FVC 0.45 (<.001) 0.60 (<.001) 0.28 (.009) 0.25 (.012) CT emphysema index −0.36 (<.001) −0.50 (<.001) −0.10 (.48) −0.26 (.010)
BMI, body mass index; CT, computed tomography; FEV 1 *, absolute value of forced expiratory volume in 1 second; FEV 1 pred, percentage of predicted value for forced expiratory volume in 1 second; FVC, forced vital capacity.
CT emphysema index = ratio of emphysematous to total lung volumes on CT scan; Intercostal index = intercostal CSAs/BMI; Latissimus index = latissimus CSAs/BMI.
Values are presented as the Pearson correlation coefficients ( P value).
Get Radiology Tree app to read full this article<
Get Radiology Tree app to read full this article<
Major Predictors of COPD Severity and Airflow Obstruction
Get Radiology Tree app to read full this article<
Table 3
Stepwise Multiple Linear Regression Model for COPD Severity (FEV 1 ) and Airflow Obstruction (FEV 1 /FVC) in Patients with COPD
Variables Standardized β-Coefficients_T_ Partial P__FEV__1 Intercostal CSAs 0.23 0.23 .005 Intercostal attenuation 0.40 0.40 <.001 Emphysema extent −0.23 −0.21 .006 Age −0.21 −0.23 .001FEV__1__/FVC Intercostal attenuation 0.39 4.41 <.001 Emphysema extent −0.40 −4.53 <.001
COPD, chronic obstructive pulmonary disease; CSA, cross-sectional area; FEV 1 , forced expiratory volume in 1 second; FVC, forced vital capacity.
The model included age, BMI, CT emphysema Index, intercostal CSA, and intercostal attenuation.
FEV 1 : predictor = intercostal CSAs, intercostal attenuation, emphysema extent, and age. Adjusted r 2 = 0.64, F = 42.7.
FEV 1 /FVC: predictor = intercostal attenuation and emphysema extent. Adjusted r 2 = 0.46, F = 42.0.
Get Radiology Tree app to read full this article<
Discussion
Get Radiology Tree app to read full this article<
Get Radiology Tree app to read full this article<
Get Radiology Tree app to read full this article<
Get Radiology Tree app to read full this article<
Get Radiology Tree app to read full this article<
Get Radiology Tree app to read full this article<
Get Radiology Tree app to read full this article<
References
1. Kim H.C., Mofarrahi M., Hussain S.N.: Skeletal muscle dysfunction in patients with chronic obstructive pulmonary disease. Int J Chron Obstruct Pulmon Dis 2008; 3: pp. 637-658.
2. Kinsella M., Muller N.L., Abboud R.T., et. al.: Quantitation of emphysema by computed tomography using a “density mask” program and correlation with pulmonary function tests. Chest 1990; 97: pp. 315-321.
3. Matsuoka S., Yamashiro T., Washko G.R., et. al.: Quantitative CT assessment of chronic obstructive pulmonary disease. Radiographics 2010; 30: pp. 55-66.
4. Timmins S.C., Diba C., Farrow C.E., et. al.: The Relationship between airflow obstruction, emphysema extent and small airways function in COPD. Chest 2012; 142: pp. 312-319.
5. Gietema H.A., Muller N.L., Fauerbach P.V., et. al.: Quantifying the extent of emphysema: factors associated with radiologists’ estimations and quantitative indices of emphysema severity using the ECLIPSE cohort. Acad Radiol 2011; 18: pp. 661-671.
6. Desai S.R., Hansell D.M., Walker A., et. al.: Quantification of emphysema: a composite physiologic index derived from CT estimation of disease extent. Eur Radiol 2007; 17: pp. 911-918.
7. Marquis K., Debigare R., Lacasse Y., et. al.: Midthigh muscle cross-sectional area is a better predictor of mortality than body mass index in patients with chronic obstructive pulmonary disease. Am J Respir Crit Care Med 2002; 166: pp. 809-813.
8. Soler-Cataluna J.J., Sanchez-Sanchez L., Martinez-Garcia M.A., et. al.: Mid-arm muscle area is a better predictor of mortality than body mass index in COPD. Chest 2005; 128: pp. 2108-2115.
9. Visser M., Goodpaster B.H., Kritchevsky S.B., et. al.: Muscle mass, muscle strength, and muscle fat infiltration as predictors of incident mobility limitations in well-functioning older persons. J Gerontol A Biol Sci Med Sci 2005; 60: pp. 324-333.
10. McKenzie D.K., Butler J.E., Gandevia S.C.: Respiratory muscle function and activation in chronic obstructive pulmonary disease. J Appl Physiol 2009; 107: pp. 621-629.
11. Gray-Donald K., Gibbons L., Shapiro S.H., et. al.: Nutritional status and mortality in chronic obstructive pulmonary disease. Am J Respir Crit Care Med 1996; 153: pp. 961-966.
12. Vogiatzis I., Habazettl H., Aliverti A., et. al.: Effect of helium breathing on intercostal and quadriceps muscle blood flow during exercise in COPD patients. Am J Physiol Regul Integr Comp Physiol 2011; 300: pp. R1549-R1559.
13. Vogiatzis I., Athanasopoulos D., Habazettl H., et. al.: Intercostal muscle blood flow limitation during exercise in chronic obstructive pulmonary disease. Am J Respir Crit Care Med 2010; 182: pp. 1105-1113.
14. Guerri R., Gayete A., Balcells E., et. al.: Mass of intercostal muscles associates with risk of multiple exacerbations in COPD. Respir Med 2010; 104: pp. 378-388.
15. Levine S., Nguyen T., Friscia M., et. al.: Parasternal intercostal muscle remodeling in severe chronic obstructive pulmonary disease. J Appl Physiol 2006; 101: pp. 1297-1302.
16. Orozco-Levi M., Gea J., Sauleda J., et. al.: Structure of the latissimus dorsi muscle and respiratory function. J Appl Physiol 1995; 78: pp. 1132-1139.
17. Pauwels R.A., Buist A.S., Calverley P.M., et. al.: Global strategy for the diagnosis, management, and prevention of chronic obstructive pulmonary disease. NHLBI/WHO Global Initiative for Chronic Obstructive Lung Disease (GOLD) Workshop summary. Am J Respir Crit Care Med 2001; 163: pp. 1256-1276.
18. Kelley D.E., Slasky B.S., Janosky J.: Skeletal muscle density: effects of obesity and non-insulin-dependent diabetes mellitus. Am J Clin Nutr 1991; 54: pp. 509-515.
19. Goodpaster B.H., Kelley D.E., Thaete F.L., et. al.: Skeletal muscle attenuation determined by computed tomography is associated with skeletal muscle lipid content. J Appl Physiol 2000; 89: pp. 104-110.
20. Mitsiopoulos N., Baumgartner R.N., Heymsfield S.B., et. al.: Cadaver validation of skeletal muscle measurement by magnetic resonance imaging and computerized tomography. J Appl Physiol 1998; 85: pp. 115-122.
21. Mets O.M., Murphy K., Zanen P., et. al.: The relationship between lung function impairment and quantitative computed tomography in chronic obstructive pulmonary disease. Eur Radiol 2012; 22: pp. 120-128.
22. Goedhart D.M., Zanen P.: Selecting the best method to evaluate bronchodilation when analysing bronchodilator studies. Stat Med 2002; 21: pp. 3677-3685.
23. De Troyer A., Kirkwood P.A., Wilson T.A.: Respiratory action of the intercostal muscles. Physiol Rev 2005; 85: pp. 717-756.
24. Goodpaster B.H., Thaete F.L., Kelley D.E.: Composition of skeletal muscle evaluated with computed tomography. Ann N Y Acad Sci 2000; 904: pp. 18-24.
25. Gosker H.R., Engelen M.P., van Mameren H., et. al.: Muscle fiber type IIX atrophy is involved in the loss of fat-free mass in chronic obstructive pulmonary disease. Am J Clin Nutr 2002; 76: pp. 113-119.
26. Campbell J.A., Hughes R.L., Sahgal V., et. al.: Alterations in intercostal muscle morphology and biochemistry in patients with obstructive lung disease. Am Rev Respir Dis 1980; 122: pp. 679-686.
27. Goodpaster B.H., Carlson C.L., Visser M., et. al.: Attenuation of skeletal muscle and strength in the elderly: The Health ABC Study. J Appl Physiol 2001; 90: pp. 2157-2165.
28. Singer J., Yelin E.H., Katz P.P., et. al.: Respiratory and skeletal muscle strength in chronic obstructive pulmonary disease: impact on exercise capacity and lower extremity function. J Cardiopulm Rehabil Prev 2011; 31: pp. 111-119.
29. Marden F.A., Connolly A.M., Siegel M.J., et. al.: Compositional analysis of muscle in boys with Duchenne muscular dystrophy using MR imaging. Skeletal Radiol 2005; 34: pp. 140-148.
30. Barreiro E., de la Puente B., Minguella J., et. al.: Oxidative stress and respiratory muscle dysfunction in severe chronic obstructive pulmonary disease. Am J Respir Crit Care Med 2005; 171: pp. 1116-1124.
31. Simoneau J.A., Colberg S.R., Thaete F.L., et. al.: Skeletal muscle glycolytic and oxidative enzyme capacities are determinants of insulin sensitivity and muscle composition in obese women. FASEB J 1995; 9: pp. 273-278.
32. Ogawa E., Nakano Y., Ohara T., et. al.: Body mass index in male patients with COPD: correlation with low attenuation areas on CT. Thorax 2009; 64: pp. 20-25.
33. Bafadhel M., Umar I., Gupta S., et. al.: The role of CT scanning in multidimensional phenotyping of COPD. Chest 2011; 140: pp. 634-642.
34. Lee Y.K., Oh Y.M., Lee J.H., et. al.: Quantitative assessment of emphysema, air trapping, and airway thickening on computed tomography. Lung 2008; 186: pp. 157-165.
35. Grydeland T.B., Dirksen A., Coxson H.O., et. al.: Quantitative computed tomography: emphysema and airway wall thickness by sex, age and smoking. Eur Respir J 2009; 34: pp. 858-865.