
Rationale and Objectives
Computerized determination of optimal search areas on mammograms for matching breast mass regions depicted on two ipsilateral views remains a challenge for developing multiview-based computer-aided detection (CAD) schemes. The purpose of this study was to compare three methods aimed at matching CAD-cued mass regions depicted on two views and the associated impact on CAD performance.
Materials and Methods
The three search methods used (1) an annular (fan-shaped) band, (2) a straight strip perpendicular to the estimated centerline, and (3) a mixed search area bound on the chest wall side by a straight line and an annular arc on the nipple side, respectively. An image database of 200 examinations with positive results depicting the masses on two views and 200 examinations with negative results was used for testing. Two performance assessment experiments were conducted. The first investigated the maximum matching sensitivity as a function of the search area size, and the second assessed the change in CAD performance using these three search methods.
Results
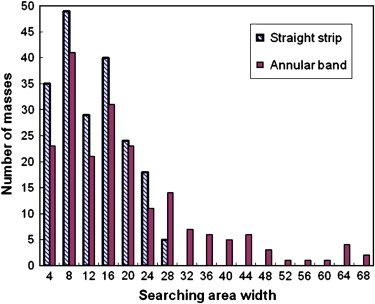
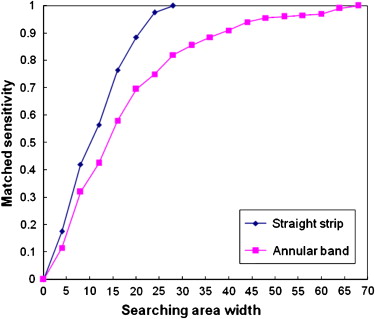
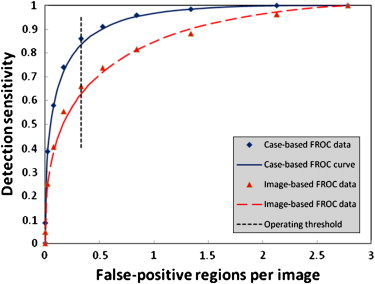
To include all 200 paired mass regions within the search areas, maximum widths were 28 and 68 mm for the use of the straight strip and the annular band search methods, respectively. When applying a single-image-based CAD scheme to this image database, 172 masses (86% sensitivity) and 523 false-positive (FP) regions (0.33 per image) were detected and cued. Among the positive findings, 92 were cued by the CAD system on both views, and 80 were cued on only one view. In an attempt to match as many of the 172 CAD-cued masses (true-positive [TP] regions) on two views by incrementally reducing the CAD threshold inside the different search areas, the CAD scheme generated 158 TP-TP paired matches with 14 TP-FP paired matches, 142 TP-TP paired matches with 30 TP-FP paired matches, and 146 TP-TP paired matches with 26 TP-FP paired matches, using the methods involving the straight strip, the annular band, and the mixed search areas, respectively. Using the straight strip search method, the CAD also eliminated 25% of FP regions initially cued by the single-image-based CAD scheme and generated the lowest case-based FP detection rate, namely, 15% less than that generated by the annular band method.
Conclusions
This study showed that among these three search methods, the straight strip method required a smaller search area and achieved the highest level of CAD performance.
Single-image-based computer-aided detection (CAD) systems for mammograms in which most subtle cancers are cued on only one view and are therefore more likely to be discarded by radiologists as false-positive (FP) cues may be limited in their ability to improve radiologists’ performance . Hence, a number of research groups (including ours) have been attempting to develop multiview-based CAD schemes that enable the incorporation of the related information regarding abnormalities depicted on two ipsilateral (ie, craniocaudal [CC] and mediolateral oblique [MLO]) views into the decision-making process of the schemes. Similarly, this information can also be used to improve CAD performance in terms of maximizing the number of paired depicted and cued masses.
The first step needed in these multiview-based CAD schemes is the matching (pairing) of detected suspicious regions depicting the same abnormality (ie, mass) on two views. For this purpose, the scheme must detect either one or two fiducial landmarks (eg, the nipple and/or the chest wall) to enable a “global” registration of the paired images in question by establishing a reference matching coordinates for both views. Once a suspicious mass region is detected on one view (a “queried region”), the scheme identifies a search area on the corresponding ipsilateral view and searches for a CAD-detected suspicious region within this area that is considered the “most similar” to the queried region. These two “matched” regions are defined as a “pair” of mass regions. Under the assumption that true-positive (TP) mass regions have a higher probability than FP detections to be correctly matched on two views , the resulting overall performance of multiview-based CAD schemes may improve by keeping (cuing) “correctly matched” suspicious mass regions depicted on two views while discarding all unmatched regions as FP identifications .
Get Radiology Tree app to read full this article<
Get Radiology Tree app to read full this article<
Get Radiology Tree app to read full this article<
Get Radiology Tree app to read full this article<
Get Radiology Tree app to read full this article<
Materials and methods
Testing Image Data Set
Get Radiology Tree app to read full this article<
Get Radiology Tree app to read full this article<
Get Radiology Tree app to read full this article<
The Three Search Methods
Get Radiology Tree app to read full this article<
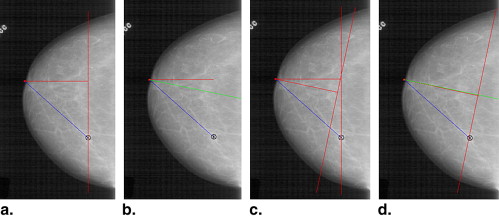
![Figure 3, Demonstration of the three search methods for matching a mass depicted on two views. A mass region with two associated distances (Euclidean distance [ dE1 d1E ] and projected distance along the centerline that is perpendicular to the chest wall) between the nipple and the center of the mass as depicted on a craniocaudal view are shown in (a) . The three types of search areas defined on the mediolateral oblique view are represented as an annular band (b) , a straight line–based strip (c) , and a mixed area with a straight line–based boundary in the posterior and an arc in the front (d) .](https://storage.googleapis.com/dl.dentistrykey.com/clinical/MatchingBreastMassesDepictedonDifferentViews/2_1s20S107663320900302X.jpg)
Get Radiology Tree app to read full this article<
Get Radiology Tree app to read full this article<
Get Radiology Tree app to read full this article<
Modification of the Straight Strip–Based Search Method
Get Radiology Tree app to read full this article<
Get Radiology Tree app to read full this article<
Get Radiology Tree app to read full this article<
Get Radiology Tree app to read full this article<
Performance Assessment Experiments
Get Radiology Tree app to read full this article<
Get Radiology Tree app to read full this article<
Results
Get Radiology Tree app to read full this article<
Get Radiology Tree app to read full this article<
Get Radiology Tree app to read full this article<
Get Radiology Tree app to read full this article<
Get Radiology Tree app to read full this article<
Table 1
Comparison of Mass Detection Performance Levels of the Single-Image-Based CAD Scheme and a Multiview-Based CAD Scheme When Using Each of the Three Search Methods
Multi-view based CAD scheme using different search method Variable Single-Image-Based CAD Scheme Straight Strip Search Method Annular Band Search Method Annular Band Search Method Mixed Search Method Minimum search area width (mm) N/A 28 28 68 20 CAD-cued masses 172 172 148 172 172 Case-based sensitivity 86% 86% 74% 86% 86% Masses cued on two views 92 158 137 142 146 Average no. of matching candidates N/A 1.67 1.62 2.73 2.33 CAD-cued FP regions 523 676 653 808 792 Cues discarded initially as FP regions N/A 131 142 62 76 No. of case-based FP cues 462 331 321 389 383 Case-based FP rate per image 0.29 0.21 0.20 0.24 0.24
CAD, computer-aided detection; FP, false-positive; N/A, not applicable.
Get Radiology Tree app to read full this article<
Get Radiology Tree app to read full this article<
Get Radiology Tree app to read full this article<
Discussion
Get Radiology Tree app to read full this article<
Get Radiology Tree app to read full this article<
Get Radiology Tree app to read full this article<
Get Radiology Tree app to read full this article<
Get Radiology Tree app to read full this article<
References
1. Gur D., Stalder J.S., Hardesty L.A., et. al.: Computer-aided detection performance in mammographic examination of masses: assessment. Radiology 2004; 233: pp. 418-423.
2. Khoo L.A., Taylor P., Given-Wilson R.M.: Computer-aided detection in the United Kingdom national breast screening program: prospective study. Radiology 2005; 237: pp. 444-449.
3. Ko J.M., Nicholas M.J., Mendel J.B., Slanetz P.J.: Prospective assessment of computer-aided detection in interpretation of screening mammograms. AJR Am J Roentgenol 2006; 187: pp. 1483-1491.
4. Nishikawa R.M., Edwards A.V., Schmidt R.A., Papaioannou J.: Can radiologists recognize that a computer has identified cancers that they have overlooked?. Proc SPIE 2006; 6146: pp. 1-8.
5. Nishikawa R.M., Kallergi M.: Computer-aided detection in its present form is not an effective aid for screening mammography. Med Phys 2006; 33: pp. 811-814.
6. Fenton J.J., Taplin S.H., Carney P.A., et. al.: Influence of computer-aided detection on performance of screening mammography. N Engl J Med 2007; 356: pp. 1399-1409.
7. Good W.F., Zheng B., Chang Y.H., et. al.: Multi-image CAD employing features derived from ipsilateral mammographic views. Proc SPIE 1999; 3661: pp. 474-485.
8. Sallam M.Y., Bowyer K.W.: Registration and difference analysis of corresponding mammogram images. Med Imaging Anal 1999; 3: pp. 103-118.
9. Kita Y., Highnam R.P., Brady J.M.: Correspondence between different view breast x rays using curved epipolar lines. Comput Vis Image Underst 2001; 83: pp. 38-56.
10. Paquerault S., Petrick N., Chan H.P., Sahiner B., Helvie M.A.: Improvement of computerized mass detection on mammograms: fusion of two-view information. Med Phys 2002; 29: pp. 238-247.
11. Zheng B., Leader J.K., Abrams G.S., et. al.: Multiview based computer-aided detection scheme for breast masses. Med Phys 2006; 33: pp. 3135-3143.
12. van Engeland S., Timp S., Karssemeijer N.: Finding corresponding regions of interest in mediolateral oblique and craniocaudal mammographic views. Med Phys 2006; 33: pp. 3203-3212.
13. van Engeland S., Karssemeijer N.: Combining two mammographic projections in a computer aided mass detection method. Med Phys 2007; 34: pp. 898-905.
14. Pu J., Zheng B., Leader J.K., Gur D.: An ellipse-fitting based method for efficient registration of breast masses on two mammographic views. Med Phys 2008; 35: pp. 487-494.
15. Zheng B., Leader J.K., Abrams G., et. al.: Computer-aided detection schemes: the effect of limiting the number of cued regions in each case. AJR Am J Roentgenol 2004; 182: pp. 579-583.
16. Zheng B., Lu A., Hardesty L.A., et. al.: A method to improve visual similarity of breast masses for an interactive computer-aided diagnosis environment. Med Phys 2006; 33: pp. 111-117.
17. Sahiner B., Chan H.P., Hadjiiski L.M., et. al.: Joint two-view information for computerized detection of microcalcifications on mammograms. Med Phys 2006; 33: pp. 2574-2585.