
Rationale and Objectives
To evaluate the detectability of urinary calculi on material decomposition (MD) images generated from spectral computed tomography (CT) and identify the influencing factors.
Materials and Methods
Forty-six patients were examined with true nonenhanced (TNE) CT and spectral CT urography in the excretory phase. The contrast medium was removed from excretory phase images using water-based (WB) and calcium-based (CaB) MD analysis. The sensitivity for detection on WB and CaB images was evaluated using TNE results as the reference standard. The signal-to-noise ratio (SNR) and contrast-to-noise ratio (CNR) on MD images were evaluated. Using logistic regression, the influences of image noise, attenuation, stone size, and patient’s body mass index (BMI) were assessed. Threshold values with maximal sensitivity and specificity were calculated by means of receiver operating characteristic analyses.
Results
One hundred thirty-six calculi were detected on TNE images; 98 calculi were identified on WB images (sensitivity, 72.06%) and 101 calculi on CaB images (sensitivity, 74.26%). Sensitivities were 76.92% for the 3–5-mm stones and 84.51% for the 5-mm or larger stones on both WB and CaB images but reduced to 46.15% on WB images and 53.85% on CaB images for small calculi (<3 mm). Compared to WB images, CaB images showed lower image noise, higher SNR but similar CNR. Larger stone sizes (both >2.71 mm on WB and CaB) and greater CT attenuation (>280 Hounsfield units [HU] on WB, >215 HU on CaB) of the urinary stones were significantly associated with higher stone visibility rates on WB and CaB images ( P ≤ .003). Image noise and BMI showed no impact on the stone detection.
Conclusions
MD images generated from spectral CT showed good reliability for the detection of large (>2.71 mm) and hyperattenuating (>280 HU on WB, >215 HU on CaB) urinary calculi.
Material characterization with the use of dual-energy computed tomography (DECT) has been described in the late 1970s . However, DECT was not adopted widely for clinical use until recently because of the limited technology. Currently, the two common approaches to realize DECT scanning are the use of dual-source, dual-detector assembly for the simultaneous generation of low- and high-energy CT images and the use of single-source, single-detector system for the simultaneous acquisition of the low- and high-energy projection sets in a single examination. DECT provides material decomposition (MD) images for material characterization and has been shown to be useful for determining the composition of urinary stones .
Traditionally, nonenhanced CT is used for the detection of urinary stones because urinary stones are often obscured by high-attenuating iodinated contrast material in the renal parenchyma or collecting system in the contrast-enhanced CT images . However, with the use of virtual nonenhanced (VNE) images generated from DECT, iodine can be subtracted from the contrast-enhanced CT images and be used to depict urinary stones submerged in iodine solutions , and detect urinary stones in the pyelographic phase images . Therefore, with the creation of VNE CT scans, nonenhanced CT during CT urography could be achieved without obtaining a true nonenhanced (TNE) scan for the detection of urinary stones to reduce radiation dose and scanning time. However, the accuracy of stone detection on VNE images could not be exactly equivalent to TNE images. Recently, it has been shown that VNE images in the dual-source DECT (dsDECT) generated from the excretory phase enables the depiction of urinary stones larger than 5 mm with high sensitivities; however, there are limitations regarding smaller stone sizes (sensitivity of 16%–29% for <3-mm stones) . Urinary calculi with a diameter of <3 mm can cause symptoms such as pain and microscopic hematuria. Unfortunately, this cannot be assured in the current state of VNE dsDECT imaging.
Get Radiology Tree app to read full this article<
Get Radiology Tree app to read full this article<
Materials and methods
Patient Population
Get Radiology Tree app to read full this article<
CT Protocol
Get Radiology Tree app to read full this article<
Get Radiology Tree app to read full this article<
Get Radiology Tree app to read full this article<
Get Radiology Tree app to read full this article<
Image Interpretation
Quantitative analysis
Get Radiology Tree app to read full this article<
Get Radiology Tree app to read full this article<
Qualitative analysis
Get Radiology Tree app to read full this article<
Get Radiology Tree app to read full this article<
Get Radiology Tree app to read full this article<
Statistical Analyses
Get Radiology Tree app to read full this article<
Get Radiology Tree app to read full this article<
Results
Get Radiology Tree app to read full this article<
Get Radiology Tree app to read full this article<
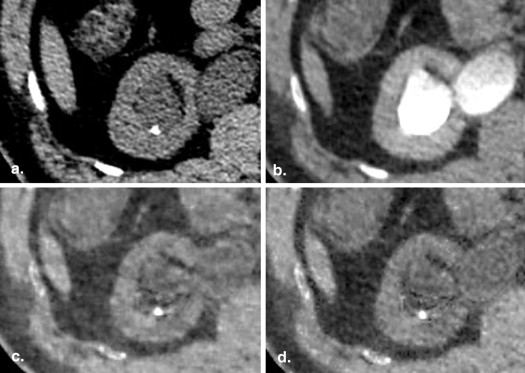
![Figure 3, Transverse computed tomography images of a 63-year-old man. (a) True nonenhanced image shows a small calyceal calculus (1.8 × 1.8 mm) with high density (320 Hounsfield units [HU], long arrow ) and a smaller calyceal calculus (1.4 × 1.3 mm) with relative low density (180 HU, short arrow ) in the lower pole of left kidney. (b) Calculi are masked without iodine subtraction on the corresponding image in the excretory phase. After optimal iodine subtraction, the small calculus with high density is depicted clearly on the water-based image (c) and calcium-based image (d) , but the smaller calculus with low density is missed because of oversubtraction of stone signal.](https://storage.googleapis.com/dl.dentistrykey.com/clinical/MaterialDecompositionImagesGeneratedfromSpectralCT/2_1s20S1076633213004649.jpg)
Get Radiology Tree app to read full this article<
Get Radiology Tree app to read full this article<
Table 1
Calculus Diameter Measurements on WB, CaB, and TNE Images
Parameter WB Images ( n = 98) TNE images ∗ ( n = 98)P † CaB Images ( n = 101) TNE Images ‡ ( n = 101)P § Long-axis diameter (mm) 8.09 ± 8.08 8.40 ± 8.26 .041 7.91 ± 8.11 8.21 ± 8.20 .083 Short-axis diameter (mm) 4.68 ± 3.91 5.05 ± 3.81 <.001 4.63 ± 3.91 4.96 ± 3.79 .015
CaB, calcium-based; TNE, true nonenhanced; WB, water-based.
Get Radiology Tree app to read full this article<
Get Radiology Tree app to read full this article<
Get Radiology Tree app to read full this article<
Get Radiology Tree app to read full this article<
Get Radiology Tree app to read full this article<
Get Radiology Tree app to read full this article<
Get Radiology Tree app to read full this article<
Table 2
ROC Analyses of the Parameters Influencing the Stone Detection Rate on WB and CaB Images
Parameter WB Images CaB Images Threshold Sensitivity (%) Specificity (%) AUC Threshold Sensitivity (%) Specificity (%) AUC Maximum attenuation of calculi (HU) 280 82.65 81.58 0.845 215 88.12 74.29 0.839 Long-axis diameter(mm) 2.71 69.39 76.32 0.769 2.71 67.33 74.29 0.745
AUC, area under the curve; CaB, calcium-based; HU, Hounsfield units; ROC, receiver operating characteristics; WB, water-based.
Table 3
Sensitivity of WB and CaB Images for Detecting Urinary Calculi by Calculi Size and Patient BMI
 WB Images CaB Images <3 3–5 ≥5 Any <3 3–5 ≥5 Any Any 46.15 (18/39) 76.92 (20/26) 84.51 (60/71) 72.06 (98/136) 53.85 (21/39) 76.92 (20/26) 84.51 (60/71) 74.26 (101/136) <24 50 (6/12) 70 (7/10) 86.67 (26/30) 75 (39/52) 60 (6/10) 70 (7/10) 86.67 (26/30) 78 (39/50) 24–28.9 45.83 (11/24) 78.57 (11/14) 82.05 (32/39) 70.13 (54/77) 52.78 (13/26) 78.57 (11/14) 82.05 (32/39) 70.89 (56/79) ≥29 33.33 (1/3) 100 (2/2) 100 (2/2) 71.43 (5/7) 66.67 (2/3) 100 (2/2) 100 (2/2) 85.71 (6/7)
BMI, body mass index; CaB, calcium-based; D, diameter; WB, water based.
Numbers in parentheses are numbers of calculi.
*Diameter, in millimeter.
Get Radiology Tree app to read full this article<
Discussion
Get Radiology Tree app to read full this article<
Get Radiology Tree app to read full this article<
Get Radiology Tree app to read full this article<
Get Radiology Tree app to read full this article<
Get Radiology Tree app to read full this article<
Get Radiology Tree app to read full this article<
Get Radiology Tree app to read full this article<
Get Radiology Tree app to read full this article<
Conclusion
Get Radiology Tree app to read full this article<
Acknowledgment
Get Radiology Tree app to read full this article<
References
1. Millner M.R., McDavid W.D., Waggener R.G., et. al.: Extraction of information from CT scans at different energies. Med Phys 1979; 6: pp. 70-71.
2. Chiro G.D., Brooks R.A., Kessler R.M., et. al.: Tissue signatures with dual-energy computed tomography. Radiology 1979; 131: pp. 521-523.
3. Primak A.N., Fletcher J.G., Vrtiska T.J., et. al.: Noninvasive differentiation of uric acid versus non-uric acid kidney stones using dual-energy CT. Acad Radiol 2007; 14: pp. 1441-1447.
4. Hidas G., Eliahou R., Duvdevani M., et. al.: Determination of renal stone composition with dual-energy CT: in vivo analysis and comparison with x-ray diffraction. Radiology 2010; 257: pp. 394-401.
5. Smith R.C., Rosenfield A.T., Choe K.A., et. al.: Acute flank pain: comparison of non-contrast-enhanced CT and intravenous urography. Radiology 1995; 194: pp. 789-794.
6. Graser A., Johnson T.R., Hecht E.M., et. al.: Dual-energy CT in patients suspected of having renal masses: can virtual nonenhanced images replace true nonenhanced images. Radiology 2009; 252: pp. 433-440.
7. De Cecco C.N., Buffa V., Fedeli S., et. al.: Dual energy CT (DECT) of the liver: conventional versus virtual unenhanced images. Eur Radiol 2010; 20: pp. 2870-2875.
8. Song K.D., Kim C.K., Park B.K., et. al.: Utility of iodine overlay technique and virtual unenhanced images for the characterization of renal masses by dual-energy CT. AJR Am J Roentgenol 2011; 197: pp. W1076-W1082.
9. De Cecco C.N., Darnell A., Macias N., et. al.: Virtual unenhanced images of the abdomen with second-generation dual-source dual-energy computed tomography: image quality and liver lesion detection. Invest Radiol 2013; 48: pp. 1-9.
10. Takahashi N., Hartman R.P., Vrtiska T.J., et. al.: Dual-energy CT iodine-subtraction virtual unenhanced technique to detect urinary stones in an iodine-filled collecting system: a phantom study. AJR Am J Roentgenol 2008; 190: pp. 1169-1173.
11. Scheffel H., Stolzmann P., Frauenfelder T., et. al.: Dual-energy contrast-enhanced computed tomography for the detection of urinary stone disease. Invest Radiol 2007; 42: pp. 823-829.
12. Takahashi N., Vrtiska T.J., Kawashima A., et. al.: Detectability of urinary stones on virtual nonenhanced images generated at pyelographic-phase dual-energy CT. Radiology 2010; 256: pp. 184-190.
13. Mangold S., Thomas C., Fenchel M., et. al.: Virtual nonenhanced dual-energy CT urography with tin-filter technology: determinants of detection of urinary calculi in the renal collecting system. Radiology 2012; 264: pp. 119-125.
14. Corazon B., Tommaso C.S., Jeffery C., et. al.: Appropriate body-mass index for Asian populations and its implications for policy and intervention strategies. Lancet 2004; 363: pp. 157-163.
15. Saw K.C., McAteer J.A., Monga A.G., et. al.: Helical CT of urinary calculi: effect of stone composition, stone size, and scan collimation. AJR Am J Roentgenol 2000; 175: pp. 329-332.
16. Sahni V.A., Shinagare A.B., Silverman S.G.: Virtual unenhanced CT images acquired from dual-energy CT urography: accuracy of attenuation values and variation with contrast material phase. Clin Radiol 2013; 68: pp. 264-271.
17. Primak A.N., Ramirez G.J.C., Liu X., et. al.: Improved dual-energy material discrimination for dual-source CT by means of additional spectral filtration. Med Phys 2009; 36: pp. 1359-1369.
18. Miller O.F., Kane C.J.: Time to stone passage for observed ureteral calculi: a guide for patient education. J Urol 1999; 162: pp. 688-690. Discussion 690-691
19. Preminger G.M., Tiselius H.G., Assimos D.G., et. al.: 2007 Guideline for the management of ureteral calculi. Eur Urol 2007; 52: pp. 1610-1631.
20. Miller N.L., Lingeman J.E.: Management of kidney stones. BMJ 2007; 334: pp. 468-472.
21. Vrtiska T.J., Hartman R.P., Kofler J.M., et. al.: Spatial resolution and radiation dose of a 64-MDCT scanner compared with published CT urography protocols. AJR Am J Roentgenol 2009; 192: pp. 941-948.