
Rationale and Objectives
Our purpose in this study was to develop an automated computer-aided volumetry (CAV) scheme for quantifying pneumothorax in multidetector computed tomography (MDCT) images for pediatric patients and to investigate the imaging parameters that may affect its accuracy.
Materials and Methods
Fifty-eight consecutive pediatric patients (mean age 12 ± 6 years) with pneumothorax who underwent MDCT for evaluation were collected retrospectively for this study. All cases were imaged by a 16- or 64-MDCT scanner with weight-based kilovoltage, low-dose tube current, 1.0−1.5 pitch, 0.6−5.0 mm slice thickness, and a B70f (sharp) or B31f (soft) reconstruction kernel. Sixty-three pneumothoraces ≥1 mL were visually identified in the left ( n = 30) and right ( n = 33) lungs. Each identified pneumothorax was contoured manually on an Amira workstation V4.1.1 (Mercury Computer Systems, Chelmsford, MA) by two radiologists in consensus. The computerized volumes of the pneumothoraces were determined by application of our CAV scheme. The accuracy of our automated CAV scheme was evaluated by comparison between computerized volumetry and manual volumetry, for the total volume of pneumothoraces in the left and right lungs.
Results
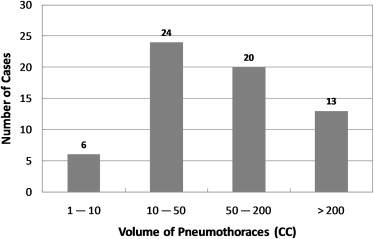
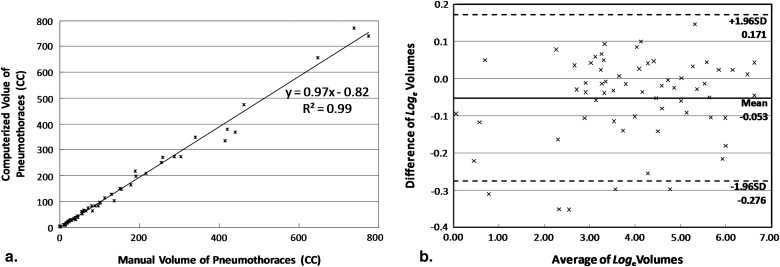
The mean difference between the computerized volumetry and the manual volumetry for all 63 pneumothoraces ≥1 mL was 8.2%. For pneumothoraces ≥10 mL, ≥50 mL, and ≥200 mL, the mean differences were 7.7% ( n = 57), 7.3% ( n = 33), and 6.4% ( n = 13), respectively. The correlation coefficient was 0.99 between the computerized volume and the manual volume of pneumothoraces. Bland-Altman analysis showed that computerized volumetry has a mean difference of -5.1% compared to manual volumetry. For all pneumothoraces ≥10 mL, the mean differences for slice thickness ≤1.25 mm, = 1.5 mm, and = 5.0 mm were 6.1% ( n = 28), 3.5% ( n = 10), and 12.2% ( n = 19), respectively. For the two reconstruction kernels, B70f and B31f, the mean differences were 6.3% ( n = 42, B70f) and 11.7% ( n = 15, B31f), respectively.
Conclusion
Our automated CAV scheme provides an accurate measurement of pneumothorax volume in MDCT images of pediatric patients. For accurate volumetric quantification of pneumothorax in children in MDCT images by use of the automated CAV scheme, we recommended reconstruction parameters based on a slice thickness ≤1.5 mm and the reconstruction kernel B70f.
Pneumothorax is a potentially life-threatening condition which can occur in up to 20% of pediatric patients who suffer from chest trauma . The early detection and accurate measurement of the size of pneumothorax play an important role in proper management of pediatric patients who have pneumothorax. Failure to identify even a small pneumothorax, which may potentially enlarge rapidly and result in cardiopulmonary compromise, can lead to detrimental consequences, including death.
Although chest radiography has been used as an initial imaging modality for evaluating pneumothorax in children, it has been reported that the false-negative rate of detecting pneumothorax on chest radiographs can be as high as 50% . Studies found that the estimation of pneumothorax size on chest x-ray is inaccurate and inconsistent . Multidetector computed tomography (MDCT), which provides the gold standard for detecting occult traumatic pneumothorax , also provides an imaging modality for more accurate diagnosis and quantification of pneumothorax.
Get Radiology Tree app to read full this article<
Get Radiology Tree app to read full this article<
Get Radiology Tree app to read full this article<
Material and methods
Institutional Review Board Approval
Get Radiology Tree app to read full this article<
Study Patients
Get Radiology Tree app to read full this article<
Get Radiology Tree app to read full this article<
MDCT Imaging
Patient Preparation
Get Radiology Tree app to read full this article<
MDCT Imaging Technique
Get Radiology Tree app to read full this article<
Computerized Volumetry of Pneumothorax
Get Radiology Tree app to read full this article<
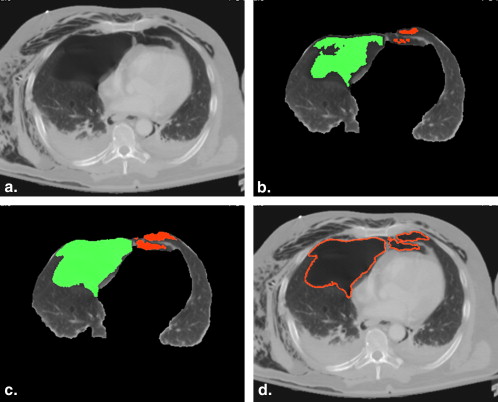
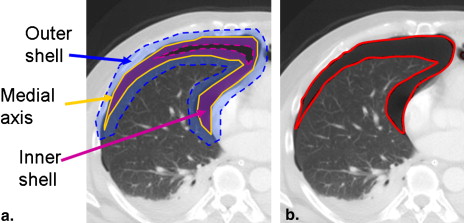
Extraction of Pleural Region
Get Radiology Tree app to read full this article<
Get Radiology Tree app to read full this article<

Get Radiology Tree app to read full this article<
Get Radiology Tree app to read full this article<
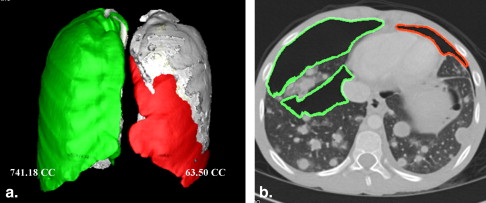
Detection of Pneumothoraces
Get Radiology Tree app to read full this article<
Get Radiology Tree app to read full this article<
Get Radiology Tree app to read full this article<
Segmentation of Pneumothoraces
Get Radiology Tree app to read full this article<
Get Radiology Tree app to read full this article<
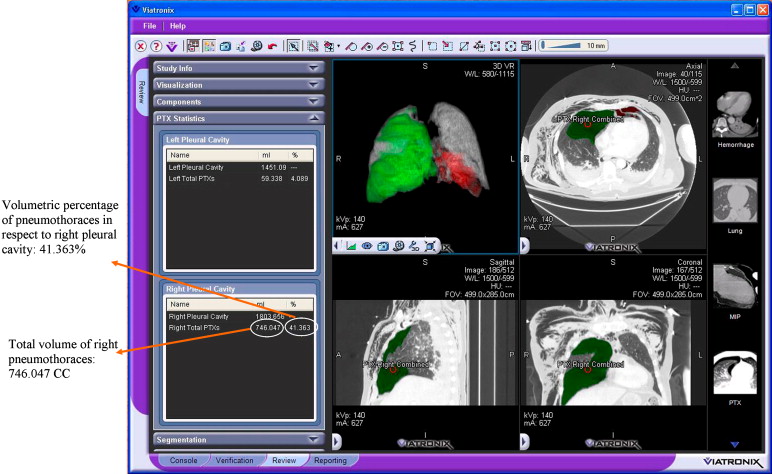
Volumetry of Pneumothoraces
Get Radiology Tree app to read full this article<
Get Radiology Tree app to read full this article<
Get Radiology Tree app to read full this article<
Get Radiology Tree app to read full this article<
Data Analysis
Get Radiology Tree app to read full this article<
Get Radiology Tree app to read full this article<
Get Radiology Tree app to read full this article<
Get Radiology Tree app to read full this article<
Get Radiology Tree app to read full this article<
Diff(Vmanual,Vcomputerized)=|Vmanual,Vcomputerized|Vmanual∗100% D
i
f
f
(
V
m
a
n
u
a
l
,
V
c
o
m
p
u
t
e
r
i
z
e
d
)
=
|
V
m
a
n
u
a
l
,
V
c
o
m
p
u
t
e
r
i
z
e
d
|
V
m
a
n
u
a
l
∗
100
%
Get Radiology Tree app to read full this article<
Results
Get Radiology Tree app to read full this article<
Get Radiology Tree app to read full this article<
Get Radiology Tree app to read full this article<
Get Radiology Tree app to read full this article<
Get Radiology Tree app to read full this article<
Table 1
Relative Differences for 57 Pneumothoraces ≥10 mL
Category Mean Value 95% CI Pneumothorax size ≥10 mL 7.7% (n = 57) (5.75−9.62%) ≥50 mL 7.3% (n = 33) (5.10−9.53%) ≥200 mL 6.4% (n = 13) (3.29−9.66%) Slice thickness ≤1.25 mm 6.1% (n = 28) (4.24−7.94%) 1.5 mm 3.5% (n = 10) (1.97−5.13%) 5.0 mm 12.2% (n = 19) (7.79−16.65%) Reconstruction kernels B70f 6.3% (n = 42) (4.46−8.08%) B31f 11.7% (n = 15) (6.75−16.58%)
Get Radiology Tree app to read full this article<
Get Radiology Tree app to read full this article<
Get Radiology Tree app to read full this article<
Table 2
Performance of Visual Assessment Based on the Pneumothorax Volumes
Minimum (mL) Maximum (mL) Mean (mL) Small ( n = 24) 1.01 151.19 31.89 Medium ( n = 16) 1.67 334.92 75.46 Large ( n = 23) 9.17 771.80 264.37
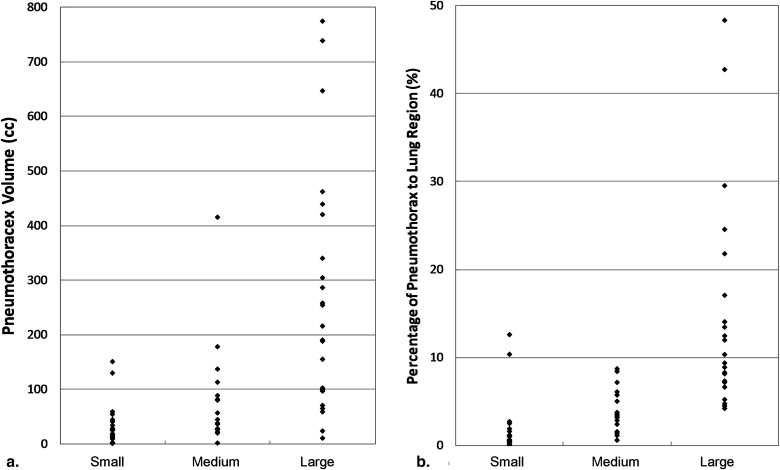
Table 3
Performance of Visual Assessment Based on the Percentages of Pneumothoraces Compared to Lung Region
Minimum (%) Maximum (%) Mean (%) Small ( n = 24) 0.07 9.22 1.54 Medium ( n = 16) 0.59 8.04 3.76 Large ( n = 23) 4.26 45.75 14.20
Get Radiology Tree app to read full this article<
Discussion
Get Radiology Tree app to read full this article<
Get Radiology Tree app to read full this article<
Get Radiology Tree app to read full this article<
Get Radiology Tree app to read full this article<
Get Radiology Tree app to read full this article<
Get Radiology Tree app to read full this article<
Get Radiology Tree app to read full this article<
Get Radiology Tree app to read full this article<
Get Radiology Tree app to read full this article<
Get Radiology Tree app to read full this article<
References
1. Patel R.P., Hernanz-Schulman M., Hilmes M.A., et. al.: Pediatric chest CT after trauma: impact on surgical and clinical management. Pediatr Radiol 2010; 40: pp. 1246-1253.
2. Trupka A., Waydhas C., Hallfeldt K.K., et. al.: Value of thoracic computed tomography in the first assessment of severely injured patients with blunt chest trauma: results of a prospective study. J Trauma 1997; 43: pp. 405-411. discussion 411–412
3. Ball C.G., Kirkpatrick A.W., Laupland K.B., et. al.: Factors related to the failure of radiographic recognition of occult posttraumatic pneumothoraces. Am J Surg 2005; 189: pp. 541-546. discussion 546
4. Omert L., Yeaney W.W., Protetch J.: Efficacy of thoracic computerized tomography in blunt chest trauma. Am Surg 2001; 67: pp. 660-664.
5. Light R.W.: Management of spontaneous pneumothorax. Am Rev Respir Dis 1993; 148: pp. 245-248.
6. Collins C.D., Lopez A., Mathie A., et. al.: Quantification of pneumothorax size on chest radiographs using interpleural distances: regression analysis based on volume measurements from helical CT. AJR Am J Roentgenol 1995; 165: pp. 1127-1130.
7. Hoi K., Turchin B., Kelly A.M.: How accurate is the Light index for estimating pneumothorax size?. Australas Radiol 2007; 51: pp. 196-198.
8. Neff M.A., Monk J.S., Peters K., et. al.: Detection of occult pneumothoraces on abdominal computed tomographic scans in trauma patients. J Trauma 2000; 49: pp. 281-285.
9. Cameron P.: Textbook of adult emergency medicine.2000.Churchill LivingstoneNew York
10. Noppen M., De Keukeleire T.: Pneumothorax. Respiration 2008; 76: pp. 121-127.
11. Ball C.G., Kirkpatrick A.W., Laupland K.B., et. al.: Incidence, risk factors, and outcomes for occult pneumothoraces in victims of major trauma. J Trauma 2005; 59: pp. 917-924. discussion 924–25
12. Stafford R.E., Linn J., Washington L.: Incidence and management of occult hemothoraces. Am J Surg 2006; 192: pp. 722-726.
13. Ball C.G., Lord J., Laupland K.B., et. al.: Chest tube complications: how well are we training our residents?. Can J Surg 2007; 50: pp. 450-458.
14. Enderson B.L., Abdalla R., Frame S.B., et. al.: Tube thoracostomy for occult pneumothorax: a prospective randomized study of its use. J Trauma 1993; 35: pp. 726-729. discussion 729–730
15. Etoch S.W., Bar-Natan M.F., Miller F.B., et. al.: Tube thoracostomy. Factors related to complications. Arch Surg 1995; 130: pp. 521-525. discussion 525–526
16. Bailey R.C.: Complications of tube thoracostomy in trauma. J Accid Emerg Med 2000; 17: pp. 111-114.
17. Johnson G.: Traumatic pneumothorax: is a chest drain always necessary?. J Accid Emerg Med 1996; 13: pp. 173-174.
18. Plurad D., Green D., Demetriades D., et. al.: The increasing use of chest computed tomography for trauma: is it being overutilized?. J Trauma 2007; 62: pp. 631-635.
19. Cai W., Tabbara M., Takata N., et. al.: MDCT for automated detection and measurement of pneumothoraces in trauma patients. AJR Am J Roentgenol 2009; 192: pp. 830-836.
20. Cai W., Holalkere N., Harris G., et. al.: Dynamic-threshold level set method for volumetry of porcine kidney in CT images: in-vivo and ex-vivo assessment of the accuracy of volume measurement. Acad Radiol 2007; 14: pp. 890-896.
21. Bland J.M., Altman D.G.: Statistical methods for assessing agreement between two methods of clinical measurement. Lancet 1986; 1: pp. 307-310.
22. Bland J.M., Altman D.G.: Measuring agreement in method comparison studies. Stat Methods Med Res 1999; 8: pp. 135-160.