
Rationale and Objectives
The purpose of this study is to evaluate the reproducibility and agreement of tumor necrosis quantification performed by two-dimensional and volumetric methods in a cohort of patients with hepatocellular carcinoma (HCC) treated with yttrium-90 ( 90 Y) radioembolization.
Materials and Methods
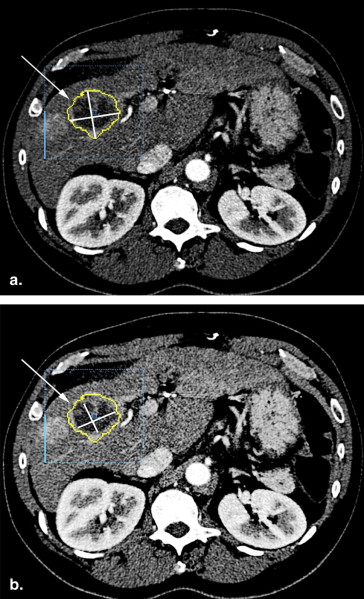
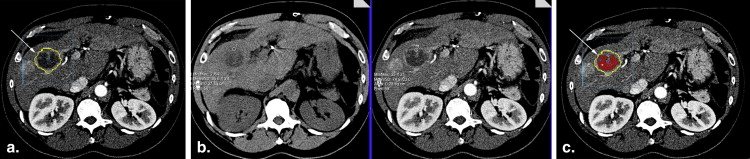
Twenty-nine consecutive patients (21 men, 8 women; mean age 66.6 years; age range, 44–90 years) with HCC treated with 90 Y radioembolization that underwent liver multidetector computed tomography (MDCT) were included. Two independent radiologists evaluated the necrosis proportion of the lesions with two-dimensional (2D) measurements according to the European Association for the Study of the Liver guidelines, and with a volumetric method using a voxel-by-voxel analysis. Interobserver reproducibility for each method was assessed by using within-subject coefficients of variation (WSCV), intraclass correlation coefficients (ICC), and Lin’s concordance correlation coefficients (LCC). Agreement between both methods was assessed by using the Bland-Altman plot and the paired t -test.
Results
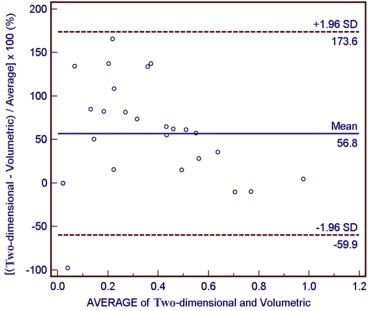
The volumetric method was more reproducible (WSCV = 27.8%; ICC = 0.914; LCC = 0.909) than the 2D (WSCV = 43.8%; ICC = 0.723; LCC = 0.841). There was a significant difference in the mean calculated necrosis proportions based on 2D and volumetric methods ( P = .0129).
Conclusion
Voxel-by-voxel quantification of HCC necrosis is a more reproducible method than 2D analysis.
Hepatocellular carcinoma (HCC) is potentially curable by surgical resection or transplantation , but usually only 15%–25% of the patients are candidates for surgery . Because most chemotherapeutic agents have marginal antitumoral effects , a significant portion of patients are treated with target-directed therapies, such as radiofrequency ablation, transcatheter arterial chemoembolization (TACE), or yttrium-90 ( 90 Y) radioembolization .
Multidetector-row computed tomography (MDCT) has been widely used for assessing tumor response after therapy . To develop a common language and standardize the response evaluation, several criteria were developed, such as the World Health Organization (WHO) guidelines, the Response Evaluation Criteria in Solid Tumors (RECIST), and its more recent update, RECIST 1.1 . These guidelines require decrease of the tumor size as a marker for a positive response . Response to locoregional therapy, however, may not lead to a reduction in tumor volume . Indeed, with directed therapy, tumoral tissue may undergo necrosis, which may even lead to an increase in the size of the lesion . Therefore, the European Association for the Study of the Liver (EASL) has published a guideline recommending that the reduction in the amount of tumor viable tissue should be used to assess tumor response to localized treatment (where viable tissue means tumor regions that did not undergo necrosis) . Since then, the evaluation of tumor viable tissue has been increasingly used as a surrogate marker to assess response to locoregional therapies. The EASL guidelines recommend quantifying the amount of necrosis as a way to estimate the amount of viable tumor tissue. Most investigators have applied the two-dimensional (2D) measurements modified from WHO guidelines on a single axial plane to quantify necrosis . The modified RECIST proposed by the American Association for the Study of Liver Diseases uses the single longest axial diameter of the necrotic area to assess response to locoregional therapy, but it has not yet been widely validated; however, a new report suggests that modified RECIST may be superior to RECIST1.1 .
Get Radiology Tree app to read full this article<
Materials and methods
Get Radiology Tree app to read full this article<
Patients
Get Radiology Tree app to read full this article<
Get Radiology Tree app to read full this article<
90 Y Radioembolization
Get Radiology Tree app to read full this article<
Computed Tomography Technique
Get Radiology Tree app to read full this article<
Lesion Selection and Evaluation
Get Radiology Tree app to read full this article<
2D Measurement
Get Radiology Tree app to read full this article<
Get Radiology Tree app to read full this article<
Get Radiology Tree app to read full this article<
Get Radiology Tree app to read full this article<
V=43πr3, V
=
4
3
π
r
3
,
and the area A of a circle of radius r is calculated by:
A=πr2 A
=
π
r
2
Get Radiology Tree app to read full this article<
Get Radiology Tree app to read full this article<
Pv=VnVt=4/3πN34/3πT3=(NT)3 P
v
=
V
n
V
t
=
4
/
3
π
N
3
4
/
3
π
T
3
=
(
N
T
)
3
in which Vn = necrosis volume and Vt = tumor volume.
Get Radiology Tree app to read full this article<
Get Radiology Tree app to read full this article<
Pb=AnAt=πN2πT2=(NT)2 P
b
=
A
n
A
t
=
π
N
2
π
T
2
=
(
N
T
)
2
in which Pb = two-dimensional proportion, An = necrotic area, and At = tumor area.
Get Radiology Tree app to read full this article<
Get Radiology Tree app to read full this article<
NT=Pb−−−√2 N
T
=
P
b
2
and substituting into the first equation we arrive at:
Pv=(NT)3=(Pb−−−√2)3 P
v
=
(
N
T
)
3
=
(
P
b
2
)
3
thus being able to convert 2D necrosis proportions to volumetric-equivalent necrosis proportions.
Get Radiology Tree app to read full this article<
Volumetric Quantification
Get Radiology Tree app to read full this article<
Get Radiology Tree app to read full this article<
Get Radiology Tree app to read full this article<
Statistical Analysis
Get Radiology Tree app to read full this article<
Results
Get Radiology Tree app to read full this article<
Interobserver Reproducibility
Get Radiology Tree app to read full this article<
Get Radiology Tree app to read full this article<
Get Radiology Tree app to read full this article<
Table 1
Parameters Used to Assess Reproducibility for Two Independent Observers Estimating the Proportion of Necrosis within a Tumor by Two Different Methods
Statistics Parameter Measurement Method Two-dimensional Measurements Volumetric Quantification Mean difference ± SD −0.03 ± 0.14 −0.08 ± 0.10 WSCV 43.8% 27.8% ICC 0.8454 0.9138 LCC 0.8407 0.9089
ICC, intraclass correlation coefficient; LCC, Lin’s concordance coefficient; WSCV, within-subject coefficient of variation.
Data pertain to two independent observers.
Get Radiology Tree app to read full this article<
Assessment of Agreement between Methods
Get Radiology Tree app to read full this article<
Get Radiology Tree app to read full this article<
Get Radiology Tree app to read full this article<
Discussion
Get Radiology Tree app to read full this article<
Get Radiology Tree app to read full this article<
Get Radiology Tree app to read full this article<

Get Radiology Tree app to read full this article<
Get Radiology Tree app to read full this article<
Get Radiology Tree app to read full this article<
Get Radiology Tree app to read full this article<
References
1. Bruix J., Sherman M.: Management of hepatocellular carcinoma. Hepatology 2005; 42: pp. 1208-1236.
2. Salem R., Hunter R.D.: Yttrium-90 microspheres for the treatment of hepatocellular carcinoma: a review. Int J Radiat Oncol Biol Phys 2006; 66: pp. S83-S88.
3. Rhee T.K., Naik N.K., Deng J., et. al.: Tumor response after yttrium-90 radioembolization for hepatocellular carcinoma: comparison of diffusion-weighted functional MR imaging with anatomic MR imaging. J Vasc Interv Radiol 2008; 19: pp. 1180-1186.
4. Memon K., Kulik L., Lewandowski R.J., et. al.: Radiographic response to locoregional therapy in hepatocellular carcinoma predicts patient survival times. Gastroenterology 2011; 141: pp. 526-535.
5. Keil S., Behrendt F.F., Stanzel S., et. al.: Semi-automated measurement of hyperdense, hypodense and heterogeneous hepatic metastasis on standard MDCT slices. Comparison of semi-automated and manual measurement of RECIST and WHO criteria. Eur Radiol 2008; 18: pp. 2456-2465.
6. Eisenhauer E.A., Therasse P., Bogaerts J., et. al.: New response evaluation criteria in solid tumours: revised RECIST guideline (version 1.1). Eur J Cancer 2009; 45: pp. 228-247.
7. Nishino M., Jagannathan J.P., Ramaiya N.H., et. al.: Revised RECIST guideline version 1.1: what oncologists want to know and what radiologists need to know. AJR Am J Roentgenol 2010; 195: pp. 281-289.
8. Forner A., Ayuso C., Varela M., et. al.: Evaluation of tumor response after locoregional therapies in hepatocellular carcinoma: are response evaluation criteria in solid tumors reliable?. Cancer 2009; 115: pp. 616-623.
9. Ibrahim S.M., Nikolaidis P., Miller F.H., et. al.: Radiologic findings following Y90 radioembolization for primary liver malignancies. Abdom Imaging 2009; 34: pp. 566-581.
10. Keppke A.L., Salem R., Reddy D., et. al.: Imaging of hepatocellular carcinoma after treatment with yttrium-90 microspheres. AJR Am J Roentgenol 2007; 188: pp. 768-775.
11. Bruix J., Sherman M., Llovet J.M., et. al.: Clinical management of hepatocellular carcinoma. Conclusions of the Barcelona-2000 EASL conference. European Association for the Study of the Liver. J Hepatol 2001; 35: pp. 421-430.
12. Spira D., Fenchel M., Lauer U.M., et. al.: Comparison of different tumor response criteria in patients with hepatocellular carcinoma after systemic therapy with the multikinase inhibitor sorafenib. Acad Radiol 2011; 18: pp. 89-96.
13. Kuhnigk J.M., Dicken V., Bornemann L., et. al.: Morphological segmentation and partial volume analysis for volumetry of solid pulmonary lesions in thoracic CT scans. IEEE Trans Med Imaging 2006; 25: pp. 417-434.
14. Moltz J.H., Bornemann L., Kuhnigk J.M., et. al.: Advanced segmentation techniques for lung nodules, liver metastases, and enlarged lymph nodes in CT scans. IEEE J Sel Top Signal Process 2009; 3: pp. 122-134.
15. Bornemann L., Kuhnigk J.M., Dicken V., et. al.: Informatics in radiology (infoRAD): new tools for computer assistance in thoracic CT part 2. Therapy monitoring of pulmonary metastases. Radiographics 2005; 25: pp. 841-848.
16. Bornemann L., Dicken V., Kuhnigk J.M., et. al.: OncoTREAT: a software assistant for cancer therapy monitoring. Int J CARS 2007; 1: pp. 231-242.
17. Monsky W.L., Garza A.S., Kim I., et. al.: Treatment planning and volumetric response assessment for Yttrium-90 radioembolization: semiautomated determination of liver volume and volume of tumor necrosis in patients with hepatic malignancy. Cardiovasc Intervent Radiol 2011; 34: pp. 306-318.
18. Sato K.T., Lewandowski R.J., Mulcahy M.F., et. al.: Unresectable chemorefractory liver metastases: radioembolization with 90Y microspheres—safety, efficacy, and survival. Radiology 2008; 247: pp. 507-515.
19. Salem R., Thurston K.G.: Radioembolization with 90Yttrium microspheres: a state-of-the-art brachytherapy treatment for primary and secondary liver malignancies. Part 1: technical and methodologic considerations. J Vasc Interv Radiol 2006; 17: pp. 1251-1278.
20. Dawson P.: Multi-slice CT contrast enhancement regimens. Clin Radiol 2004; 59: pp. 1051-1060.
21. Laghi A.: Multidetector CT (64slices) of the liver: examination techniques. Eur Radiol 2007; 17: pp. 675-683.
22. Fleischmann D., Kamaya A.: Optimal vascular and parenchymal contrast enhancement: the current state of the art. Radiol Clin North Am 2009; 47: pp. 13-26.
23. Miller F.H., Butler R.S., Hoff F.L., et. al.: Using triphasic helical CT to detect focal hepatic lesions in patients with neoplasms. AJR Am J Roentgenol 1998; 171: pp. 643-649.
24. Lencioni R., Llovet J.M.: Modified RECIST (mRECIST) assessment for hepatocellular carcinoma. Semin Liver Dis 2010; 30: pp. 52-60.
25. Miller A.B., Hoogstraten B., Staquet M., et. al.: Reporting results of cancer treatment. Cancer 1981; 47: pp. 207-214.
26. Suzuki C., Jacobsson H., Hatschek T., et. al.: Radiologic measurements of tumor response to treatment: practical approaches and limitations. Radiographics 2008; 28: pp. 329-344.
27. Bosniak M.A.: The current radiological approach to renal cysts. Radiology 1986; 158: pp. 1-10.
28. Miller F.H., Keppke A.L., Reddy D., et. al.: Response of liver metastases after treatment with yttrium-90 microspheres: role of size, necrosis, and PET. AJR Am J Roentgenol 2007; 188: pp. 776-783.
29. Lin L.I.: A concordance correlation coefficient to evaluate reproducibility. Biometrics 1989; 45: pp. 255-268.
30. Mantatzis M., Kakolyris S., Amarantidis K., et. al.: Treatment response classification of liver metastatic disease evaluated on imaging. Are RECIST unidimensional measurements accurate?. Eur Radiol 2009; 19: pp. 1809-1816.
31. Therasse P., Arbuck S.G., Eisenhauer E.A., et. al.: New guidelines to evaluate the response to treatment in solid tumors. European Organization for Research and Treatment of Cancer, National Cancer Institute of the United States, National Cancer Institute of Canada. J Natl Cancer Inst 2000; 92: pp. 205-216.
32. Tochetto S.M., Rezai P., Rezvani M., et. al.: Does multidetector CT attenuation change in colon cancer liver metastases treated with 90Y help predict metabolic activity at FDG PET?. Radiology 2010; 255: pp. 164-172.
33. Yaghmai V., Miller F.H., Rezai P., et. al.: Response to treatment series: part 2, tumor response assessment—using new and conventional criteria. AJR Am J Roentgenol 2011; 197: pp. 18-27.
34. Gillmore R., Stuart S., Kirkwood A., et. al.: EASL and mRECIST responses are independent prognostic factors for survival in hepatocellular cancer patients treated with transarterial embolisation. J Hepatol 2011; April 15. [Epub ahead of print]
35. Duke E., Deng J., Ibrahim S.M., et. al.: Agreement between competing imaging measures of response of hepatocellular carcinoma to yttrium-90 radioembolization. J Vasc Interv Radiol 2010; 21: pp. 515-521.
36. Llovet J.M., Di Bisceglie A.M., Bruix J., et. al.: Design and endpoints of clinical trials in hepatocellular carcinoma. J Natl Cancer Inst 2008; 100: pp. 698-711.
37. Riaz A., Memon K., Miller F.H., et. al.: Role of the EASL, RECIST, and WHO response guidelines alone or in combination for hepatocellular carcinoma: radiologic-pathologic correlation. J Hepatol 2011; 54: pp. 695-704.
38. Jaffe C.C.: Measures of response: RECIST, WHO, and new alternatives. J Clin Oncol 2006; 24: pp. 3245-3251.
39. Lu D.S., Yu N.C., Raman S.S., et. al.: Radiofrequency ablation of hepatocellular carcinoma: treatment success as defined by histologic examination of the explanted liver. Radiology 2005; 234: pp. 954-960.
40. Herber S., Biesterfeld S., Franz U., et. al.: Correlation of multislice CT and histomorphology in HCC following TACE: predictors of outcome. Cardiovasc Intervent Radiol 2008; 31: pp. 768-777.
41. Riaz A., Miller F.H., Kulik L.M., et. al.: Imaging response in the primary index lesion and clinical outcomes following transarterial locoregional therapy for hepatocellular carcinoma. JAMA 2010; 303: pp. 1062-1069.