
Rationale and Objectives
To assess the validity and reliability of measuring mean aortic wall thickness (MAWT) of the ascending and descending aorta using cine steady-state free precession (SSFP) imaging compared to dark blood (DB) imaging.
Materials and Methods
DB and SSFP images of the thoracic aorta acquired at 1.5 T in 50 volunteers (26 women, 24 men; mean age: 50.2 ± 13.1 years) were used. MAWT was calculated on DB and SSFP images for the ascending and descending aorta at the level of the right pulmonary artery by two independent observers. Validity was assessed using Bland-Altman analysis, Passing-Bablok regression, and Spearman correlation. Reliability was assessed using Bland-Altman analysis and intraclass coefficients (ICCs).
Results
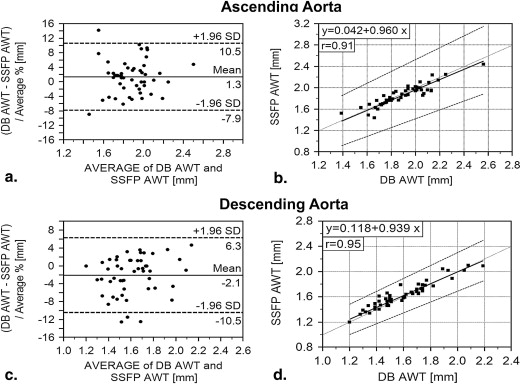
The mean MAWT of the ascending aorta on DB and SSFP images was 1.89 ± 0.21 mm and 1.87 ± 0.20 mm. The measurements for the descending aorta were 1.60 ± 0.22 and 1.63 ± 0.20 mm, respectively. Comparison of DB and SSFP measurements revealed a mean bias of 1.3% (95% limits of agreement (LOA): −7.9, 10.5%) for the ascending and of −2.1% (LOA: −10.5, 6.3%) for the descending aorta. The corresponding regression equation was y = 0.042 + 0.960 × ( r = 0.91; P < .0001) and y = 0.118 + 0.939 × ( r = 0.95; P < .0001), respectively. Intra- and interobserver variability showed a mean bias of less than 2.0% and LOA of less than ±15.0%. ICCs were greater than or equal to 0.85.
Conclusions
MAWT determination in the ascending and descending aorta using cine SSFP sequences is highly valid and reliable compared to DB imaging.
Determination of arterial wall thickness in different vascular territories has shown to be suitable for predicting patients’ risk for cardiovascular events . Arterial wall thickness depends on numerous physiologic and pathologic factors such as age, sex, blood pressure, smoking status, and on several metabolic markers . In recent years, magnetic resonance imaging (MRI) has become widely used for assessing arterial wall thickness. Wall thickness measurement is of particular interest not only in the carotid, coronary, and femoral arteries but also in the thoracic and abdominal aorta . Reference values are not available, and the effects of influencing factors are not yet fully understood.
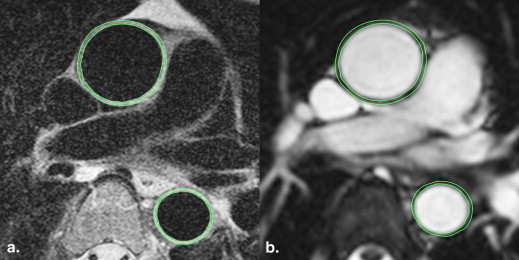
The most widely used MR tool for imaging the aortic wall is the dark blood (DB) or black blood technique. DB imaging improves the visualization of the aortic wall by suppressing signal from intraluminal blood . However, cine steady-state free precession (SSFP) sequences are currently the basis for functional cardiac MRI and also enable visualization of the aortic wall. In routine cardiac examinations, cine SSFP sequences usually cover the thoracic aorta. Hence, they are potential candidates for measuring mean aortic wall thickness (MAWT) without extending examination time unduly but have not been validated for this purpose.
Get Radiology Tree app to read full this article<
Materials and methods
Study Population
Get Radiology Tree app to read full this article<
Get Radiology Tree app to read full this article<
Get Radiology Tree app to read full this article<
Imaging Protocol
Get Radiology Tree app to read full this article<
Table 1
Imaging Parameters of the Two Pulse Sequences Used
Sequence Parameter DB Sequence Cine SSFP Sequence Field of view (mm) 340 × 276 360 × 293 Pixel size 416 × 512 208 × 256 Slice thickness (mm) 4 6 TR/TE (ms) 2 R-R intervals/40.0 56.2/1.18 Flip angle (°) 180 68 Echo train length 23 1 Receiver bandwidth (kHz) 62.5 62.5 Turbo spin echo factor 14 - Scan time (m:s) 4:00 1:17 ECG synchronization Prospective Retrospective
ECG, electrocardiogram; SSFP, steady-state free precession; TE, echo time; TR, repetition time.
Get Radiology Tree app to read full this article<
Image Analysis and MAWT Measurement
Get Radiology Tree app to read full this article<
Get Radiology Tree app to read full this article<
Get Radiology Tree app to read full this article<
Get Radiology Tree app to read full this article<
Get Radiology Tree app to read full this article<
Get Radiology Tree app to read full this article<
Get Radiology Tree app to read full this article<
Get Radiology Tree app to read full this article<
Statistical Analysis
Get Radiology Tree app to read full this article<
Get Radiology Tree app to read full this article<
Get Radiology Tree app to read full this article<
Get Radiology Tree app to read full this article<
Get Radiology Tree app to read full this article<
Get Radiology Tree app to read full this article<
Get Radiology Tree app to read full this article<
Get Radiology Tree app to read full this article<
Get Radiology Tree app to read full this article<
Results
MAWT of Ascending and Descending Aorta
Get Radiology Tree app to read full this article<
Get Radiology Tree app to read full this article<
Get Radiology Tree app to read full this article<
Validity Analysis
Get Radiology Tree app to read full this article<
Get Radiology Tree app to read full this article<
Get Radiology Tree app to read full this article<
Get Radiology Tree app to read full this article<
Reliability Analysis
Intraobserver variability
Get Radiology Tree app to read full this article<
Table 2
Intraobserver Analysis for DB and SSFP Sequence
Observer 1 First vs. Second Session ICC (CI)DB sequenceMean bias; LOA (%) Ascending aorta −1.62; −14.43, 9.19 0.87 (0.78–0.94) Descending aorta −0.35; −7.29, 6.83 0.96 (0.93–0.98)SSFP sequence Ascending aorta 0.17; −5.56, 5.94 0.92 (0.91–0.96) Descending aorta −0.82; −8.44, 6.46 0.96 (0.92–0.98)
CI, confidence interval; DB, dark blood; ICC, intraclass correlation coefficient; LOA, limits of agreement; SSFP, steady-state free precession.
Get Radiology Tree app to read full this article<
Interobserver variability
Get Radiology Tree app to read full this article<
Table 3
Interobserver Analysis for DB and SSFP Sequence
Observer 1 vs. Observer 2 ICC (CI)DB sequenceMean bias; LOA (%) Ascending aorta −1.24; −13.43, 12.32 0.85 (0.76–0.90) Descending aorta 0.36; −8.15, 8.87 0.93 (0.90–0.94)SSFP sequence Ascending aorta −0.92; −8.65, 6.70 0.90 (0.85–0.93) Descending aorta −1.84; −11.07, 6.83 0.89 (0.83–0.94)
CI, confidence interval; DB, dark blood; ICC, intraclass correlation coefficient; LOA, limits of agreement; SSFP, steady-state free precession.
Get Radiology Tree app to read full this article<
Discussion
Get Radiology Tree app to read full this article<
Get Radiology Tree app to read full this article<
Get Radiology Tree app to read full this article<
Get Radiology Tree app to read full this article<
Get Radiology Tree app to read full this article<
Conclusion
Get Radiology Tree app to read full this article<
Get Radiology Tree app to read full this article<
References
1. Mani V., Muntner P., Gidding S.S., et. al.: Cardiovascular magnetic resonance parameters of atherosclerotic plaque burden improve discrimination of prior major adverse cardiovascular events. J Cardiovasc Magn Reson 2009; 11: pp. 10.
2. Burke G.L., Evans G.W., Riley W.A., et. al.: Arterial wall thickness is associated with prevalent cardiovascular disease in middle-aged adults. The Atherosclerosis Risk in Communities (ARIC) Study. Stroke 1995; 26: pp. 386-391.
3. Bots M.L., Hoes A.W., Koudstaal P.J., et. al.: Common carotid intima-media thickness and risk of stroke and myocardial infarction: the Rotterdam Study. Circulation 1997; 96: pp. 1432-1437.
4. Rosero E.B., Peshock R.M., Khera A., et. al.: Sex, race, and age distributions of mean aortic wall thickness in a multiethnic population-based sample. J Vasc Surg 2011; 53: pp. 950-957.
5. Zanchetti A., Bond M.G., Hennig M., et. al.: Risk factors associated with alterations in carotid intima-media thickness in hypertension: baseline data from the European Lacidipine Study on Atherosclerosis. J Hypertens 1998; 16: pp. 949-961.
6. Bourque J.M., Schietinger B.J., Kennedy J.L., et. al.: Usefulness of cardiovascular magnetic resonance imaging of the superficial femoral artery for screening patients with diabetes mellitus for atherosclerosis. Am J Cardiol 2012; 110: pp. 50-56.
7. Keenan N.G., Locca D., Varghese A., et. al.: Magnetic resonance of carotid artery ageing in healthy subjects. Atherosclerosis 2009; 205: pp. 168-173.
8. He Y., Zhang Z., Dai Q., et. al.: Accuracy of MRI to identify the coronary artery plaque: a comparative study with intravascular ultrasound. J Magn Reson Imaging 2012; 35: pp. 72-78.
9. Li A.E., Kamel I., Rando F., et. al.: Using MRI to assess aortic wall thickness in the multiethnic study of atherosclerosis: distribution by race, sex, and age. AJR Am J Roentgenol 2004; 182: pp. 593-597.
10. Simonetti O.P., Finn J.P., White R.D., et. al.: “Black blood” T2-weighted inversion-recovery MR imaging of the heart. Radiology 1996; 199: pp. 49-57.
11. Tatli S., Lipton M.J., Davison B.D., et. al.: From the RSNA refresher courses: MR imaging of aortic and peripheral vascular disease. Radiographics 2003; pp. S59-S78. 23 Spec No
12. Rosero E.B., Peshock R.M., Khera A., et. al.: Agreement between methods of measurement of mean aortic wall thickness by MRI. J Magn Reson Imaging 2009; 29: pp. 576-582.
13. Finn J.P., Nael K., Deshpande V., et. al.: Cardiac MR imaging: state of the technology. Radiology 2006; 241: pp. 338-354.
14. Weidinger F., Frick M., Alber H.F., et. al.: Association of wall thickness of the brachial artery measured with high-resolution ultrasound with risk factors and coronary artery disease. Am J Cardiol 2002; 89: pp. 1025-1029.