
Rationale and Objectives
In quantifying medical images, length-based measurements are still obtained manually. Due to possible human error, a measurement protocol is required to guarantee the consistency of measurements. In this work, we review various statistical techniques that can be used in determining measurement consistency. The focus is on detecting a possible measurement bias and determining the robustness of the procedures to outliers.
Materials and Methods
We review correlation analysis, linear regression, Bland-Altman method, paired t -test, and analysis of variance (ANOVA). These techniques were applied to measurements, obtained by two raters, of head and neck structures from magnetic resonance images.
Results
The correlation analysis and the linear regression were shown to be insufficient for detecting measurement inconsistency. They are also very sensitive to outliers. The widely used Bland-Altman method is a visualization technique, so it lacks the numeric quantification. The paired t -test tends to be sensitive to small measurement bias. In contrast, ANOVA performs well even under small measurement bias.
Conclusions
In almost all cases, using only one method is insufficient and it is recommended that several methods be used simultaneously. In general, ANOVA performs the best.
We were motivated in part by the need to establish a reliable measurement protocol of head and neck structures involving both bony and soft tissue structures from magnetic resonance (MR) images collected for the purpose of quantifying the growth pattern of various oral and pharyngeal structures or vocal tract structures ( ). Figure 1 depicts a select set of such measurements obtained manually from MR imaging.
 Open full size image
Figure 1
Mid-sagittal head and neck magnetic resonance images with the six measurements used for measurement consistency comparison: ( a ) Head length (HL); ( b ) lower anterior face height (LFH); ( c ) anterior tongue length (ATL); ( d ) hyoid vertical distance from posterior nasal spine (HVP); ( e ) vocal tract length (VTL); and ( f ) soft palate length (SP). See text for the definition of variables and tissue type and measurement type of each variable.
Get Radiology Tree app to read full this article<
Get Radiology Tree app to read full this article<
Get Radiology Tree app to read full this article<
Get Radiology Tree app to read full this article<
Get Radiology Tree app to read full this article<
Materials and methods
Description of Head and Neck Imaging Data
Get Radiology Tree app to read full this article<
Get Radiology Tree app to read full this article<
Get Radiology Tree app to read full this article<
Get Radiology Tree app to read full this article<
ARE=1n∑ni=1∣RDi−CCi∣∣RDi+CCi∣/2, A
R
E
=
1
n
∑
i
=
1
n
❘
R
D
i
−
C
C
i
❘
❘
R
D
i
+
C
C
i
❘
/
2
,
where RDi R
D
i and CCi C
C
i are the i th measurement of RD and CC, respectively, and n=30 n
=
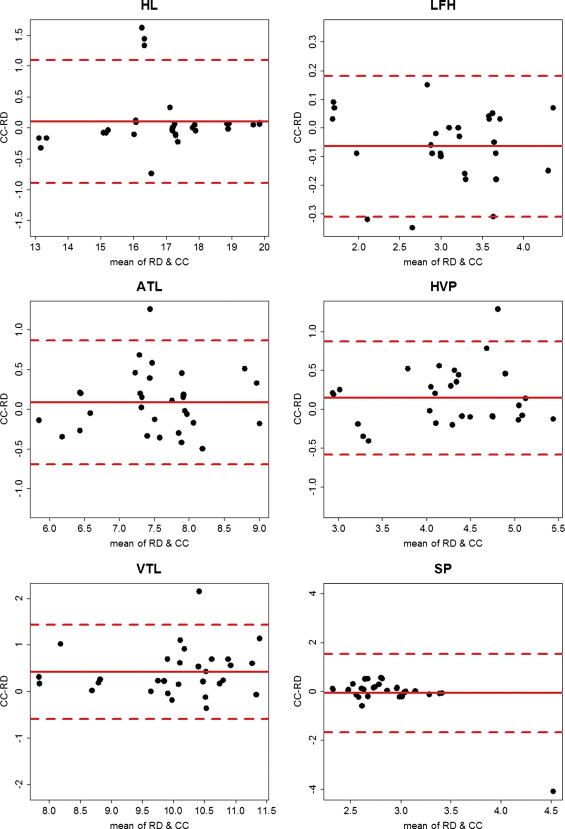
30 , the number of measurements obtained by each rater. The average relative errors for HL, LFH, ATL, HVP, VTL, and SP are 0.016, 0.036, 0.041, 0.070, 0.046, and 0.1, respectively. The fairly large ARE of SP is caused by an outlier ( Fig 2 ).
Get Radiology Tree app to read full this article<
Get Radiology Tree app to read full this article<
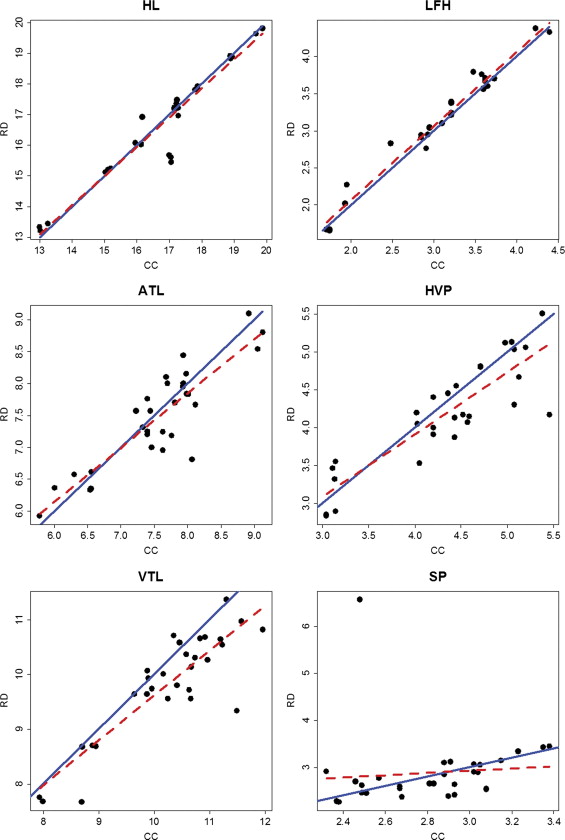
Correlation Analysis and Linear Regression
Get Radiology Tree app to read full this article<
T=rn−2√1−r2√. T
=
r
n
−
2
1
−
r
2
.
Get Radiology Tree app to read full this article<
Get Radiology Tree app to read full this article<
Get Radiology Tree app to read full this article<
RDi=β0+β1×CCi+εi. R
D
i
=
β
0
+
β
1
×
C
C
i
+
ε
i
.
Get Radiology Tree app to read full this article<
Get Radiology Tree app to read full this article<
Bland-Altman Method and Paired t - Test
Get Radiology Tree app to read full this article<
Get Radiology Tree app to read full this article<
Get Radiology Tree app to read full this article<
T=d¯S2d/n√, T
=
d
¯
S
d
2
/
n
,
which is distributed as the t -distribution with n−1 n
−
1 degrees of freedom.
Get Radiology Tree app to read full this article<
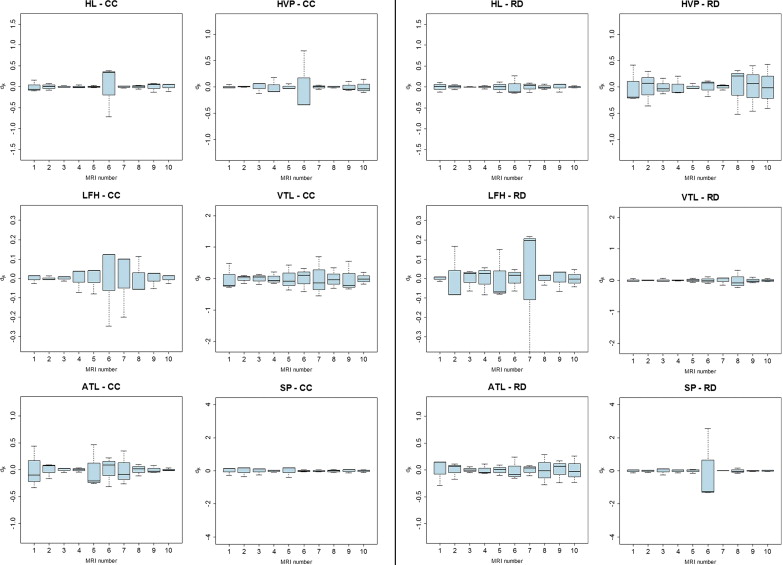
ANOVA and Within-Rater Consistency
Get Radiology Tree app to read full this article<
Get Radiology Tree app to read full this article<
Xijk=μ+αi+βj+αβij+εijk. X
i
j
k
=
μ
+
α
i
+
β
j
+
α
β
i
j
+
ε
i
j
k
.
Get Radiology Tree app to read full this article<
Get Radiology Tree app to read full this article<
Get Radiology Tree app to read full this article<
Get Radiology Tree app to read full this article<
Get Radiology Tree app to read full this article<
Results
Correlation Analysis and Linear Regression
Get Radiology Tree app to read full this article<
Get Radiology Tree app to read full this article<
Get Radiology Tree app to read full this article<
Bland-Altman Method and Paired t - Test
Get Radiology Tree app to read full this article<
Get Radiology Tree app to read full this article<
Get Radiology Tree app to read full this article<
ANOVA and Within-Rater Consistency
Get Radiology Tree app to read full this article<
Get Radiology Tree app to read full this article<
Discussion
Get Radiology Tree app to read full this article<
Table 1
Summary of Statistical Method Used in Determining the Measurement Consistency
Method Strength Weakness Agreement Disagreement Correlation and regression
VTL, SP
Visualization technique
The method does not provide a decision. Paired t -test
Fails under systematic bias
LFH, HVP ANOVA
Complicated procedure
ANOVA: analysis of variance.
The last two columns show whether the method agrees with the ANOVA result for the six variables: head length (HL), lower anterior face height (LFH), anterior tongue length (ATL), hyoid vertical distance from posterior nasal spine (HVP), vocal tract length (VTL), and soft palate length (SP).
Get Radiology Tree app to read full this article<
Get Radiology Tree app to read full this article<
Get Radiology Tree app to read full this article<
Get Radiology Tree app to read full this article<
Get Radiology Tree app to read full this article<
Acknowledgments
Get Radiology Tree app to read full this article<
Get Radiology Tree app to read full this article<
References
1. Vorperian H.K., Kent R.D., Lindstrom M.J., Kalina C.M., Gentry L.R., Yandell B.S.: Development of vocal tract length during early childhood: A magnetic resonance imaging study. J Acoust Soc Am 2005; 117: pp. 338-350.
2. Vorperian H.K., Durtschi R.B., Wang S., Chung M.K., Ziegert A.J., Gentry L.R.: Estimating head circumference from pediatric imaging studies: An improved method. Acad Radiol 2007; 14: pp. 1102-1107.
3. Krummenauer F., Doll G.: Statistical methods for the comparison of measurements derived from orthodontic imaging. Eur J Orthod 2000; 22: pp. 257-269.
4. Bland J.M., Altman D.G.: Statistical methods for assessing agreement between two methods of clinical measurement. Lancet 1986; 1: pp. 307-310.
5. Edvardsen T., Gerber B.L., Garot J., Bluemke D.A., Lima J.A.C., Smiseth O.A.: Quantitative assessment of intrinsic regional myocardial deformation by Doppler strain rate echocardiography in humans: Validation against three-dimensional tagged magnetic resonance imaging. Circulation 2002; 106: pp. 50-56.
6. Liu W., Zagzebski J.A., Varghese T., Dyer C.R., Techavipoo U., Hall T.J.: Segmentation of elastographic images using a coarse-to-fine active contour model. Ultrasound Med Biol 2006; 32: pp. 397-408.
7. Powell A.J., Maier S.E., Chung T., Geva T.: Phase-velocity cine magnetic resonance imaging measurement of pulsatile blood flow in children and young adults: In vitro and in vivo validation. Pediatr Cardiol 2000; 21: pp. 104-110.
8. Vallejo E., Dione D.P., Bruni W.L., et. al.: Reproducibility and accuracy of gated SPECT for determination of left ventricular volumes and ejection fraction: Experimental validation using MRI. J Nucl Med 2000; 41: pp. 874-882.
9. Van Oosterhout M.F.M., Willigers H.M.M., Reneman R.S., Prinzen F.W.: Fluorescent microspheres to measure organ perfusion: Validation of a simplified sample processing technique. Am J Physiol 1995; 269: pp. H725-H733.
10. Bland J.M., Altman D.G.: Comparing methods of measurement: Why plotting difference against standard method is misleading. Lancet 1995; 346: pp. 1085-1087.
11. Bland J.M., Altman D.G.: Applying the right statistics: Analyses of measurement studies. Ultrasound Obstet Gynecol 2003; 22: pp. 85-93.
12. Braždžionytë J., Macas A.: Bland-Altman analysis as an alternative approach for statistical evaluation of agreement between two methods for measuring hemodynamics during acute myocardial infarction. Medicina 2007; 43: pp. 208-214.
13. Abate N., Burns D., Peshock R.M., Garg A., Grundy S.M.: Estimation of adipose tissue mass by magnetic resonance imaging: Validation against dissection in human cadavers. J Lipid Res 1994; 35: pp. 1490-1496.
14. Chatterjee S., Hadi A.S., Price B.: Regression analysis by example.3rd ed.2000.John Wiley & Sons, IncNew York
15. Tukey J.W.: Exploratory data analysis.1977.Addison-WesleyNew York
16. Martinez W.L., Martinez A.R.: Exploratory data analysis With MATLAB.2005.Chapman & Hall/CRCLondon