
Rational and Objectives
Pulmonary partial pressure of oxygen ( p O 2 ) and oxygen depletion rate ( R ) are two important parameters of lung function. The dependence of hyperpolarized 3 He (HP 3 He) T 1 on local oxygen concentration provides the basis for high-resolution mapping of the regional distributions of p O 2 and R in the lung. Although the oxygen-sensitive HP 3 He magnetic resonance imaging technique has been applied in human subjects and several animal species, reproducibility studies are rarely reported in the literature. This work presents a preliminary reproducibility study on a pig model. In this study, important scan parameters, such as measurement timing and flip angle, are optimized to minimize the noise-induced measurement uncertainty.
Materials and Methods
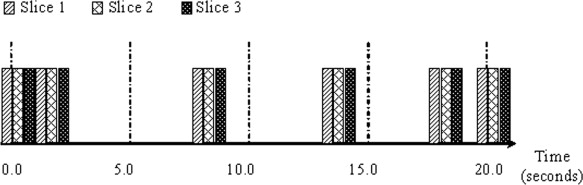
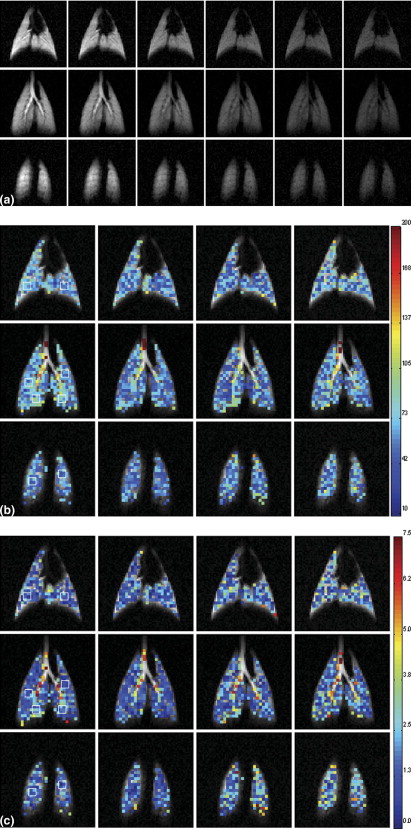
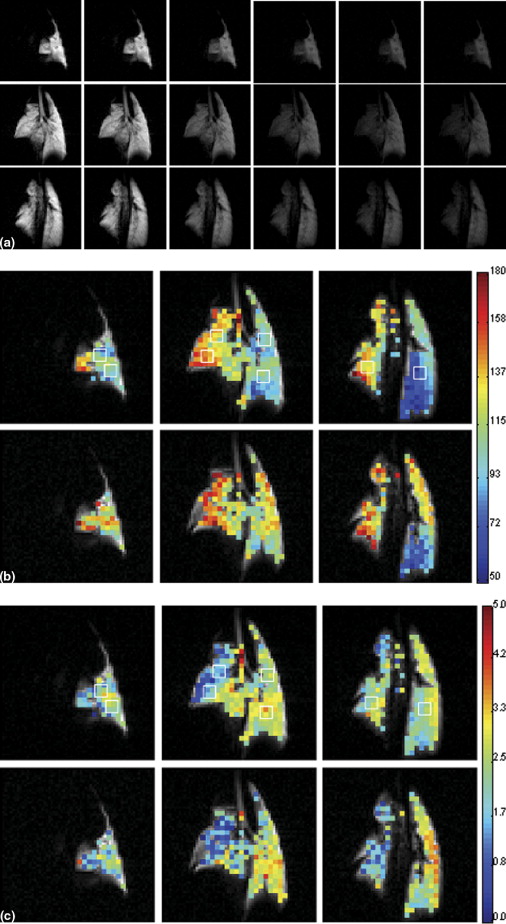
In the in vivo study, five normal pigs and one diseased pig with simulated pulmonary emboli were scanned with a small flip angle gradient echo sequence. The pulmonary oxygen measurement was repeated two to four times in each pig. In each measurement, a series of six images were acquired with optimal timing and flip angle. The parametric maps were generated using a bin-based data processing procedure that applied the multiple regression fitting method to extract the p O 2 and R . Variations of global mean, percentiles, and regions of interest were calculated from the maps to analyze reproducibility.
Results
The global statistical analyses show that average variation of global mean is 10.7% for p O 2 and 23.8% for R , and that the average variation of percentiles (10th, 25th, 50th, 75th, and 90th) and interquartile range is 14.8% for p O 2 and 30.4% for R . The region-of-interest analysis on the manually selected regions shows that the average variation of mean is 12.6% for p O 2 and 21.9% for R .
Conclusion
In this work, a preliminary study on the reproducibility of measuring p O 2 and R with HP 3 He magnetic resonance imaging on a pig model is presented.
Pulmonary partial pressure of oxygen ( p O 2 ) and oxygen depletion rate ( R ) are important parameters of lung function. The measurements of p O 2 and R give quantitative information on the efficiency of gas exchange within the lungs. Chronic obstructive pulmonary disease, pulmonary embolism, and most of the other diseases that affect regional ventilation-perfusion ratios disturb p O 2 and R ( ). Therefore, the accurate measurement of these parameters has the potential to serve as a sensitive marker for the early detection and diagnosis of lung diseases.
Traditionally, p O 2 could only be measured globally from the inspired and mixed expiratory gas, assuming a simple model of lung physiology ( ). In recent years, hyperpolarized 3 He (HP 3 He) magnetic resonance imaging (MRI) has been developed as a promising tool for the regional, sensitive, and noninvasive assessment of pulmonary parameters ( ). The application of this technique to pulmonary oxygen measurement has generated considerable interest because high-resolution mapping of regional p O 2 and R distributions not only enhances detection of lung pathologies, but also provides fundamental insights into the pathophysiologic mechanisms of disease ( ).
Get Radiology Tree app to read full this article<
Get Radiology Tree app to read full this article<
Get Radiology Tree app to read full this article<
Materials and methods
Get Radiology Tree app to read full this article<
Single-acquisition Technique Based on the Multiple Regression Method
Get Radiology Tree app to read full this article<
Sn=S0⋅(cosα)Nn⋅exp[−1ξ∫t(n)0pO2(t)dt], S
n
=
S
0
⋅
(
cos
α
)
N
n
⋅
exp
[
−
1
ξ
∫
0
t
(
n
)
p
O
2
(
t
)
d
t
]
,
where S 0 and S n represent the signal intensities of the initial and n th images, N is the number of phase encoding steps of an image, α is the flip angle, t(n) is the time at which the acquisition of n th image is completed, ξ = 1976.0 Torr/sec represents the 3 He relaxation coefficient at body temperature, and p O 2 ( t ) is the time-dependent oxygen partial pressure. It can be assumed that during the initial period of breathhold when the measurement takes place, p O 2 ( t ) can be approximated as a linear function of time ( ):
pO2(t)=p0−Rt, p
O
2
(
t
)
=
p
0
−
R
t
,
where p 0 is the initial oxygen partial pressure and R is the oxygen depletion rate, the speed at which oxygen diffuses from the alveoli into the blood. Substituting Eq 2 into Eq 1 and normalizing S n with respect to the initial signal S 0 yields:
En=ln(Sn/S0)=ε⋅n−1ξp0⋅t(n)+12ξR⋅t2(n), E
n
=
ln
(
S
n
/
S
0
)
=
ε
⋅
n
−
1
ξ
p
0
⋅
t
(
n
)
+
1
2
ξ
R
⋅
t
2
(
n
)
,
where ε=N1n(cosα). ε
=
N
1
n
(
cos
α
)
. In Eq 3 , the normalized signal intensity, E n , is a linear sum of the three parameters, ε , p 0 , and R , weighted by the associated functions n , t(n) , and t 2 (n) , respectively. Therefore, the multiple regression method can be used to extract the values of ε , p 0 , and R from a single series of acquired images ( ). The analytic uncertainty expression of each parameter in the presence of measurement noise can also be obtained. These expressions provide the basis for comparing the noise performances between different measurement schemes; an optimal scheme that yields minimal measurement uncertainties for p 0 and R can be found from a variety of possible choices.
Get Radiology Tree app to read full this article<
Get Radiology Tree app to read full this article<
Get Radiology Tree app to read full this article<
Get Radiology Tree app to read full this article<
Get Radiology Tree app to read full this article<
Polarized 3 He Production and Administration
Get Radiology Tree app to read full this article<
Animal Model
Get Radiology Tree app to read full this article<
Get Radiology Tree app to read full this article<
Table 1
Global Partial Pressure of Oxygen Values for Repeated Measurements in the Hyperpolarized 3 He Pulmonary Oxygen Reproducibility Study in the Pig Model
Pig # Slice # Measurement # Variation of Mean (%) 1st 2nd 3rd 4th 1 1 127 ± 21 125 ± 19 — — 1.6 2 127 ± 18 125 ± 28 — — 1.6 3 114 ± 18 105 ± 23 — — 8.2 2 1 109 ± 14 105 ± 15 — — 3.7 2 94 ± 16 95 ± 17 — — 1.1 3 85 ± 15 87 ± 13 Expectation maximization Expectation maximization 2.3 3 1 67 ± 16 62 ± 18 59 ± 21 69 ± 23 15.6 2 76 ± 27 64 ± 28 60 ± 24 69 ± 30 23.8 3 59 ± 16 54 ± 13 62 ± 25 62 ± 23 13.5 4 ⁎ 1 182 ± 28 178 ± 26 156 ± 21 — 15.1 5 1 90 ± 11 94 ± 16 114 ± 12 — 24.2 2 89 ± 12 87 ± 14 103 ± 20 — 17.2 3 78 ± 7 81 ± 11 79 ± 14 — 3.8 6 † 1 109 ± 20 127 ± 19 — — 15.3 2 116 ± 22 128 ± 18 — — 9.8 3 100 ± 28 115 ± 30 — — 14.0
Values are listed in mean ± standard deviation (Torr) form. The last column is the variation of the global mean.
Get Radiology Tree app to read full this article<
Get Radiology Tree app to read full this article<
Get Radiology Tree app to read full this article<
Get Radiology Tree app to read full this article<
Imaging
Get Radiology Tree app to read full this article<
Get Radiology Tree app to read full this article<
Data Processing
Get Radiology Tree app to read full this article<
Sn=S¯¯2n−2π−−−−−−√σ¯2, S
n
=
S
¯
n
2
−
2
π
σ
¯
2
,
where S n and Sn− S
n
− respectively denote the signal intensities before and after the correction; and σ¯ σ
¯ is the background noise, calculated as an average from a 5 × 5 region at the right-bottom corner of the image where no signal is contained. The second threshold was the pixel inhomogeneity inside a bin. The inhomogeneity was calculated as the ratio of standard deviation of pixel intensities over the average. A bin with an inhomogeneity greater than 0.4 was discarded for fitting. Such bins usually occurred at the edge of the lung, where only a portion of the pixels contained signal and a large signal variation existed.
Get Radiology Tree app to read full this article<
Reproducibility Analysis
Get Radiology Tree app to read full this article<
Get Radiology Tree app to read full this article<
δ=max−minmean. δ
=
max
−
min
mean
.
Here max, min, and mean, respectively, stand for the maximum, minimum, and mean values of the repeated measurements.
Get Radiology Tree app to read full this article<
Results
Get Radiology Tree app to read full this article<
Get Radiology Tree app to read full this article<
Get Radiology Tree app to read full this article<
Get Radiology Tree app to read full this article<
Get Radiology Tree app to read full this article<
Table 2
Global R Values for Repeated Measurements in the Hyperpolarized 3 He Pulmonary Oxygen Reproducibility Study in the Pig Model
Pig # Slice # Measurement # Variation of Mean (%) 1st 2nd 3rd 4th 1 1 1.50 ± 1.00 2.22 ± 1.16 — — 38.7 2 2.19 ± 1.00 2.68 ± 1.44 — — 20.1 3 2.27 ± 0.98 3.26 ± 1.46 — — 35.8 2 1 1.64 ± 1.13 1.32 ± 0.90 — — 21.6 2 2.58 ± 1.03 2.43 ± 0.99 — — 6.0 3 2.38 ± 0.91 2.51 ± 0.94 — — 5.3 3 1 1.43 ± 0.94 1.45 ± 0.90 1.75 ± 1.19 1.99 ± 1.21 33.8 2 1.84 ± 1.51 1.54 ± 1.25 1.77 ± 1.31 2.07 ± 1.53 29.4 3 1.53 ± 0.93 1.41 ± 0.90 2.24 ± 1.47 2.31 ± 1.31 48.1 4 ⁎ 1 3.77 ± 1.77 1.29 ± 1.00 1.00 ± 0.70 — 137.1 5 1 0.72 ± 0.42 0.49 ± 0.41 0.89 ± 0.45 — 57.1 2 1.56 ± 0.55 1.08 ± 0.53 1.59 ± 0.77 — 36.2 3 1.61 ± 0.39 1.39 ± 0.55 1.39 ± 0.52 — 15.0 6 † 1 2.05 ± 0.70 1.98 ± 0.69 — — 3.5 2 2.41 ± 0.80 2.24 ± 0.93 — — 7.3 3 2.34 ± 0.57 2.34 ± 0.83 — — 0.0
Values are listed in mean ± standard deviation (Torr) form. The last column is the variation of the global mean.
Get Radiology Tree app to read full this article<
Get Radiology Tree app to read full this article<
Get Radiology Tree app to read full this article<
Get Radiology Tree app to read full this article<
Table 3
Statistical Results of the Percentile Analysis on the Reproducibility of Partial Pressure of Oxygen
Pig # Slice # Variation of Percentile of p 0 Interquartile Range 10th 25th 50th 75th 90th 1 1 5.1 4.4 0.9 2.5 2.7 31.8 2 13.6 6.3 2.9 5.1 7.9 52.9 3 15.3 17.1 15.1 4.4 1.8 40.0 2 1 1.9 7.1 5.2 0.5 2.3 28.4 2 0.8 1.4 2.0 0.9 0.5 1.4 3 11.0 4.8 2.9 3.5 0.9 2.6 3 1 41.9 20.9 17.2 15.9 16.3 28.9 2 52.2 30.4 22.8 18.5 19.0 22.9 3 27.8 7.6 15.9 16.3 26.8 42.3 4 ⁎ 1 12.7 13.3 16.0 17.1 17.6 39.8 5 1 27.4 24.9 23.2 22.1 21.4 8.8 2 17.2 15.9 14.1 15.6 21.9 27.5 3 10.0 4.1 3.4 5.6 10.5 54.2 6 † 1 20.3 15.8 13.4 16.3 8.4 18.5 2 15.2 11.5 11.6 6.4 5.5 12.1 3 13.3 16.8 18.0 11.4 9.6 2.7 Average of variations_17.9_12.6__11.5__10.1__10.8__25.9
The variations of five percentiles (10th, 25th, 50th, 75th, and 90th) and interquartile range (25–75%) are calculated.
Get Radiology Tree app to read full this article<
Get Radiology Tree app to read full this article<
Table 4
Statistical Results of the Percentile Analysis on the Reproducibility of R
Pig # Slice # Variation of Percentile of R Interquartile Range 10th 25th 50th 75th 90th 1 1 48.7 33.5 56.2 51.1 30.8 62.4 2 3.3 8.5 14.4 25.8 29.7 42.6 3 27.7 33.0 31.6 43.3 29.9 54.0 2 1 138.4 30.3 9.5 0.3 32.9 16.6 2 19.5 4.4 5.5 0.4 2.6 7.9 3 13.8 12.3 2.8 1.8 2.1 16.3 3 1 83.8 26.6 37.1 34.7 36.6 39.9 2 53.0 34.9 30.2 38.1 24.6 40.0 3 88.9 44.6 57.3 42.6 49.1 48.9 4 ⁎ 1 187.7 160.0 152.6 139.4 121.1 124.5 5 1 127.8 108.1 76.1 50.4 37.8 11.5 2 69.3 47.0 38.0 29.9 39.2 3.8 3 47.6 26.7 16.2 17.8 6.7 6.3 6 † 1 1.9 5.5 10.4 1.3 7.6 5.1 2 32.6 23.6 9.7 0.5 4.7 36.4 3 20.9 10.5 1.5 4.2 11.9 33.1 Average of variations_51.8_30.0__26.4__22.8__23.1__28.3
The variations of five percentiles (10th, 25th, 50th, 75th, and 90th) and interquartile range (25–75%) are calculated. The hyperventilated case is excluded when calculating average of variations.
Get Radiology Tree app to read full this article<
Get Radiology Tree app to read full this article<
Get Radiology Tree app to read full this article<
Get Radiology Tree app to read full this article<
Discussion
Get Radiology Tree app to read full this article<
Get Radiology Tree app to read full this article<
Conclusions
Get Radiology Tree app to read full this article<
Get Radiology Tree app to read full this article<
References
1. Dantzker D.R., Wagner P.D., Tornabene V.W., et. al.: Gas exchange after pulmonary thromboembolization in dogs. Circ Res 1978; 42: pp. 92-103.
2. Dantzker D.R.: Pulmonary embolism.Crystal R.G.West J.B.The lung: scientific foundations.1997.Lippincott-RavenPhiladelphia:pp. 1601-1606.
3. West J.: Respiratory physiology: the essentials.1999.Lippincott Williams & WilkinsBaltimore, MD
4. Bachert P., Schad L.R., Bock M., et. al.: Nuclear magnetic resonance imaging of airways in humans with use of hyperpolarized 3 He. Magnet Reson Med 1996; 36: pp. 192-196.
5. MacFall J.R., Charles H.C., Black R.D., et. al.: Human lung air spaces: potential for MR imaging with hyperpolarized 3 He. Radiology 1996; 200: pp. 553-558.
6. de Lange E.E., Mugler J.P.I., Brookeman J.R., et. al.: Lung air spaces: MR imaging evaluation with hyperpolarized 3 He gas. Radiology 1999; 210: pp. 851-857.
7. Kauczor H.-U., Eberle B., Kreitner K.F., et. al.: Imaging of the lungs using 3 He MRI: preliminary clinical experience in 18 patients with and without lung disease. J Magnet Reson Imaging 1997; 7: pp. 538-543.
8. Guenther D., Eberle B., Hast J., et. al.: 3 He MRI in healthy volunteers: preliminary correlation with smoking history and lung volumes. NMR Biomed 2000; 13: pp. 182-189.
9. Saam B., Yablonskiy D.A., Gierada D.S., et. al.: Rapid imaging of hyperpolarized gas using EPI. Magn Reson Med 1999; 42: pp. 507-514.
10. Deninger A.J., Eberle B., Bermuth J., et. al.: Assessment of a single-acquisition imaging sequence for oxygen-sensitive 3 He-MRI. Magn Reson Med 2002; 47: pp. 105-114.
11. Deninger A.J., Eberle B., Ebert M., et. al.: 3 He-MRI-based measurements of intrapulmonary PO 2 and its time course during apnea in healthy volunteers: first results, reproducibility, and technical limitations. NMR Biomed 2000; 13: pp. 194-201.
12. Deninger A.J., Eberle B., Ebert M., et. al.: Quantification of regional intrapulmonary oxygen partial pressure evolution during apnea by 3 He MRI. J Magn Reson 1999; 141: pp. 207-216.
13. Jalali A., Ishii M., Edvinsson J.M., et. al.: Detection of simulated pulmonary embolism in a porcine model using hyperpolarized 3 He MRI. Magn Reson Med 2004; 51: pp. 291-298.
14. Fischer M.C., Spector Z.Z., Ishii M., et. al.: Single-acquisition sequence for the measurement of oxygen partial pressure by hyperpolarized gas MRI. Magn Reson Med 2004; 52: pp. 766-773.
15. Wild J.M., Fichele S., Woodhouse N., et. al.: 3D volume-localized pO 2 measurement in the human lung with 3 He MRI. Magn Res Med 2005; 53: pp. 1055-1064.
16. Eberle B., Weiler N., Markstaller K., et. al.: Analysis of intrapulmonary O 2 concentration by MR imaging of inhaled hyperpolarized 3 He. J Applied Physiol 1999; 87: pp. 2043-2052.
17. Moller H.E., Hedlund L.W., Chen X.J., et. al.: Measurements of hyperpolarized gas properties in the lung. Magn Reson Med 2001; 45: pp. 421-430.
18. Saam B., Happer W., Middleton H.: Nuclear relaxation of 3 He in the presence of O 2 . Phys Rev A 1995; 52: pp. 862-865.
19. Schearer L.D., Walters G.K.: Nuclear spin-lattice relaxation in the presence of magnetic field gradients. Phys Rev 1965; 139: pp. 1398-1402.
20. Cates G.D., Schaefer S.R., Happer W.: Relaxation of spins due to field inhomogeneities in gaseous samples at low magnetic fields and low pressures. Phys Rev A 1988; 37: pp. 2877-2885.
21. Fischer M.C., Kadlecek S., Yu J., et. al.: Measurements of regional alveolar oxygen pressure using hyperpolarized 3 He MRI. Acad Radiol 2005; 12: pp. 1430-1439.
22. Katarzyna Cieslar V.S., Canet-Soulas E., Gaillard S., et. al.: Alveolar oxygen partial pressure and oxygen depletion rate mapping in rats using 3He ventilation imaging. Magn Reson Med 2007; 57: pp. 423-430.
23. Jiangsheng Y.M.I., Law M., Woodburn J.M., et. al.: Optimization of scan parameters in pulmonary partial pressure oxygen measurement by hyperpolarized 3He MRI. Magn Reson Med 2008; 59: pp. 124-131.
24. Morbach A., Gast K., Schmiedeskamp J., et. al.: Diffusion-weighted MRI of the lung with hyperpolarized helium-3: a study of reproducibility. J Magn Reson Imaging 2005; 21: pp. 765-774.
25. Bevington P.Robinson D.K.Data reduction and error analysis for the physical sciences 3rd.2002.McGraw-Hill Higher EducationBoston:pp. 40-41. 102–104
26. Ben-Amar Baranga A., Appelt S., Romalis M.V., et. al.: Polarization of 3 He by spin exchange with optically pumped Rb and K vapors. Phys Rev Lett 1998; 80: pp. 2801-2804.
27. Bouchiat M.A., Carver T.R., Varnum C.M.: Nuclear polarization in 3 He gas induced by optical pumping and dipolar exchange. Phys Rev Lett 1960; 5: pp. 373-375.
28. Walker T.G., Happer W.: Spin-exchange optical pumping of noble-gas nuclei. Rev Mod Phys 1997; 69: pp. 629-642.
29. Henkelman R.M.: Measurement of signal intensities in the presence of noise in MR images. Med Phys 1985; 12: pp. 232-233.
30. Gudbjartsson H., Patz S.: The Rician distribution of noisy MRI data. Magn Reson Med 1995; 34: pp. 910-914.