
Rationale and Objectives
The purpose of the study was to investigate interobserver and intersequence variability in the measurement of hepatic metastasis on magnetic resonance imaging (MRI).
Materials and Methods
This retrospective study was conducted with an institutional review board-approved waiver of informed consent and was in compliance with the Health Insurance Portability and Accountability Act. We searched medical records at our institution for patients with histologically proven metastases to the liver who had undergone MRI from January 2008 to June 2010. We identified 20 patients with 30 measurable liver lesions.
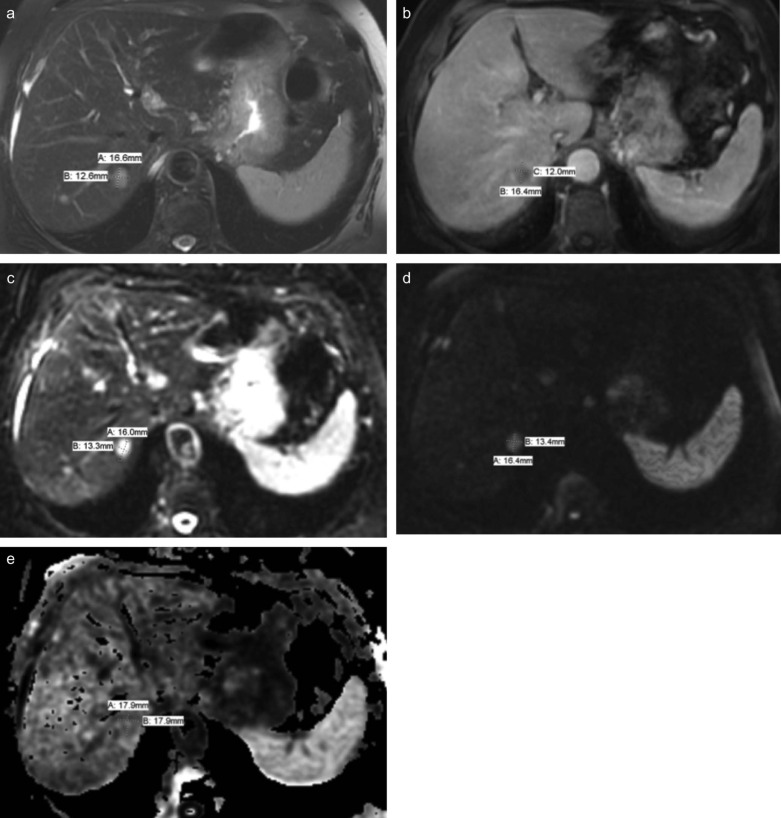
The liver lesions were measured on five different MRI sequences. A presenter radiologist selected and localized all metastatic lesions considered to be measurable according to the Response Evaluation Criteria in Solid Tumors, and these lesions were measured (Eisenhauer et al., 2009) by three radiologists independently.
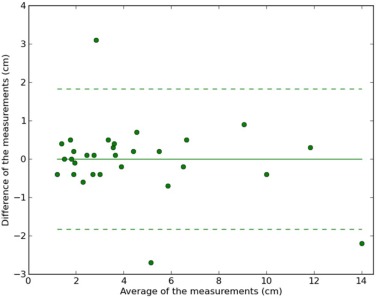
We calculated lesion-wise intraclass correlation coefficients (ICCs) to estimate interobserver and intersequence agreement in lesion diameter measurement. A Bland-Altman plot was used to estimate the limits of agreement between radiologists and MRI sequences.
Results
There were 30 metastases, and almost all of which had regular and well-defined margins. Interobserver ICCs were greater than 0.95 for different MRI sequences except for the measurements in apparent diffusion coefficient images. Intersequence ICCs were greater than 0.92. Bland-Altman plots between physicians confirmed that reader measurements were closely tied together, with small differences in means.
Conclusions
MRI can reproducibly measure hepatic metastatic lesions without significant variability among interpreting radiologists or among MRI sequences, and is thus a reliable method for assessing the size of hepatic metastasis.
Introduction
Get Radiology Tree app to read full this article<
Get Radiology Tree app to read full this article<
Materials and Methods
Patient Population
Get Radiology Tree app to read full this article<
MRI Acquisition
Get Radiology Tree app to read full this article<
Image Analysis
Get Radiology Tree app to read full this article<
Get Radiology Tree app to read full this article<
Get Radiology Tree app to read full this article<
Statistical Analyses
Get Radiology Tree app to read full this article<
Results
Get Radiology Tree app to read full this article<
Table 1
Mean and Standard Deviation (cm) of Metastasis Size Measurements Given by Different Observers for Each MRI Sequence ( N = 30)
Axis Radiologist MRI Sequence T2-FS T1 + C(PV) B0 B800 ADC Average Long A 4.3 (3.2) 4.3 (3.3) 4.4 (3.0) 4.3 (3.1) 4.8 (3.1) 4.4 (3.1) B 4.2 (3.2) 3.9 (3.3) 4.4 (3.3) 4.2 (3.2) 4.1 (3.0)
4.434 4.1 (3.1) C 4.7 (3.5) 4.9 (3.5) 4.8 (3.4) 4.7 (3.4) 4.7 (3.1) 4.8 (3.3) Average 4.4 (3.2) 4.4 (3.3) 4.5 (3.2) 4.4 (3.2) 4.5 (3.0) 4.4 (3.2) Short A 3.3 (2.3) 3.3 (2.5) 3.4 (2.5) 3.4 (2.4) 3.8 (2.5) 3.4 (2.4) B 3.3 (2.3) 3.0 (2.4) 3.4 (2.3) 3.3 (2.5) 3.3 (2.3) 3.3 (2.3) C 3.7 (2.5) 3.8 (2.6) 3.7 (2.6) 3.8 (2.6) 3.7 (2.6) 3.7 (2.6) Average 3.4 (2.4) 3.4 (2.5) 3.5 (2.4) 3.5 (2.5) 3.6 (2.4) 3.5 (2.4)
ADC, apparent diffusion coefficient; FS, fat-supressed; MRI, magnetic resonance imaging; PV, portal venous.
Get Radiology Tree app to read full this article<
Get Radiology Tree app to read full this article<
Table 2
Intraclass Correlation Coefficients (95% Confidence Interval) in Metastasis Size Measurement Among Three Radiologists for Different MRI Sequences
MRI Sequence Long Diameter Short Diameter T2-FS 0.97 (0.94, 0.99) 0.98 (0.95, 0.99) T1 + C(PV) 0.96 (0.85, 0.99) 0.95 (0.84, 0.98) B0 0.96 (0.93, 0.98) 0.95 (0.91, 0.97) B800 0.98 (0.94, 0.99) 0.98 (0.93, 0.99) ADC 0.90 (0.82, 0.95) 0.91 (0.84, 0.95)
ADC, apparent diffusion coefficient; FS, fat-supressed; MRI, magnetic resonance imaging; PV, portal venous.
Get Radiology Tree app to read full this article<
Get Radiology Tree app to read full this article<
Table 3
Intraclass Correlation Coefficients (95% Confidence Interval) in Metastasis Size Measurement among Five MRI Sequences for Different Radiologists
Radiologist Long Diameter Short Diameter A 0.93 (0.89, 0.96) 0.92 (0.87, 0.96) B 0.96 (0.93, 0.98) 0.96 (0.93, 0.98) C 0.97 (0.96, 0.99) 0.98 (0.97, 0.99)
MRI, magnetic resonance imaging.
Get Radiology Tree app to read full this article<
Get Radiology Tree app to read full this article<
Get Radiology Tree app to read full this article<
Table 4
Mean of Differences and 95% Limit of Agreement of the Comparison in Liver Metastasis Size Between Two Radiologists for Different MRI Sequences
Axis Radiologists T2-FS T1 + C(PV) B0 B800 ADC Long A vs. B 0.09 (−1.38, 1.56) 0.42 (−1.02, 1.86) −0.01 (−1.84, 1.82) 0.12 (−0.82, 1.06) 0.69 (−2.46, 3.85) A vs. C −0.39 (−1.96, 1.18) −0.57 (−1.65, 0.52) −0.45 (−1.83, 0.92) −0.47 (−1.55, 0.61) 0.10 (−2.63, 2.82) B vs. C −0.49 (−1.49, 0.52) −0.98 (−2.39, 0.42) −0.45 (−1.98, 1.08) −0.59 (−1.52, 0.34) −0.60 (−2.12, 0.93) Short A vs. B −0.01 (−0.92, 0.90) 0.31 (−0.67, 1.29) 0.04 (−1.75, 1.83) 0.05 (−0.60, 0.70) 0.48 (−1.75, 2.71) A vs. C −0.35 (−1.15, 0.44) −0.46 (−1.52, 0.61) −0.24 (−1.55, 1.07) −0.38 (−0.99, 0.22) 0.06 (−2.09, 2.21) B vs. C −0.34 (−1.25, 0.56) −0.77 (−2.02, 0.49) −0.28 (−1.61, 1.05) −0.43 (−1.14, 0.28) −0.42 (−1.83, 0.99)
ADC, apparent diffusion coefficient; FS, fat-supressed; MRI, magnetic resonance imaging; PV, portal venous.
Get Radiology Tree app to read full this article<
Discussion
Get Radiology Tree app to read full this article<
Get Radiology Tree app to read full this article<
Get Radiology Tree app to read full this article<
Get Radiology Tree app to read full this article<
Appendix 1
GE Healthcare Unit Protocol
Get Radiology Tree app to read full this article<
Philips Healthcare Unit Protocol
Get Radiology Tree app to read full this article<
Appendix 2
Get Radiology Tree app to read full this article<
A2.1. Get Radiology Tree app to read full this article<
A2.1.1. Get Radiology Tree app to read full this article<
Analysis of Variance Table
Response: Size Df Sum Sq Mean Sq F Value Pr(>F) Factor(rater) 2 3.99 1.993 7.8793 0.0009394 *** Factor(subject) 29 950.11 32.762 129.5549 < 2.2e-16 *** Residuals 58 14.67 0.253
Significance codes: 0 ‘***’ 0.001 ‘**’ 0.01 ‘*’ 0.05 ‘.’ 0.1 ‘ ’ 1.
Get Radiology Tree app to read full this article<
ICC=(MS_Subject−MS_error)/(MS_Subject+(k−1)×MS_error+k×(MS_rater−MS_error)/n) ICC
=
(
MS_Subject
−
MS_error
)
/
(
MS_Subject
+
(
k
−
1
)
×
MS_error
+
k
×
(
MS_rater
−
MS_error
)
/
n
)
Get Radiology Tree app to read full this article<
Get Radiology Tree app to read full this article<
A2.1.2. Get Radiology Tree app to read full this article<
Analysis of Variance Table
Response: Size Df Sum Sq Mean Sq F Value Pr(>F) Factor(rater) 2 2.40 1.1979 11.688 5.431e-05 *** Factor(subject) 29 503.29 17.3547 169.335 < 2.2e-16 *** Residuals 58 5.94 0.1025
Significance codes: 0 ‘***’ 0.001 ‘**’ 0.01 ‘*’ 0.05 ‘.’ 0.1 ‘ ’ 1.
Get Radiology Tree app to read full this article<
ICC=(MS_Subject−MS_error)/(MS_Subject+(k−1)×MS_error+k×(MS_rater−MS_error)/n) ICC
=
(
MS_Subject
−
MS_error
)
/
(
MS_Subject
+
(
k
−
1
)
×
MS_error
+
k
×
(
MS_rater
−
MS_error
)
/
n
)
Get Radiology Tree app to read full this article<
Get Radiology Tree app to read full this article<
A2.1.3. Get Radiology Tree app to read full this article<
Analysis of Variance Table
Response: Size Df Sum Sq Mean Sq F Value Pr(>F) Factor(rater) 2 14.60 7.298 31.068 6.743e-10 *** Factor(subject) 29 991.38 34.186 145.530 < 2.2e-16 *** Residuals 58 13.62 0.235
Significance codes: 0 ‘***’ 0.001 ‘**’ 0.01 ‘*’ 0.05 ‘.’ 0.1 ‘ ’ 1.
Get Radiology Tree app to read full this article<
ICC=(MS_Subject−MS_error)/(MS_Subject+(k−1)×MS_error+k×(MS_rater−MS_error)/n) ICC
=
(
MS_Subject
−
MS_error
)
/
(
MS_Subject
+
(
k
−
1
)
×
MS_error
+
k
×
(
MS_rater
−
MS_error
)
/
n
)
Get Radiology Tree app to read full this article<
Get Radiology Tree app to read full this article<
A2.1.4. Get Radiology Tree app to read full this article<
Analysis of Variance Table
Response: Size Df Sum Sq Mean Sq F Value Pr(>F) Factor(rater) 2 8.93 4.4662 27.07 4.97e-09 *** Factor(subject) 29 552.02 19.0351 115.37 < 2.2e-16 *** Residuals 58 9.57 0.1650
Significance codes: 0 ‘***’ 0.001 ‘**’ 0.01 ‘*’ 0.05 ‘.’ 0.1 ‘ ’ 1.
Get Radiology Tree app to read full this article<
ICC=(MS_Subject−MS_error)/(MS_Subject+(k−1)×MS_error+k×(MS_rater−MS_error)/n) ICC
=
(
MS_Subject
−
MS_error
)
/
(
MS_Subject
+
(
k
−
1
)
×
MS_error
+
k
×
(
MS_rater
−
MS_error
)
/
n
)
Get Radiology Tree app to read full this article<
Get Radiology Tree app to read full this article<
A2.1.5. Get Radiology Tree app to read full this article<
Analysis of Variance Table
Response: Size Df Sum Sq Mean Sq F Value Pr(>F) Factor(rater) 2 4.05 2.025 5.9561 0.00444 ** Factor(subject) 29 925.74 31.922 93.8767 < 2e-16 *** Residuals 58 19.72 0.340
Significance codes: 0 ‘***’ 0.001 ‘**’ 0.01 ‘*’ 0.05 ‘.’ 0.1 ‘ ’ 1.
Get Radiology Tree app to read full this article<
ICC=(MS_Subject−MS_error)/(MS_Subject+(k−1)×MS_error+k×(MS_rater−MS_error)/n) ICC
=
(
MS_Subject
−
MS_error
)
/
(
MS_Subject
+
(
k
−
1
)
×
MS_error
+
k
×
(
MS_rater
−
MS_error
)
/
n
)
Get Radiology Tree app to read full this article<
Get Radiology Tree app to read full this article<
A2.1.6. Get Radiology Tree app to read full this article<
Analysis of Variance Table
Response: Size Df Sum Sq Mean Sq F Value Pr(>F) Factor(rater) 2 1.36 0.6776 2.2575 0.1137 Factor(subject) 29 528.00 18.2068 60.6537 <2e-16 *** Residuals 58 17.41 0.3002
Significance codes: 0 ‘***’ 0.001 ‘**’ 0.01 ‘*’ 0.05 ‘.’ 0.1 ‘ ’ 1.
Get Radiology Tree app to read full this article<
ICC=(MS_Subject−MS_error)/(MS_Subject+(k−1)×MS_error+k×(MS_rater−MS_error)/n) ICC
=
(
MS_Subject
−
MS_error
)
/
(
MS_Subject
+
(
k
−
1
)
×
MS_error
+
k
×
(
MS_rater
−
MS_error
)
/
n
)
Get Radiology Tree app to read full this article<
Get Radiology Tree app to read full this article<
A2.1.7. Get Radiology Tree app to read full this article<
Analysis of Variance Table
Response: Size Df Sum Sq Mean Sq F Value Pr(>F) Factor(rater) 2 5.83 2.913 22.191 6.965e-08 *** Factor(subject) 29 950.02 32.759 249.517 < 2.2e-16 *** Residuals 58 7.61 0.131
Significance codes: 0 ‘***’ 0.001 ‘**’ 0.01 ‘*’ 0.05 ‘.’ 0.1 ‘ ’ 1.
Get Radiology Tree app to read full this article<
ICC=(MS_Subject−MS_error)/(MS_Subject+(k−1)×MS_error+k×(MS_rater−MS_error)/n) ICC
=
(
MS_Subject
−
MS_error
)
/
(
MS_Subject
+
(
k
−
1
)
×
MS_error
+
k
×
(
MS_rater
−
MS_error
)
/
n
)
Get Radiology Tree app to read full this article<
Get Radiology Tree app to read full this article<
A2.1.8. Get Radiology Tree app to read full this article<
Analysis of Variance Table
Response: Size Df Sum Sq Mean Sq F Value Pr(>F) Factor(rater) 2 3.35 1.6755 28.908 1.95e-09 *** Factor(subject) 29 557.80 19.2346 331.856 < 2.2e-16 *** Residuals 58 3.36 0.0580
Significance codes: 0 ‘***’ 0.001 ‘**’ 0.01 ‘*’ 0.05 ‘.’ 0.1 ‘ ’ 1.
Get Radiology Tree app to read full this article<
ICC=(MS_Subject−MS_error)/(MS_Subject+(k−1)×MS_error+k×(MS_rater−MS_error)/n) ICC
=
(
MS_Subject
−
MS_error
)
/
(
MS_Subject
+
(
k
−
1
)
×
MS_error
+
k
×
(
MS_rater
−
MS_error
)
/
n
)
Get Radiology Tree app to read full this article<
Get Radiology Tree app to read full this article<
A2.1.9. Get Radiology Tree app to read full this article<
Analysis of Variance Table
Response: Size Df Sum Sq Mean Sq F Value Pr(>F) Factor(rater) 2 8.47 4.2370 4.791 0.01187 * Factor(subject) 29 787.68 27.1615 30.713 < 2e-16 *** Residuals 58 51.29 0.8844
Significance codes: 0 ‘***’ 0.001 ‘**’ 0.01 ‘*’ 0.05 ‘.’ 0.1 ‘ ’ 1.
Get Radiology Tree app to read full this article<
ICC=(MS_Subject−MS_error)/(MS_Subject+(k−1)×MS_error+k×(MS_rater−MS_error)/n) ICC
=
(
MS_Subject
−
MS_error
)
/
(
MS_Subject
+
(
k
−
1
)
×
MS_error
+
k
×
(
MS_rater
−
MS_error
)
/
n
)
Get Radiology Tree app to read full this article<
Get Radiology Tree app to read full this article<
A2.1.10. Get Radiology Tree app to read full this article<
Analysis of Variance Table
Response: Size Df Sum Sq Mean Sq F Value Pr(>F) Factor(rater) 2 4.12 2.0580 3.9618 0.02439 * Factor(subject) 29 503.37 17.3577 33.4148 < 2e-16 *** Residuals 58 30.13 0.5195
Significance codes: 0 ‘***’ 0.001 ‘**’ 0.01 ‘*’ 0.05 ‘.’ 0.1 ‘ ’ 1.
Get Radiology Tree app to read full this article<
ICC=(MS_Subject−MS_error)/(MS_Subject+(k−1)×MS_error+k×(MS_rater−MS_error)/n) ICC
=
(
MS_Subject
−
MS_error
)
/
(
MS_Subject
+
(
k
−
1
)
×
MS_error
+
k
×
(
MS_rater
−
MS_error
)
/
n
)
Get Radiology Tree app to read full this article<
Get Radiology Tree app to read full this article<
Get Radiology Tree app to read full this article<
A2.2. Get Radiology Tree app to read full this article<
A2.2.1. Get Radiology Tree app to read full this article<
Analysis of Variance Table
Response: Size Df Sum Sq Mean Sq F Value Pr(>F) Factor(rater) 4 4.82 1.206 1.8147 0.1307 Factor(subject) 29 1403.32 48.390 72.8200 <2e-16 *** Residuals 116 77.08 0.665
Significance codes: 0 ‘***’ 0.001 ‘**’ 0.01 ‘*’ 0.05 ‘.’ 0.1 ‘ ’ 1.
Get Radiology Tree app to read full this article<
ICC=(MS_Subject−MS_error)/(MS_Subject+(k−1)×MS_error+k×(MS_rater−MS_error)/n) ICC
=
(
MS_Subject
−
MS_error
)
/
(
MS_Subject
+
(
k
−
1
)
×
MS_error
+
k
×
(
MS_rater
−
MS_error
)
/
n
)
Get Radiology Tree app to read full this article<
Get Radiology Tree app to read full this article<
A2.2.2. Get Radiology Tree app to read full this article<
Analysis of Variance Table
Response: Size Df Sum Sq Mean Sq F Value Pr(>F) Factor(rater) 4 4.37 1.0918 2.3362 0.05951 . Factor(subject) 29 831.43 28.6699 61.3499 < 2e-16 *** Residuals 116 54.21 0.4673
Significance codes: 0 ‘***’ 0.001 ‘**’ 0.01 ‘*’ 0.05 ‘.’ 0.1 ‘ ’ 1.
Get Radiology Tree app to read full this article<
ICC=(MS_Subject−MS_error)/(MS_Subject+(k−1)×MS_error+k×(MS_rater−MS_error)/n) ICC
=
(
MS_Subject
−
MS_error
)
/
(
MS_Subject
+
(
k
−
1
)
×
MS_error
+
k
×
(
MS_rater
−
MS_error
)
/
n
)
Get Radiology Tree app to read full this article<
Get Radiology Tree app to read full this article<
A2.2.3. Get Radiology Tree app to read full this article<
Analysis of Variance Table
Response: Size Df Sum Sq Mean Sq F Value Pr(>F) Factor(rater) 4 3.71 0.928 2.2395 0.06898 Factor(subject) 29 1473.81 50.821 122.7006 < 2e-16 *** Residuals 116 48.05 0.414
Significance codes: 0 ‘***’ 0.001 ‘**’ 0.01 ‘*’ 0.05 ‘.’ 0.1 ‘ ’ 1.
Get Radiology Tree app to read full this article<
ICC=(MS_Subject−MS_error)/(MS_Subject+(k−1)×MS_error+k×(MS_rater−MS_error)/n) ICC
=
(
MS_Subject
−
MS_error
)
/
(
MS_Subject
+
(
k
−
1
)
×
MS_error
+
k
×
(
MS_rater
−
MS_error
)
/
n
)
Get Radiology Tree app to read full this article<
Get Radiology Tree app to read full this article<
A2.2.4. Get Radiology Tree app to read full this article<
Analysis of Variance Table
Response: Size Df Sum Sq Mean Sq F Value Pr(>F) Factor(rater) 4 2.37 0.5921 2.6076 0.03922 * Factor(subject) 29 807.64 27.8496 122.6501 < 2e-16 *** Residuals 116 26.34 0.2271
Significance codes: 0 ‘***’ 0.001 ‘**’ 0.01 ‘*’ 0.05 ‘.’ 0.1 ‘ ’ 1.
Get Radiology Tree app to read full this article<
ICC=(MS_Subject−MS_error)/(MS_Subject+(k−1)×MS_error+k×(MS_rater−MS_error)/n) ICC
=
(
MS_Subject
−
MS_error
)
/
(
MS_Subject
+
(
k
−
1
)
×
MS_error
+
k
×
(
MS_rater
−
MS_error
)
/
n
)
Get Radiology Tree app to read full this article<
Get Radiology Tree app to read full this article<
A2.2.5. Get Radiology Tree app to read full this article<
Analysis of Variance Table
Response: Size Df Sum Sq Mean Sq F Value Pr(>F) Factor(rater) 4 0.99 0.249 0.8201 0.5149 Factor(subject) 29 1674.42 57.739 190.4497 <2e-16 *** Residuals 116 35.17 0.303
Significance codes: 0 ‘***’ 0.001 ‘**’ 0.01 ‘*’ 0.05 ‘.’ 0.1 ‘ ’ 1.
Get Radiology Tree app to read full this article<
ICC=(MS_Subject−MS_error)/(MS_Subject+(k−1)×MS_error+k×(MS_rater−MS_error)/n) ICC
=
(
MS_Subject
−
MS_error
)
/
(
MS_Subject
+
(
k
−
1
)
×
MS_error
+
k
×
(
MS_rater
−
MS_error
)
/
n
)
Get Radiology Tree app to read full this article<
Get Radiology Tree app to read full this article<
A2.2.6. Get Radiology Tree app to read full this article<
Analysis of Variance Table
Response: Size Df Sum Sq Mean Sq F Value Pr(>F) Factor(rater) 4 0.44 0.110 0.8086 0.5221 Factor(subject) 29 975.47 33.637 246.9021 <2e-16 *** Residuals 116 15.80 0.136
Significance codes: 0 ‘***’ 0.001 ‘**’ 0.01 ‘*’ 0.05 ‘.’ 0.1 ‘ ’ 1.
Get Radiology Tree app to read full this article<
ICC=(MS_Subject−MS_error)/(MS_Subject+(k−1)×MS_error+k×(MS_rater−MS_error)/n) ICC
=
(
MS_Subject
−
MS_error
)
/
(
MS_Subject
+
(
k
−
1
)
×
MS_error
+
k
×
(
MS_rater
−
MS_error
)
/
n
)
Get Radiology Tree app to read full this article<
Get Radiology Tree app to read full this article<
Get Radiology Tree app to read full this article<
Get Radiology Tree app to read full this article<
References
1. Botea F., Marconi M., Lutman F., et. al.: Radiological estimation of size in colorectal liver metastases: is it reliable? Comparison with post-resectional measurements. Updates Surg 2010; 62: pp. 21-26.
2. McErlean A., Panicek D.M., Zabor E.C., et. al.: Intra- and interobserver variability in CT measurements in oncology. Radiology 2013; 269: pp. 451-459.
3. Lederle F.A., Wilson S.E., Johnson G.R., et. al.: Variability in measurement of abdominal aortic aneurysms. Abdominal Aortic Aneurysm Detection and Management Veterans Administration Cooperative Study Group. J Vasc Surg 1995; 21: pp. 945-952.
4. Oxnard G.R., Zhao B., Sima C.S., et. al.: Variability of lung tumor measurements on repeat computed tomography scans taken within 15 minutes. J Clin Oncol 2011; 29: pp. 3114-3119.
5. Miller A.B., Hoogstraten B., Staquet M., et. al.: Reporting results of cancer treatment. Cancer 1981; 47: pp. 207-214.
6. Eisenhauer E.A., Therasse P., Bogaerts J., et. al.: New response evaluation criteria in solid tumours: revised RECIST guideline (version 1.1). Eur J Cancer 2009; 45: pp. 228-247.
7. Shrout P.E., Fleiss J.L.: Intraclass correlations: uses in assessing rater reliability. Psychol Bull 1979; 86: pp. 420-428.
8. Bland J.M., Altman D.G.: Statistical methods for assessing agreement between two methods of clinical measurement. Lancet 1986; 1: pp. 307-310.
9. Namasivayam S., Martin D.R., Saini S.: Imaging of liver metastases: MRI. Cancer Imaging 2007; 7: pp. 2-9.
10. Blyth S., Blakeborough A., Peterson M., et. al.: Sensitivity of magnetic resonance imaging in the detection of colorectal liver metastases. Ann R Coll Surg Engl 2008; 90: pp. 25-28.
11. Semelka R.C., Cance W.G., Marcos H.B., et. al.: Liver metastases: comparison of current MR techniques and spiral CT during arterial portography for detection in 20 surgically staged cases. Radiology 1999; 213: pp. 86-91.
12. Seneterre E., Taourel P., Bouvier Y., et. al.: Detection of hepatic metastases: ferumoxides-enhanced MR imaging versus unenhanced MR imaging and CT during arterial portography. Radiology 1996; 200: pp. 785-792.
13. Bader T.R., Semelka R.C., Chiu V.C., et. al.: MRI of carcinoid tumors: spectrum of appearances in the gastrointestinal tract and liver. J Magn Reson Imaging 2001; 14: pp. 261-269.
14. Ward J.: New MR techniques for the detection of liver metastases. Cancer Imaging 2006; 6: pp. 33-42.
15. Keil S., Behrendt F.F., Stanzel S., et. al.: Semi-automated measurement of hyperdense, hypodense and heterogeneous hepatic metastasis on standard MDCT slices. Comparison of semi-automated and manual measurement of RECIST and WHO criteria. Eur Radiol 2008; 18: pp. 2456-2465.
16. Hughes K., Scheele J., Sugarbaker P.H.: Surgery for colorectal cancer metastatic to the liver. Optimizing the results of treatment. Surg Clin North Am 1989; 69: pp. 339-359.
17. Filippi M., Rocca M.A., Gasperini C., et. al.: Interscanner variation in brain MR lesion load measurements in multiple sclerosis using conventional spin-echo, rapid relaxation-enhanced, and fast-FLAIR sequences. AJNR Am J Neuroradiol 1999; 20: pp. 133-137.
18. Ay H., Arsava E.M., Vangel M., et. al.: Interexaminer difference in infarct volume measurements on MRI: a source of variance in stroke research. Stroke 2008; 39: pp. 1171-1176.