
Rationale and Objectives
To measure the anisotropic diffusion in kidney and to demonstrate the feasibility of renal tractography.
Materials and Methods
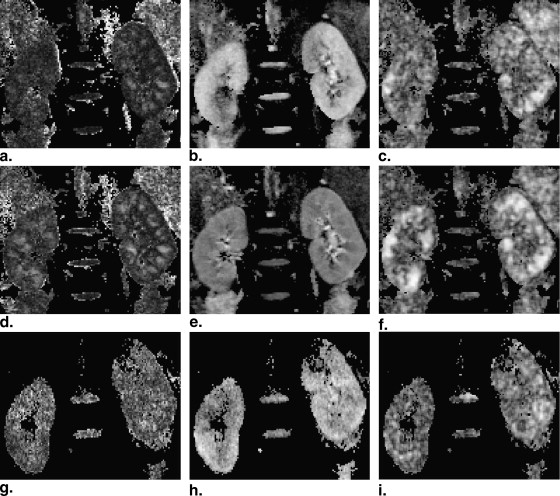
Diffusion tensor imaging was acquired in kidney from 10 healthy volunteers and 5 patients with chronic kidney disease. Diffusion indices were calculated from the tensor, including fractional anisotropy, intervoxel diffusion coherence, and mean/axial/radial diffusivity.
Results
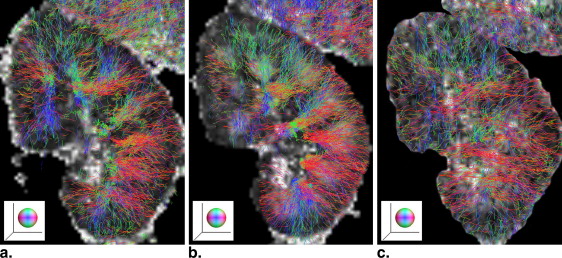
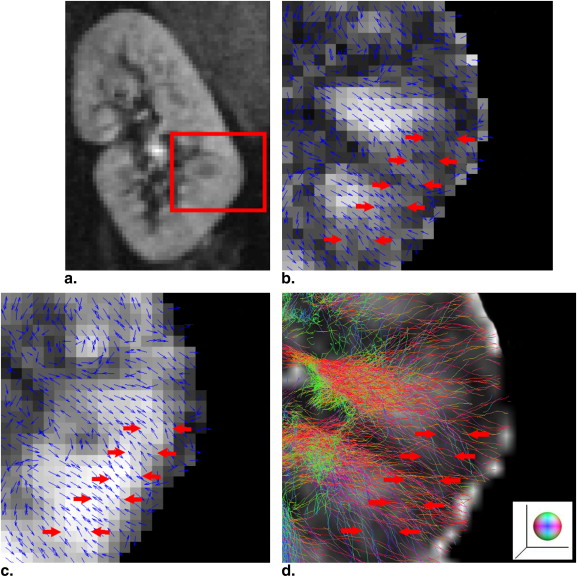
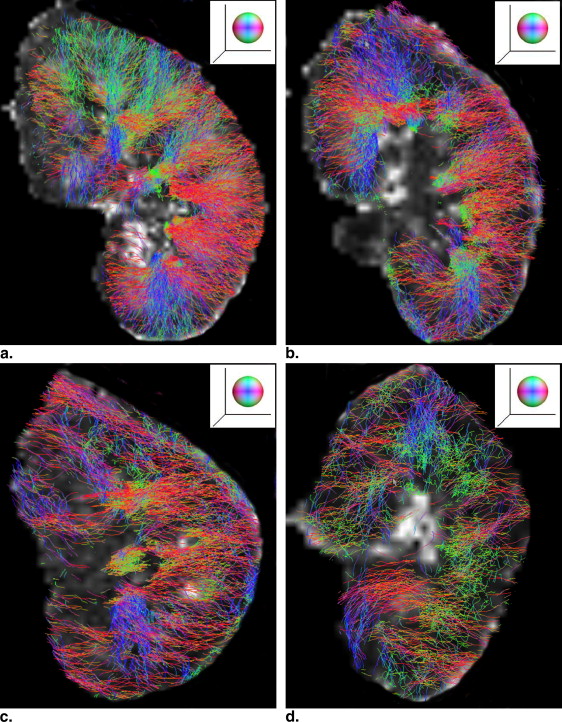
Acquisitions with respiratory triggering could provide improved image quality in all diffusion indices, as compared to that by breathhold. It is sufficient to use five to seven scan averages when the measured diffusion indices converge to a steady state in medulla, which reduced the acquisition time in a triggered measurement down to a clinically tolerable limit. Second, the measured diffusion indices can be affected by the diffusion weighting. An increased diffusion weighting will lead to an underestimation in all diffusion indices. Finally the direction of water diffusion is consistent in the kidney cortex, which was properly reflected in intervoxel diffusion coherence. In a feasibility study in healthy volunteers and patients, renal tractography was performed that visualized the organized renal structure and as it declined with the progress of chronic kidney disease.
Conclusion
When compared to conventional breath hold technique, the significant improvement in image quality compensated for the prolonged acquisition time. Therefore, triggered acquisition is preferred in a clinical setting because it required less from patient cooperation.
Conventional magnetic resonance imaging (MRI) is capable to provide morphological assessment in kidney. Recent development in diffusion imaging could allow the detection of the functional anatomical alteration. Apparent diffusion coefficient (ADC) could provide information potentially related to the tissue microstructure. Interest in measuring water diffusion in kidney arises because of its special role in water transportation function. The measured ADC could be related to the pathological changes in several renal diseases. For example, the ADC values in both the cortex and medulla in renal failure kidneys were significantly lower than those of the normal . In rats with diabetes mellitus, ADC was reported significantly lower as well . The ADC measurements were thought to be related to the histopathological changes or cellular edema within the tissue from ischemia in animal with diabetic nephropathy . Yet, these studies did not address the changes in diffusion anisotropy.
Diffusion anisotropy is related to the structural organization and therefore could be compromised during a pathological process. Diffusion tensor imaging (DTI) is a further development from diffusion-weighted MRI, which allowed the quantification of the differential diffusion along the principal directions. Indices derived from the diffusion tensor have been in clinical use, with their properties investigated . Three indices related to the magnitude of diffusivity are derived from the tensor, mean, axial and radial diffusivity (MD, AD, and RD, respectively) . MD is the averages of the ADC along all directions, a reflection of the magnitude of the tensor. In a cylindrical model, AD is the first eigenvalue, which is along the longitudinal direction of the tensor. RD is the average of the second and third eigenvalues, which is related to the diffusion along the radial direction in the cylindrical model. Indices related to diffusional anisotropy are fractional anisotropy (FA) and intervoxel diffusion coherence (IVDC) . FA quantifies the difference of directionally dependent diffusion within a voxel of interest. In a cylindrical model, it is 1. FA is 0 if the tensor is spherical. IVDC was proposed to quantify the orientational coherence among the principal diffusion directions between a voxel of interest and its closest neighborhood. The interest of measuring the diffusion anisotropy in kidney is because renal structures, such as vessels, tubules, and collecting ducts, are radially orientated, which leads to potential diffusion anisotropy .
Get Radiology Tree app to read full this article<
Get Radiology Tree app to read full this article<
Methods and materials
Get Radiology Tree app to read full this article<
Subjects
Get Radiology Tree app to read full this article<
Get Radiology Tree app to read full this article<
Image Acquisition
Get Radiology Tree app to read full this article<
Get Radiology Tree app to read full this article<
Get Radiology Tree app to read full this article<
Image Analysis
Get Radiology Tree app to read full this article<
Get Radiology Tree app to read full this article<
Region of Interest Selection and Statistical Analysis
Get Radiology Tree app to read full this article<
Get Radiology Tree app to read full this article<
Result
Get Radiology Tree app to read full this article<
Get Radiology Tree app to read full this article<
Get Radiology Tree app to read full this article<
Table 1
Effect from Number of Averages on FA
No. of Averages 1 2 3 4 5 6 7 8 9 10 11 Medulla TH 8.1E-51 ∗ 2E-24 ∗ 1E-13 ∗ 7E-08 ∗ 3E-05 ∗ 0.001 ∗ 0.015 ∗ 0.072 0.108 0.301 0.591 TL 2.1E-33 ∗ 1E-15 ∗ 5E-09 ∗ 5E-05 ∗ 0.007 0.075 0.208 0.435 0.537 0.695 0.759 BH 1.4E-50 ∗ 2E-37 ∗ 2E-25 ∗ 2E-17 ∗ 2E-10 ∗ 2E-07 ∗ 8E-06 ∗ 0.001 ∗ 0.009 ∗ 0.129 0.446 Cortex TH 4.5E-50 ∗ 1E-36 ∗ 2E-27 ∗ 1E-25 ∗ 4E-19 ∗ 1E-14 ∗ 9E-11 ∗ 6E-07 ∗ 6E-05 ∗ 0.031 ∗ 0.237 TL 5E-56 ∗ 2E-43 ∗ 2E-29 ∗ 6E-21 ∗ 5E-13 ∗ 7E-08 ∗ 2E-05 ∗ 0.004 ∗ 0.079 0.260 0.525 BH 1E-53 ∗ 8E-37 ∗ 1E-26 ∗ 3E-23 ∗ 1E-15 ∗ 4E-10 ∗ 6E-07 ∗ 0.0002 ∗ 0.012 ∗ 0.065 0.326
FA from different number of scan averages was compared to that by 12 averages using a Student’s t -test. The table contained the p values. The region of interest was located in either cortex or medulla, respectively.
BH, breath hold; FA, fractional anisotropy; TH, triggered-high; TL, triggered-low.
Get Radiology Tree app to read full this article<
Get Radiology Tree app to read full this article<
Get Radiology Tree app to read full this article<
Table 2
Diffusion Index in Kidney
FA MD AD RD Medulla TH 0.34 ± 0.10 1.23 ± 0.22 1.56 ± 0.29 1.07 ± 0.21 TL 0.44 ± 0.14 1.69 ± 0.30 2.30 ± 0.41 1.38 ± 0.31 BH 0.46 ± 0.12 0.99 ± 0.43 1.37 ± 0.55 0.82 ± 0.38 Cortex TH 0.18 ± 0.03 1.54 ± 0.16 1.74 ± 0.18 1.43 ± 0.16 TL 0.22 ± 0.05 2.01 ± 0.28 2.41 ± 0.22 1.89 ± 0.19 BH 0.26 ± 0.06 1.52 ± 0.58 1.81 ± 0.67 1.37 ± 0.53
The table showed the mean value of diffusion index at 12 averages. FA is dimensionless. MD/AD/RD are given in 10 −3 mm 2 /s.
BH, breath hold; FA, fractional anisotropy; TH, triggered-high; TL, triggered-low.
Get Radiology Tree app to read full this article<
Get Radiology Tree app to read full this article<
Get Radiology Tree app to read full this article<
Get Radiology Tree app to read full this article<
Get Radiology Tree app to read full this article<
Get Radiology Tree app to read full this article<
Get Radiology Tree app to read full this article<
Discussion
Get Radiology Tree app to read full this article<
Breathhold and Respiratory Triggering
Get Radiology Tree app to read full this article<
Get Radiology Tree app to read full this article<
Diffusion Weighting
Get Radiology Tree app to read full this article<
Get Radiology Tree app to read full this article<
Directional Coherence and Diffusion Anisotropy
Get Radiology Tree app to read full this article<
Get Radiology Tree app to read full this article<
Renal Tractography and its Clinical Implications
Get Radiology Tree app to read full this article<
Get Radiology Tree app to read full this article<
Get Radiology Tree app to read full this article<
References
1. Namimoto T., Yamashita Y., Mitsuzaki K., et. al.: Measurement of the apparent diffusion coefficient in diffuse renal disease by diffusion-weighted echo-planar MR imaging. J Magn Res Imaging 1999; 9: pp. 832-837.
2. Ries M., Jones R.A., Basseau F., et. al.: Diffusion tensor MRI of the human kidney. J Magn Reson Imaging 2001; 14: pp. 42-49.
3. Ries M., Basseau F., Tyndal B., et. al.: Renal diffusion and BOLD MRI in experimental diabetic nephropathy. J Magn Reson Imaging 2003; 17: pp. 104-113.
4. Wang J.J., Chao T., Wai Y.Y., et. al.: Novel diffusion anisotropy indices: an evaluation. J Magn Reson Imaging 2006; 24: pp. 211-217.
5. Smith S.A., Prince J.L., van Zijl P.C.M., et. al.: Effects of signal-to-noise ratio on the accuracy and reproducibility of diffusion tensor imaging–derived fractional anisotropy, mean diffusivity, and principal eigenvector measurements at 1.5 T. J Magn Reson Imaging 2007; 26: pp. 756-767.
6. Landman B.A., Farrell J.A.D., Jones C.K., et. al.: Effects of diffusion weighting schemes on the reproducibility of DTI-derived fractional anisotropy, mean diffusivity, and principal eigenvector measurements at 1.5 T. Neuroimage 2007; 36: pp. 1123-1138.
7. Moeller F.G., Hasan K.M., Steinberg J.L., et. al.: Diffusion tensor imaging eigenvalues: Preliminary evidence for altered myelin in cocaine dependence. Psychiatry Res Neuroimaging 2007; 154: pp. 253-258.
8. Song S.K., Sun S.W., Ramsbottom M.J., et. al.: Dysmyelination revealed through MRI as increased radial (but unchanged axial) diffusion of water. NeuroImage 2002; 17: pp. 1429-1436.
9. Basser P.J., Pierpaoli C.: Microstructural and physiological features of tissues elucidated by quantitative-diffusion-tensor MRI. J Magn Reson Imaging 1996; 111: pp. 209-219.
10. Wang J.J., Lin Y.C., Wai Y.Y., et. al.: Visualization of the coherence of the principal diffusion orientation: An eigenvector-based approach. J Magn Reson Imaging 2008; 59: pp. 764-770.
11. Turner R., Le Bihan D., Maier J., et. al.: Echo-planar imaging of intravoxel incoherent motion. Radiology 1990; 177: pp. 407-414.
12. Fukuda Y., Ohashi I., Hanafusa K., et. al.: Anisotropic diffusion in kidney: apparent diffusion coefficient measurements for clinical use. J Magn Reson Imaging 2000; 11: pp. 156-160.
13. Notohamiprodjo M., Glaser C., Herrmann K.A., et. al.: Diffusion tensor imaging of the kidney with parallel imaging: initial clinical experience. Invest Radiol 2008; 43: pp. 677-685.
14. Siegel C.L., Aisen A.M., Ellis J.H., et. al.: Feasibility of MR diffusion studies in the kidney. J Magn Reson Imaging 1995; 5: pp. 617-620.
15. Kataoka M., Kido A., Yamamoto A., et. al.: Diffusion tensor imaging of kidneys with respiratory triggering: optimization of parameters to demonstrate anisotropic structures on fraction anisotropy maps. J Magn Reson Imaging 2009; 29: pp. 736-7344.
16. Levey A.S., Bosch J.P., Lewis J.B., et. al.: A more accurate method to estimate glomerular filtration rate from serum creatinine: a new prediction equation. Ann Intern Med 1999; 130: pp. 4613-4819.
17. Eknoyan G., Levin N.W.: K/DOQI clinical practice guidelines for chronic kidney disease: evaluation, classification, and stratification. Am J Kidney Dis 2002; 39: pp. S1-S266.
18. Tournier J.D., Calamante F., Connelly A.: Robust determination of the fibre orientation distribution in diffusion MRI: non-negativity constrained super-resolved spherical deconvolution. Neuroimage 2007; 35: pp. 1459-1472.
19. Landman B.A., Farrell J.A., Huang H., et. al.: Diffusion tensor imaging at low SNR: nonmonotonic behaviors of tensor contrasts. J Magn Reson Imaging 2008; 26: pp. 790-800.
20. Bastin M.E., Armitage P.A., Marshall I.: A theoretical study of the effect of experimental noise on the measurement of anisotropy in diffusion imaging. J Magn Reson Imaging 1998; 16: pp. 773-785.
21. Zhang J.L., Sigmund E.E., Chandarana H., et. al.: Variability of renal apparent diffusion coefficients: limitations of the monoexponential model for diffusion quantification. Radiology 2010; 254: pp. 783-792.
22. Notohamiprodjo M., Dietrich O., Horger W., et. al.: Diffusion tensor imaging (DTI) of the kidney at 3 tesla-feasibility, protocol evaluation and comparison to 1.5 Tesla. Invest Radiol 2010; 45: pp. 245-254.
23. Xing D., Papadakis N.G., Huang C.L.H., et. al.: Optimised diffusion-weighting for measurement of apparent diffusion coefficient (ADC) in human brain. J Magn Reson Imaging 1997; 15: pp. 771-784.