
Rationale and Objectives
The purpose of this study was to measure and analyze interobserver disagreement in rating diagnostic characteristics of pulmonary nodules on computed tomography scans using the Lung Imaging Database Consortium and Image Database Resource Initiative (LIDC/IDRI) database, and then to provide investigators with understanding the variability in rating diagnostic characteristics among radiologists.
Materials and Methods
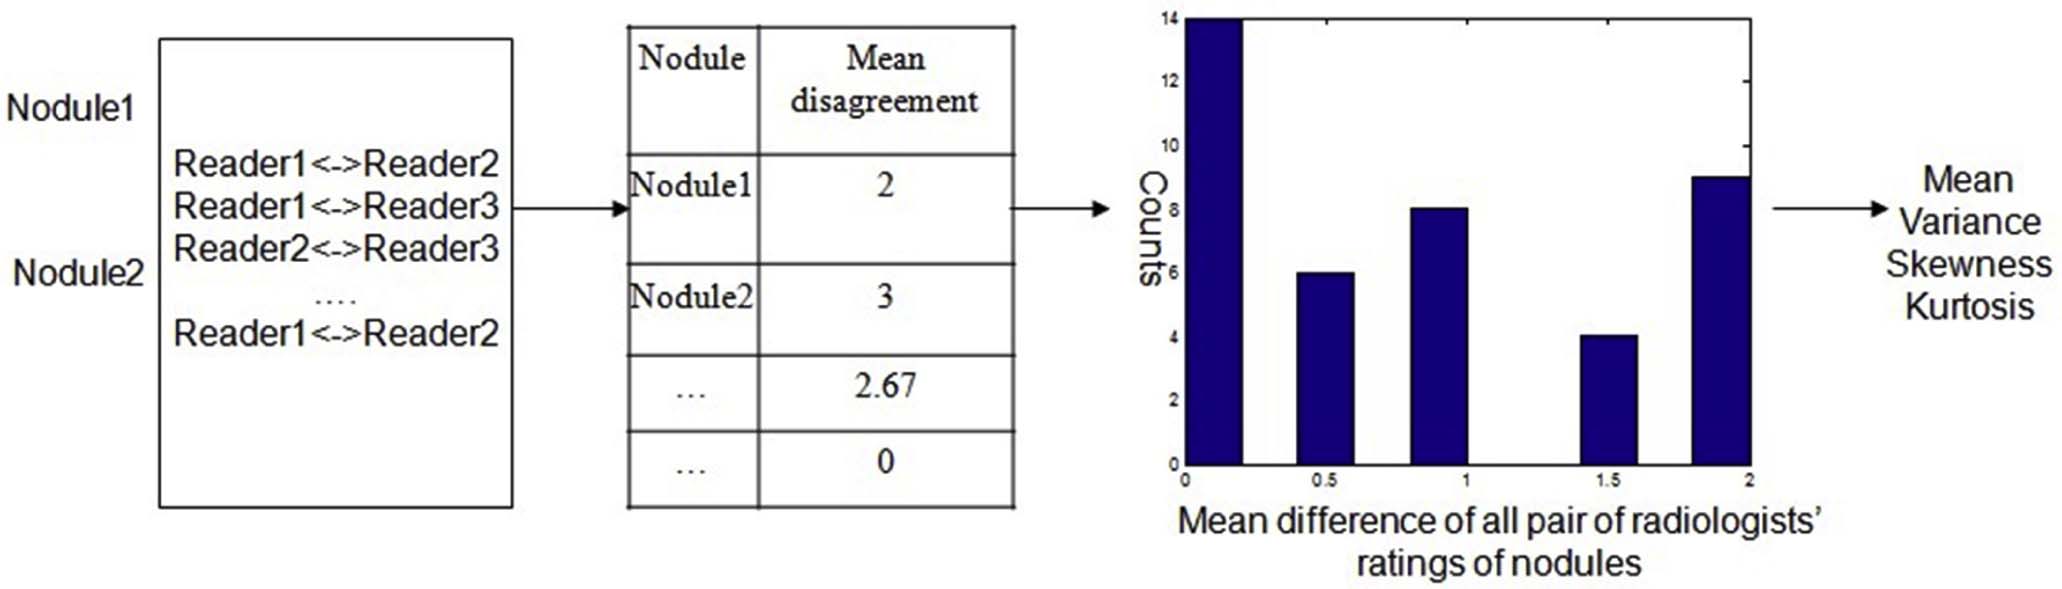
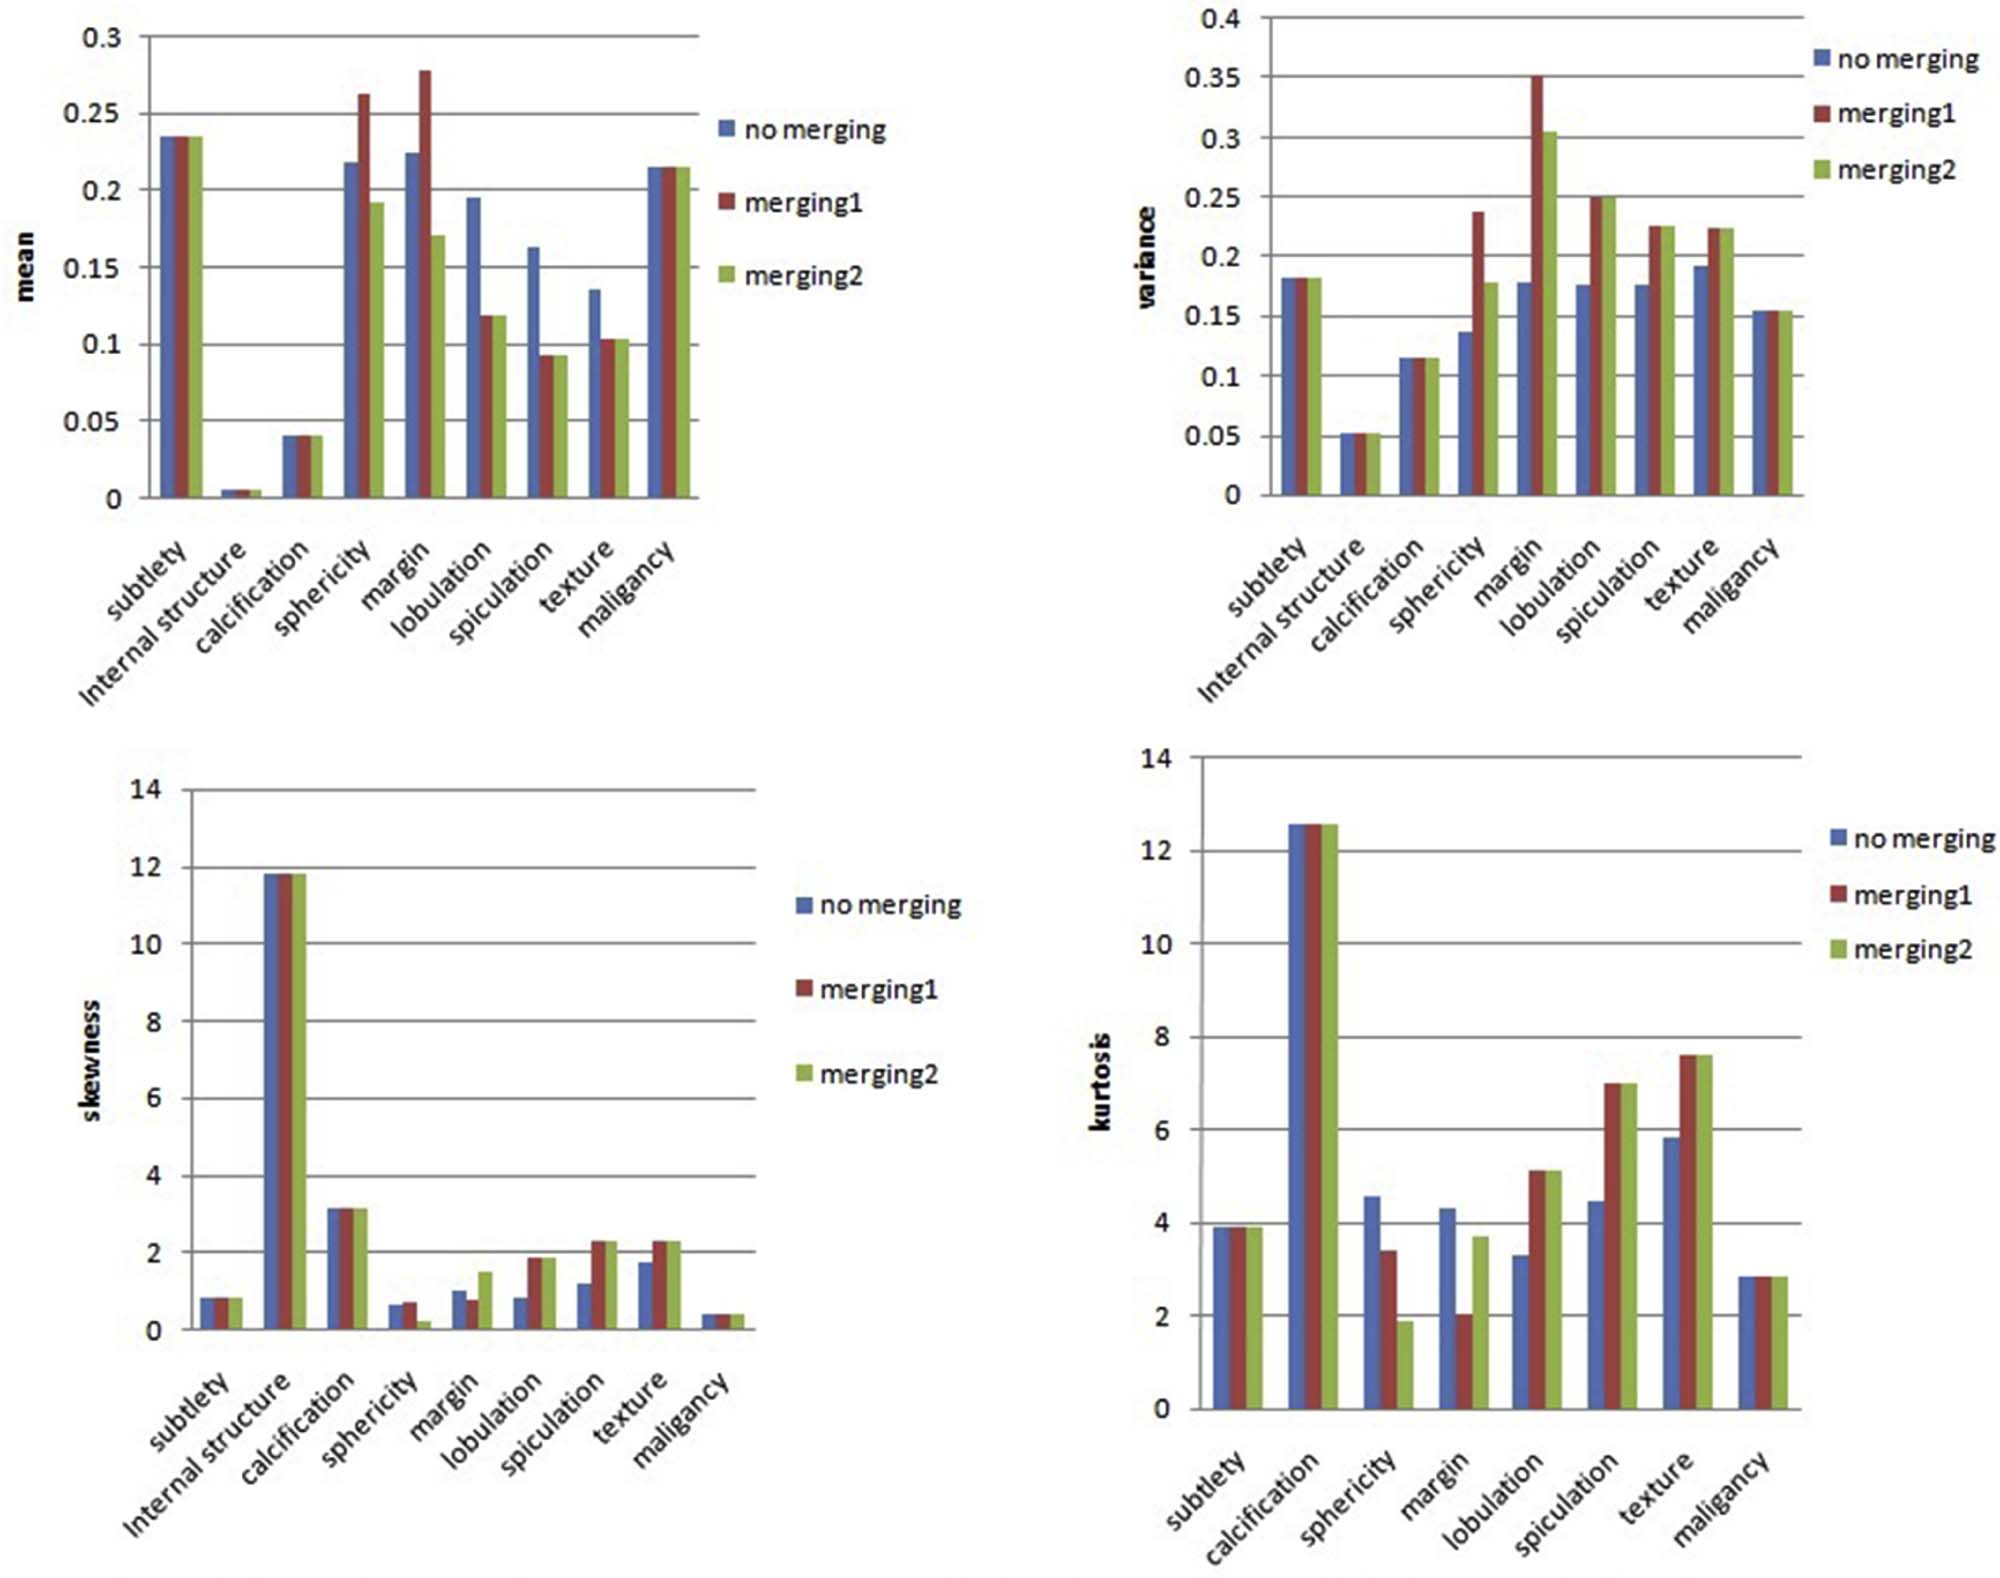
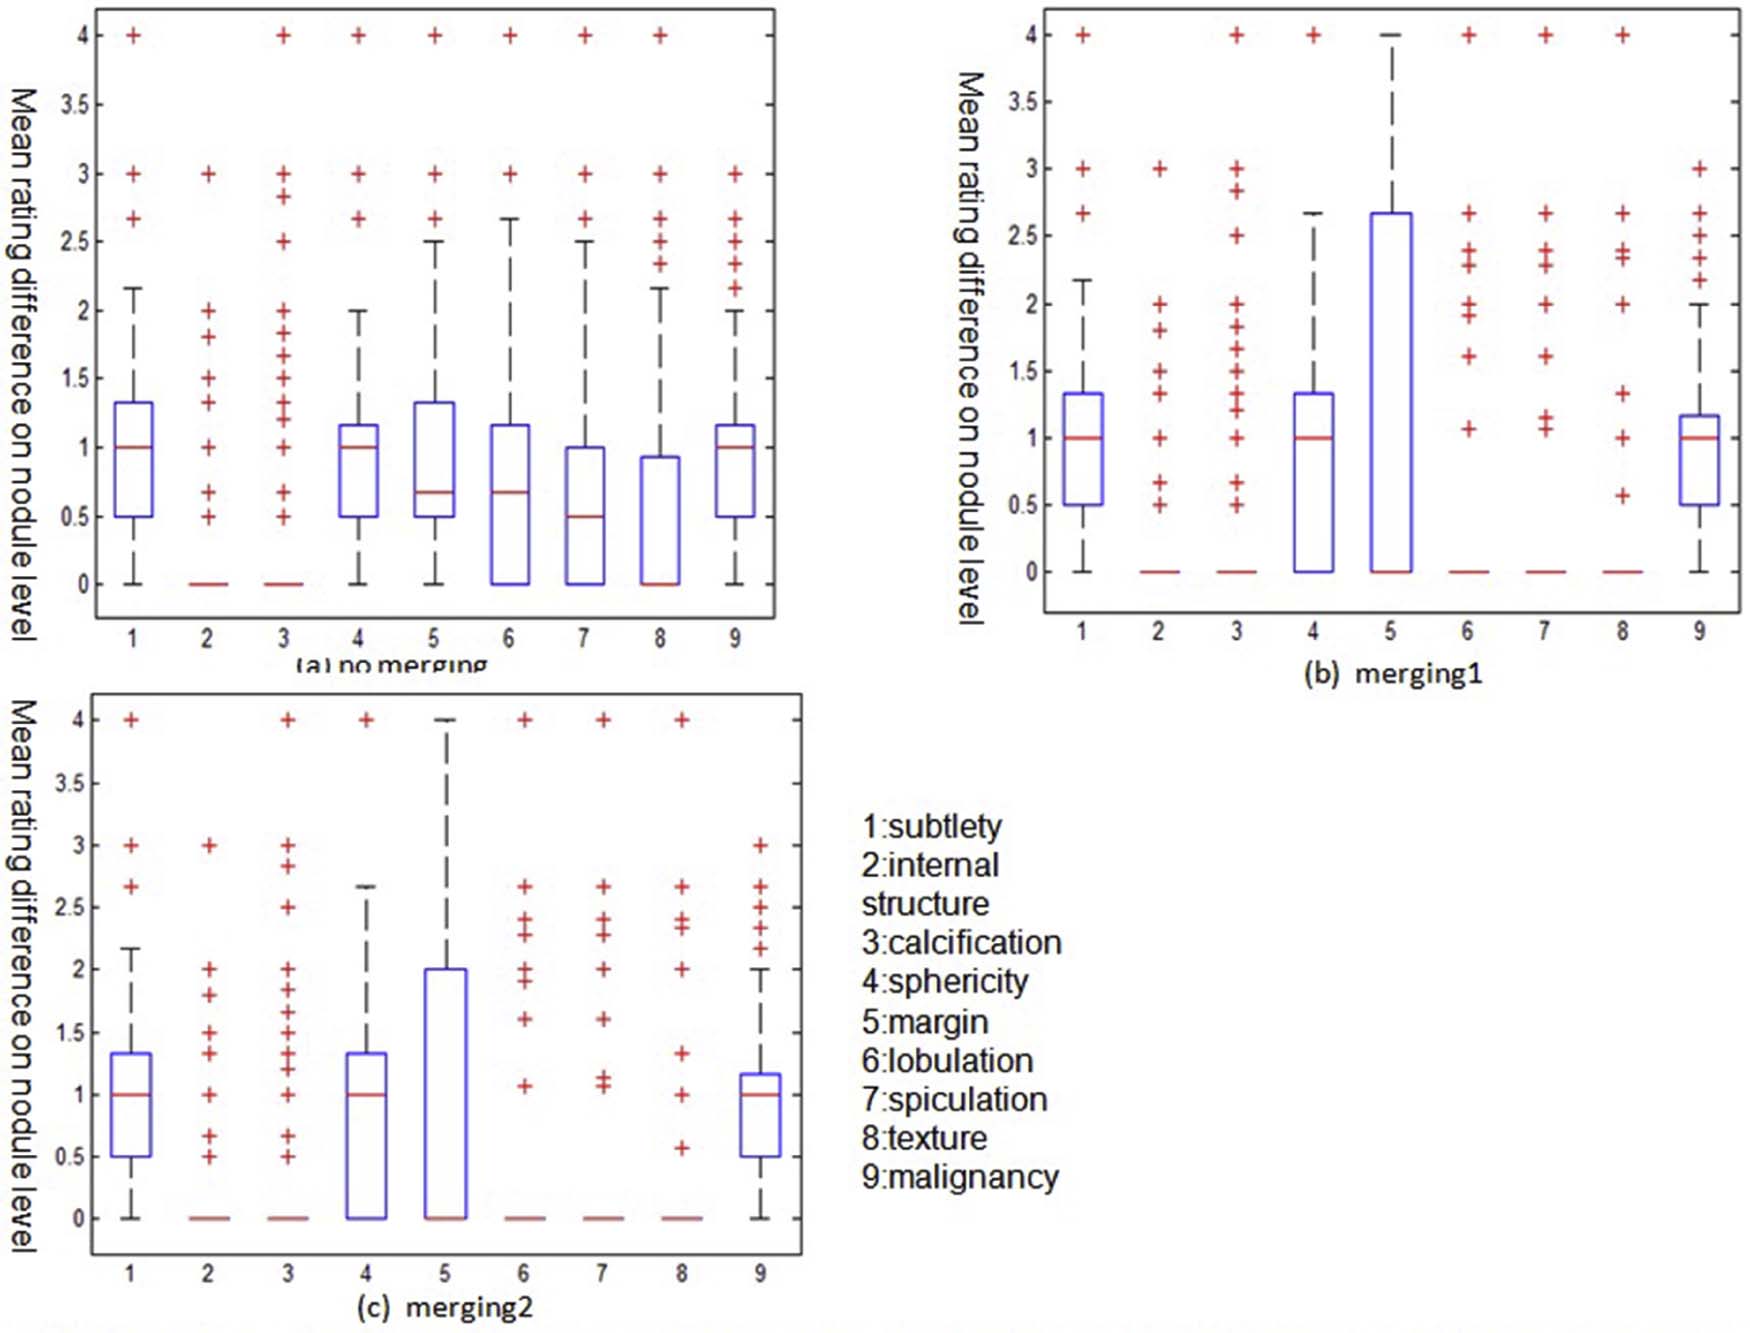
A histogram-based accumulated nodule-level approach is proposed to measure interobserver disagreement in rating diagnostic characteristics of pulmonary nodules among radiologists. The mean rating differences of radiologists on nodule level are calculated; next, a histogram of the accumulated nodule-level disagreements is constructed; and finally, mean, variance, skewness, and kurtosis statistics based on the histogram are extracted to analyze and summary interobserver disagreement in terms of the assessment of diagnostic characteristics of radiologists. Using the developed computer scheme, the disagreement of radiologists in rating all of 1880 distinct nodules from 1018 computed tomography scans are analyzed using original ratings as well as combined ratings according to the LIDC/IDRI instruction.
Results
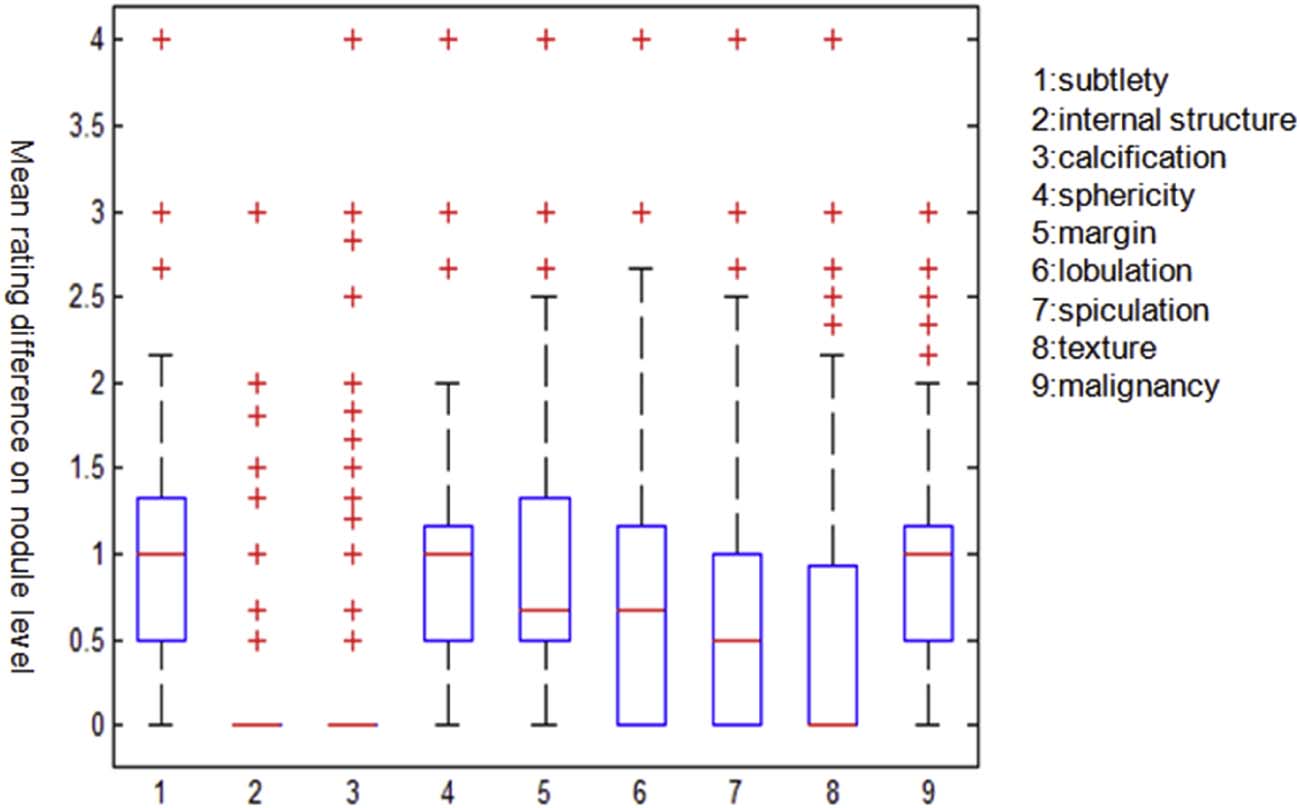
The interobserver disagreement in rating diagnostic characteristics according to the defined categories of the LIDC/IDRI is substantial. The mean values of disagreement range from 0.0052 to 0.2341. The highest disagreement lies in rating subtlety characteristics, whereas internal structure receives the lowest disagreement of 0.0052. The calcification, texture, spiculation, lobulation, malignancy, sphericity, and margin receive disagreements of 0.0393, 0.1351, 0.1616, 0.1943, 0.2144, 0.2174, and 0.2228, respectively.
Conclusions
Disagreements exist across radiologists in rating diagnostic characteristics of pulmonary nodules, and the disagreement levels vary from each other. Agreement among radiologists is improved by combining ratings according to the LIDC/IDRI instruction. For investigators, understanding and appreciating the disagreement level of each diagnostic characteristic is required when using them in related researches.
Introduction
A well-characterized repository of computed tomography (CT) scans is essential for developing computer-aided diagnostic methods for lung nodule detection, classification, and quantitative assessment. The Lung Image Database Consortium (LIDC) and Image Database Resource Initiative (IDRI) established a publicly available reference database for the medical imaging research community. The reference database is referred to as the LIDC/IDRI database .
Now, the LIDC/IDRI database contains 1018 CT cases in total, each of which includes images from a clinical thoracic CT scan and an associated XML file that records the results of annotation performed by four experienced thoracic radiologists. Annotation files record the presence and category of each pulmonary nodule. For each nodule with a diameter of 3 mm or more, the outline and a set of ratings of diagnostic characteristics such as texture, spiculation, lobulation, malignancy, sphericity, and margin are also recorded.
Get Radiology Tree app to read full this article<
Get Radiology Tree app to read full this article<
Get Radiology Tree app to read full this article<
Get Radiology Tree app to read full this article<
Get Radiology Tree app to read full this article<
The LIDC/IDRI Database
Get Radiology Tree app to read full this article<
Get Radiology Tree app to read full this article<
Get Radiology Tree app to read full this article<
Get Radiology Tree app to read full this article<
Table 1
Summary of Subjective Ratings and Associated Descriptive Terms of Nodule Diagnostic Characteristics Provided by the LIDC/IDRI Radiologists
Characteristics Description Ratings and Terms Calcification Calcification appearance in the nodule 1: Popcorn (popcorn appearance)
2: Laminated (laminated appearance)
3: Solid (solid appearance)
4: Non-central (non-central appearance)
5: Central (central calcification)
6: Absent Internal structure Internal composition of the nodule (soft tissue, fluid, fat, air) 1: Soft tissue
2: Fluid
3: Fat
4: Air Subtlety Difficulty in detection—refers to the contrast between the lung and its surroundings 1: Extremely subtle
2: Moderately subtle
3: Fairly subtle
4: Moderately obvious
5: Obvious Lobulation Whether a lobular shape is apparent from the margin or not 1: Marked (marked lobulation)
5: None (no lobulation) Margin How well defined the margins of the nodule are 1: Poorly (poorly defined)
5: Sharp (sharp margin) Sphericity Three-dimensional shape of the nodule in terms of its roundness 1: Linear (linear appearance)
3: Ovoid (ovoid appearance)
5: Round (round appearance) Malignancy Likelihood of malignancy of the nodule 1: Highly unlikely
2: Moderately unlikely
3: Indeterminate
4: Moderately suspicious
5: Highly suspicious Texture Internal texture of the nodule 1: Non-solid/ground class opacity
3: Part-solid/mixed
5: Solid texture Spiculation Nodule spiculation 1: Marked (marked spiculation)
5: No spiculation (no spiculation)
Get Radiology Tree app to read full this article<
Get Radiology Tree app to read full this article<
Materials and Methods
Get Radiology Tree app to read full this article<
Get Radiology Tree app to read full this article<
Get Radiology Tree app to read full this article<
Get Radiology Tree app to read full this article<
Get Radiology Tree app to read full this article<
Mean=∑L−1k=0kp(k) Mean
=
∑
k
=
0
L
−
1
k
p
(
k
)
m=Mean/L m
=
Mean
/
L
Get Radiology Tree app to read full this article<
Get Radiology Tree app to read full this article<
Get Radiology Tree app to read full this article<
δ2b=∑L−1k=0(Mean−k)2p(k) δ
b
2
=
∑
k
=
0
L
−
1
(
Mean
−
k
)
2
p
(
k
)
Get Radiology Tree app to read full this article<
Get Radiology Tree app to read full this article<
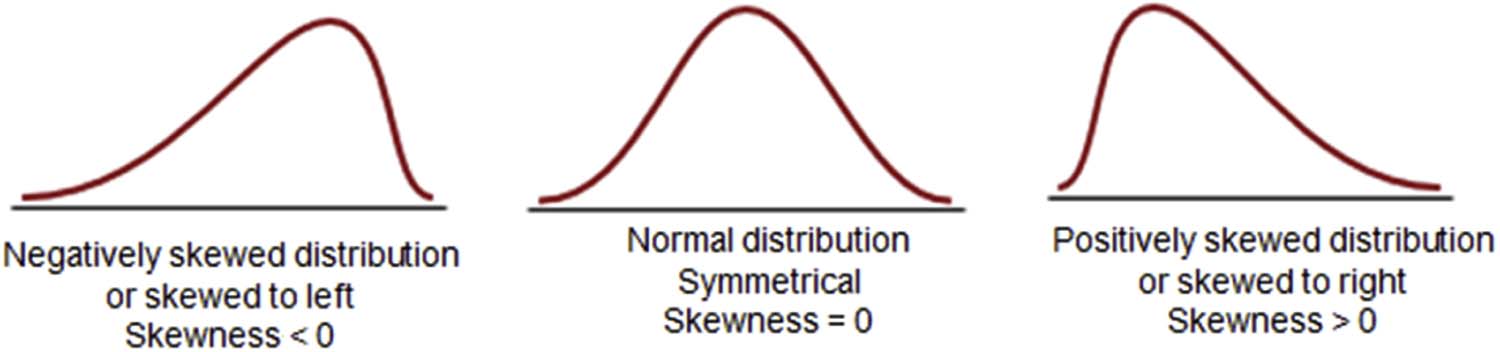
bs=1δ3b∑L−1k=0(Mean−k)3p(k) b
s
=
1
δ
b
3
∑
k
=
0
L
−
1
(
Mean
−
k
)
3
p
(
k
)
Get Radiology Tree app to read full this article<
Get Radiology Tree app to read full this article<
bk=1δ4b∑L−1k=0(Mean−k)4p(k)−31n b
k
=
1
δ
b
4
∑
k
=
0
L
−
1
(
Mean
−
k
)
4
p
(
k
)
−
3
1
n
Get Radiology Tree app to read full this article<
Get Radiology Tree app to read full this article<
Results
Get Radiology Tree app to read full this article<
Get Radiology Tree app to read full this article<
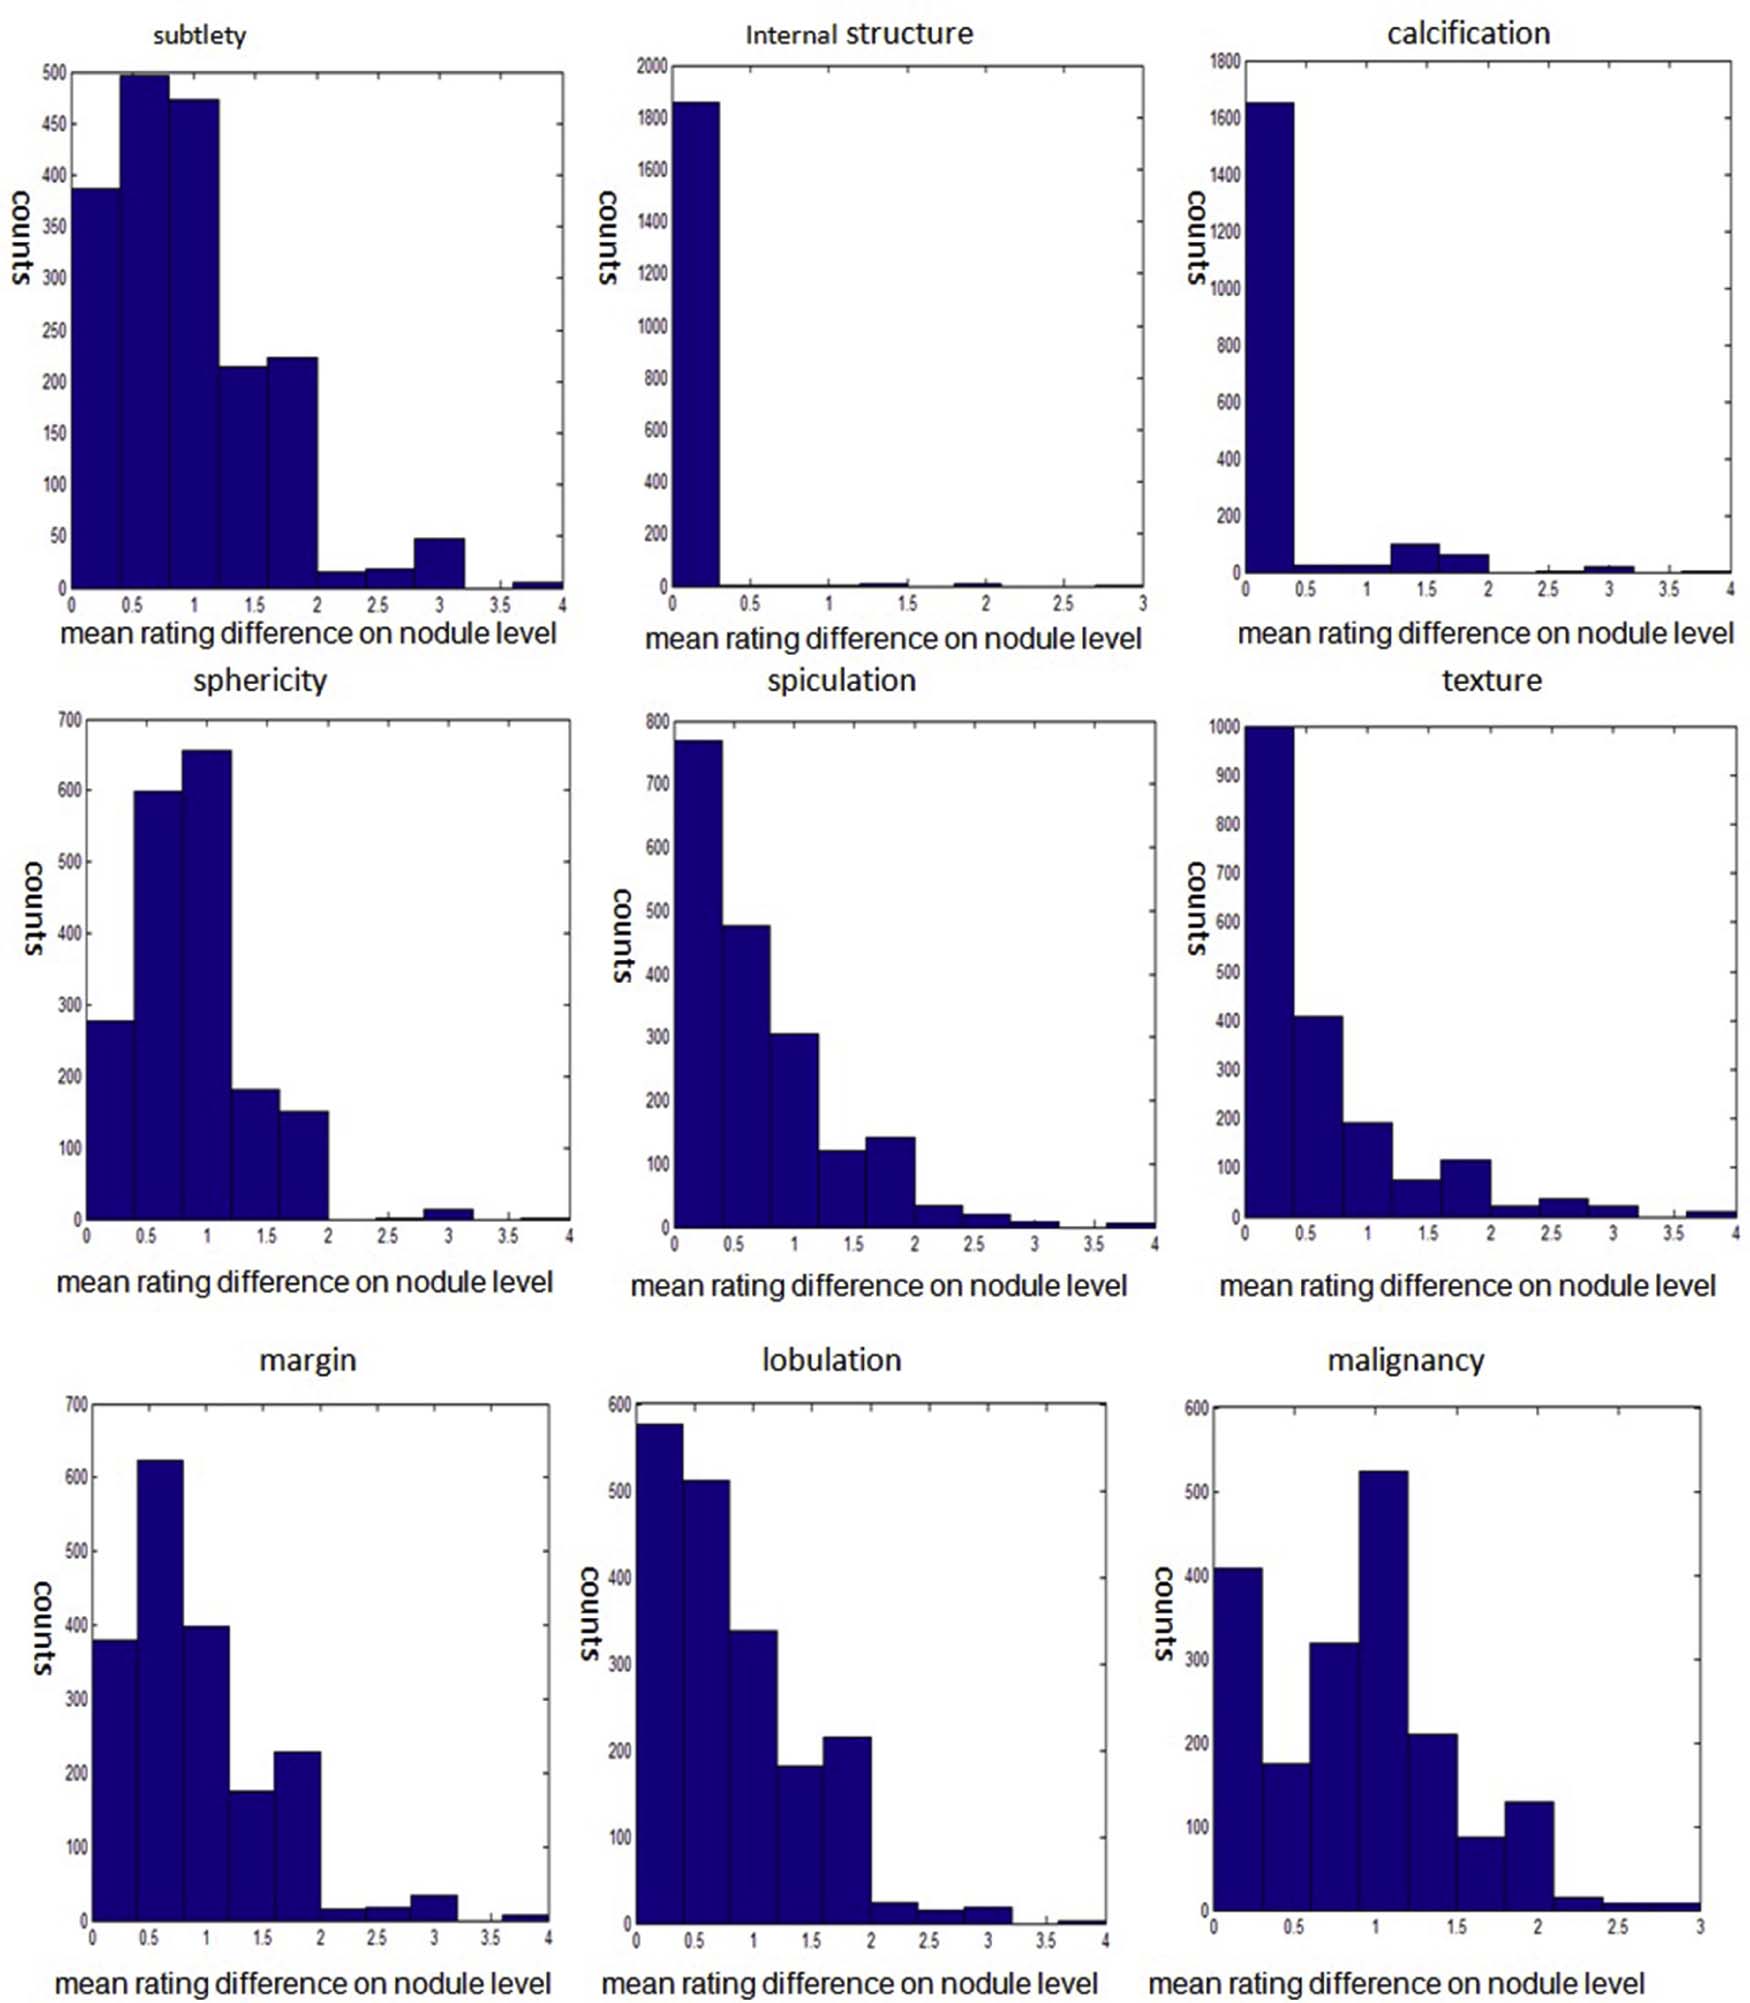
Table 2
Characteristics Disagreement Statistics of Original Ratings
Characteristics Disagreement Statistics Mean Variance Skewness Kurtosis Subtlety 0.2341 0.1821 0.8125 3.8728 Internal structure 0.0052 0.0508 11.820 136.1363 Calcification 0.0393 0.1146 3.0952 12.5461 Sphericity 0.2174 0.1366 0.5885 4.5341 Margin 0.2228 0.1777 0.9500 4.2735 Lobulation 0.1943 0.1766 0.7662 3.2748 Spiculation 0.1616 0.1769 1.1691 4.4611 Texture 0.1351 0.1921 1.7033 5.8038 Maligancy 0.2144 0.1548 0.3540 2.8429
Get Radiology Tree app to read full this article<
Get Radiology Tree app to read full this article<
Get Radiology Tree app to read full this article<
Get Radiology Tree app to read full this article<
Get Radiology Tree app to read full this article<
Get Radiology Tree app to read full this article<
Get Radiology Tree app to read full this article<
Table 3
Ratings Combinations
Characteristics Ratings Combination Final Ratings and Terms Merging1 Merging2 Lobulation 2,3->1
4->5 2,3->1
4->5 1: Marked lobulation
5: No lobulation Margin 2,3->1
4->5 2->1
3,4->5 1: Poorly defined
5: Sharp margin Sphericity 2->1
4->5 2->3
4->5 1: Linear appearance
3: Ovoid appearance
5: Round appearance Texture 2->1
4->5 2->1
4->5 1: Non-solid/ground opacity
3: Part-solid/mixed
5: Solid texture Spiculation 2,3->1
4->5 2,3->1
4->5 1: Marked spiculation
5: No spiculation
Get Radiology Tree app to read full this article<
Get Radiology Tree app to read full this article<
Table 4
Characteristics Disagreement Statistics of Merging1
Characteristics Disagreement Statistics Mean Variance Skewness Kurtosis Sphericity 0.2619 0.2373 0.6840 3.3641 Margin 0.2774 0.3517 0.7277 2.0388 Lobulation 0.1173 0.2495 1.8614 5.1059 Spiculation 0.0916 0.2253 2.2808 6.9937 Texture 0.1022 0.2243 2.2737 7.5698
Table 5
Characteristics Disagreement Statistics of Merging2
Characteristics Disagreement Statistics Mean Variance Skewness Kurtosis Sphericity 0.1915 0.1775 0.2067 1.8832 Margin 0.1693 0.3045 1.4673 3.7036 Lobulation 0.1173 0.2495 1.8614 5.1059 Spiculation 0.0916 0.2253 2.2808 6.9937 Texture 0.1022 0.2243 2.2737 7.5698
Get Radiology Tree app to read full this article<
Conclusions and Discussion
Get Radiology Tree app to read full this article<
Get Radiology Tree app to read full this article<
Get Radiology Tree app to read full this article<
Get Radiology Tree app to read full this article<
Get Radiology Tree app to read full this article<
Get Radiology Tree app to read full this article<
Get Radiology Tree app to read full this article<
Acknowledgments
Get Radiology Tree app to read full this article<
References
1. Armato S.G., McLennan G., Bidaut L., et. al.: The Lung Image Database Consortium (LIDC) and Image Database Resource Initiative (IDRI): a completed reference database of lung nodules on CT scans. Med Phys 2011; 38: pp. 915-935.
2. McNitt-Gray M.F., Armato S.G., Meyer C.R., et. al.: The Lung Image Database Consortium (LIDC) data collection process for nodule detection and annotation. Acad Radiol 2007; 14: pp. 1464-1474.
3. Zinovev D., Varutbangkul E., Raicu D.S., et. al.: Semi-supervised learning approaches for predicting semantic characteristics of lung nodules. Intell Decis 2009; 3: pp. 207-217.
4. Han F., Wang H., Zhang G., et. al.: Texture feature analysis for computer-aided diagnosis on pulmonary nodules. J Digit Imaging 2015; 28: pp. 99-115.
5. Armato S.G., McNitt-Gray M.F., Reeves A.P., et. al.: Hot topic: the Lung Image Database Consortium (LIDC): an evaluation of radiologist variability in the identification of lung nodules in CT scans. Radiological Society of North America 2005 Scientific Assembly and Meeting2005.
6. Meyer C.R., Johnson T.D., McLennan G., et. al.: Evaluation of lung MDCT nodule annotation across radiologists and methods. Acad Radiol 2006; 13: pp. 1254-1265.
7. Zhao L., Lee M.C., Boroczky L., et. al.: Comparison of computer-aided diagnosis performance and radiologist readings on the LIDC pulmonary nodule dataset. Med Imag Int Soc Optics Photon 2008; 69151I-69151I-8
8. Wiemker R., Bergtholdt M., Dharaiya E., et. al.: Agreement of CAD features with expert observer ratings for characterization of pulmonary nodules in CT using the LIDC-IDRI database. Proc SPIE Int Soc Opt Eng 2009; 7260: 72600H-72600H-12
9. Horsthemke W.H., Raicu D.S., Furst J.D.: Evaluation challenges for bridging semantic gap: shape disagreements on pulmonary nodules in the lung image database consortium. Int J Healthc Inform Syst Inform 2009; 4: pp. 17-33.
10. Wang W., Luo J., Yang X., Lin H., et. al.: Data analysis of the lung imaging database consortium and image database resource initiative. Acad Radiol 2015; 22: pp. 488-495.
11. Zhou Z., Wang Y., Wu Q.J., et. al.: Effective and efficient global context verification for image copy detection. IEEE Trans Inform Forens Secur 2016; 99:
12. Fleiss J.L., Cohen J., Everitt B.S.: Large sample standard errors of kappa and weighted kappa. Psychol Bull 1969; 72: pp. 323-327.
13. Son Y.S., Baek J.: A modified correlation coefficient based similarity measure for clustering time-course gene expression data. Pattern Recognit Lett 2008; 29: pp. 232-242.
14. Fawcett T.: An introduction to ROC analysis. Pattern Recognit Lett 2006; 27: pp. 861-874.
15. Elangovan M., Ramachandran K.I., Sugumaran V.: Studies on Bayes classifier for condition monitoring of single point carbide tipped tool based on statistical and histogram features. Expert Syst Appl 2010; 37: pp. 2059-2065.