
Rationale and Objectives
Whole-body computed tomography (WBCT) imaging has become commonplace in some emergency departments (EDs) for trauma where management is dependent on rapid diagnosis achieved through comprehensive imaging. The purpose of this study was to assess the value that computed tomography (CT) imaging contributes to trauma patients by retrospectively comparing hospital length of stay (LOS) between WBCT and selective CT imaging, while controlling for hemodynamic stability and socio-economic considerations.
Materials and Methods
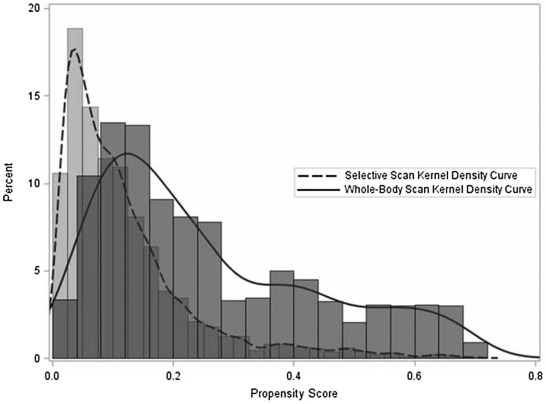
This study was institutional review board approved. The institutional trauma registry database was cross-referenced with our radiology information system database to identify adult patients who sustained blunt trauma between July 2011 and June 2013 and received CT imaging. Propensity score weighting was utilized to achieve balance in baseline covariates, including demographics, hemodynamic stability, Glasgow Coma Scale, and socioeconomic factors. A generalized linear model was used to compare LOS between imaging types, and a multinomial logistic regression was utilized to analyze differences in discharge disposition.
Results
A total of 2291 patients were identified of which 14.5% underwent WBCT imaging. WBCT patients had an insignificantly longer inpatient hospital LOS of 0.31 days ( P = 0.54), and insignificantly higher odds of being discharged to a nursing home facility (versus home, odds ratio = 1.29 [ P = 0.34]) when compared to those who received selective CT.
Conclusion
WBCT imaging did not have a statistically significant effect on inpatient hospital LOS or discharge disposition.
Introduction
In the emergency department (ED), computed tomography (CT) utilization has increased threefold between 1996 and 2007, with a quarter of all CTs performed in the United States occurring in the ED . Determining the optimal use and justification for emergent testing is essential to containing the costs of medical care. A critical area of focus for imaging utilization in the ED is in the trauma setting. The early diagnostic evaluation of patients with severe trauma has become increasingly dependent on rapid and comprehensive imaging, with an emphasis on CT over the past two decades . CT distinguishes patients with injuries requiring intervention from patients without critical injuries, so that the trauma team can safely focus on the acute care issues . With rapid data acquisition and improved image quality, whole-body computed tomography imaging (WBCT) (defined as head, C-spine, chest, abdomen, and pelvis) is being used with increasing frequency in the trauma setting . However, the use of WBCT imaging in patients with blunt trauma in the ED remains controversial due to (1) the proliferation of potentially unnecessary imaging, (2) the associated risk of radiation exposure, (3) the added cost of the additional imaging, (4) the added time in the scanner, and (5) the expense of further workup of incidental findings .
The literature describing WBCT imaging is mostly from Europe and has found reduced mortality in severe blunt trauma patients who underwent WBCT imaging . However, the generalizability of these results to the United States remains to be determined due to the differences in our health-care systems. The purpose of our study was to examine the impact of trauma imaging strategies on patient outcomes in a US level 1 trauma center. Primary end points included hospital length of stay (LOS) and discharge disposition, while secondary endpoints included intensive care unit (ICU) LOS and mortality rate.
Methods and Materials
Get Radiology Tree app to read full this article<
Get Radiology Tree app to read full this article<
Get Radiology Tree app to read full this article<
Table 1
Prepropensity Weighting Balance ( N = 11,318)
Variables Selective Imaging
( n = 9,774) Whole-Body Imaging
( n = 1,544) Absolute Standardized Difference Age, mean (SD) 49.0 (21.3) 44.2 (18.7) 0.237 Home Distance to the University, mean (SD) 262.2 (697.7) 241.0 (502.4) 0.035 ED Glasgow Coma Scale, mean (SD) 13.9 (3.0) 12.2 (4.6) 0.440 ED Pulse, mean (SD) 88.7 (18.5) 94.9 (23.2) 0.299 ED Systolic Blood Pressure, mean (SD) 132.6 (22.0) 126.9 (23.2) 0.255 Glucose, mean (SD) 122.2 (47.7) 130.1 (46.9) 0.168 Potassium, mean (SD) 3.9 (0.5) 3.9 (0.6) 0.054 Anion Gap, mean (SD) 10.5 (3.6) 10.3 (3.9) 0.060 Calcium, mean (SD) 8.9 (0.9) 8.4 (1.0) 0.481 Sodium, mean (SD) 139.1 (3.8) 140.0 (3.7) 0.228 BUN, mean (SD) 16.3 (9.3) 15.1 (7.7) 0.146 Chloride, mean (SD) 106.1 (4.8) 108.2 (5.1) 0.415 Creatinine, mean (SD) 1.0 (0.6) 0.9 (0.3) 0.048 Carbon Dioxide, mean (SD) 22.5 (3.9) 21.5 (4.2) 0.242 WBC Count, mean (SD) 11.7 (5.0) 13.5 (6.6) 0.298 Red Blood Cell Count, mean (SD) 4.6 (0.7) 4.5 (0.8) 0.195 Platelet Count, mean (SD) 257.2 (80.2) 253.5 (77.6) 0.047 PTT, mean (SD) 28.7 (6.4) 29.2 (10.0) 0.058 INR, mean (SD) 1.2 (0.5) 1.2 (0.5) 0.108 Received FFP on Admission, % 2.5 4.0 0.088 Received PRBCs on Admission, % 1.6 5.3 0.205 Received Lactate Test, % 16.6 44.6 0.638 Female, % 33.4 26.4 0.154 Hospital Transfer, % 41.4 34.8 0.136 Type of Insurance Private, % 38.8 35.4 0.070 Public, % 32.8 26.6 0.137 Not Funded, % 24.5 32.7 0.183 Other, % 3.9 5.3 0.068 Mechanism of Injury Fall, % 38.1 21.7 0.364 Vehicle, % 49.9 72.8 0.483 Assault, % 7.1 1.9 0.249 Other, % 4.9 3.6 0.067
BUN, blood urea nitrogen; ED, emergency department; FFP, fresh frozen plasma; INR, international normalized ratio; PRBC, packed red blood cell; PTT, partial thromboplastin time; RBC, red blood cell; SD, standard deviation; WBC, white blood cell.
Get Radiology Tree app to read full this article<
Get Radiology Tree app to read full this article<
Get Radiology Tree app to read full this article<
Get Radiology Tree app to read full this article<
Get Radiology Tree app to read full this article<
Results
Get Radiology Tree app to read full this article<
Get Radiology Tree app to read full this article<
Table 2
Postpropensity Weighting Balance ( N = 11,318)
Selective Imaging
( n = 9,774) Whole-Body Imaging
( n = 1,544) Absolute Standardized Difference Age, mean (SD) 43.8 (7.7) 44.2 (18.7) 0.026 Home Distance to the University, mean (SD) 248.0 (223.8) 241.0 (502.4) 0.018 ED Glasgow Coma Scale, mean (SD) 12.1 (1.9) 12.2 (4.6) 0.017 ED Pulse, mean (SD) 95.6 (9.2) 94.9 (23.2) 0.040 ED Systolic Blood Pressure, mean (SD) 126.3 (9.3) 126.9 (23.2) 0.032 Glucose, mean (SD) 130.1 (19.8) 130.1 (46.9) <0.001 Potassium, mean (SD) 3.9 (0.2) 3.9 (0.6) 0.009 Anion Gap, mean (SD) 10.2 (1.6) 10.3 (3.9) 0.045 Calcium, mean (SD) 8.4 (0.5) 8.4 (1.0) 0.094 Sodium, mean (SD) 140.0 (1.5) 140.0 (3.7) 0.007 BUN, mean (SD) 14.9 (2.9) 15.1 (7.7) 0.024 Chloride, mean (SD) 108.4 (2.3) 108.2 (5.1) 0.072 Creatinine, mean (SD) 0.9 (0.2) 0.9 (0.3) 0.010 Carbon Dioxide, mean (SD) 21.3 (1.7) 21.5 (4.2) 0.040 WBC Count, mean (SD) 13.5 (2.4) 13.5 (6.6) 0.004 Red Blood Cell Count, mean (SD) 4.5 (0.3) 4.5 (0.8) 0.032 Platelet Count, mean (SD) 252.3 (31.5) 253.5 (77.6) 0.019 PTT, mean (SD) 29.1 (3.6) 29.2 (10.0) 0.003 INR, mean (SD) 1.2 (0.2) 1.2 (0.5) 0.028 Received FFP on Admission, % 4.9 4.0 0.045 Received PRBCs on Admission, % 4.7 5.3 0.028 Received Lactate Test, % 45.1 44.6 0.010 Female, % 26.4 26.4 <0.001 Hospital Transfer, % 36.6 34.8 0.038 Type of Insurance Private, % 34.4 35.4 0.022 Public, % 26.8 26.6 0.005 Not Funded, % 34.2 32.7 0.032 Other, % 4.6 5.3 0.031 Mechanism of Injury Fall, % 21.5 21.7 0.005 Vehicle, % 72.9 72.8 0.002 Assault, % 1.8 1.9 0.008 Other, % 3.8 3.6 0.011
BUN, blood urea nitrogen; ED, emergency department; FFP, fresh frozen plasma; INR, international normalized ratio; PRBC, packed red blood cell; PTT, partial thromboplastin time; RBC, red blood cell; SD, standard deviation; WBC, white blood cell.
Get Radiology Tree app to read full this article<
Get Radiology Tree app to read full this article<
Get Radiology Tree app to read full this article<
Get Radiology Tree app to read full this article<
Discussion
Get Radiology Tree app to read full this article<
Get Radiology Tree app to read full this article<
Get Radiology Tree app to read full this article<
Get Radiology Tree app to read full this article<
Get Radiology Tree app to read full this article<
Get Radiology Tree app to read full this article<
Get Radiology Tree app to read full this article<
Conclusions
Get Radiology Tree app to read full this article<
Acknowledgments
Get Radiology Tree app to read full this article<
References
1. Kocher K.E., Meurer W.J., Fazel R., et. al.: National trends in use of computed tomography in the emergency department. Ann Emerg Med 2011; 58: pp. 452-462 e3.
2. Rao V.M., Levin D.C., Parker L., et. al.: Trends in utilization rates of the various imaging modalities in emergency departments: nationwide Medicare data from 2000 to 2008. J Am Coll Radiol 2011; 8: pp. 706-709.
3. van Vugt R., Kool D.R., Deunk J., et. al.: Effects on mortality, treatment, and time management as a result of routine use of total body computed tomography in blunt high-energy trauma patients. J Trauma Acute Care Surg 2012; 72: pp. 553-559.
4. Huber-Wagner S., Lefering R., Qvick L.M., et. al.: Effect of whole-body CT during trauma resuscitation on survival: a retrospective, multicentre study. Lancet 2009; 373: pp. 1455-1461.
5. Asha S., Curtis K.A., Grant N., et. al.: Comparison of radiation exposure of trauma patients from diagnostic radiology procedures before and after the introduction of a panscan protocol. Emerg Med Australas 2012; 24: pp. 43-51.
6. Inaba K., Branco B.C., Lim G., et. al.: The increasing burden of radiation exposure in the management of trauma patients. J Trauma 2011; 70: pp. 1366-1370.
7. Salim A., Sangthong B., Martin M., et. al.: Whole body imaging in blunt multisystem trauma patients without obvious signs of injury: results of a prospective study. Arch Surg 2006; 141: pp. 468-473. discussion 73-5
8. Yeguiayan J.M., Yap A., Freysz M., et. al.: Impact of whole-body computed tomography on mortality and surgical management of severe blunt trauma. Crit Care 2012; 16: pp. R101.
9. Weninger P., Mauritz W., Fridrich P., et. al.: Emergency room management of patients with blunt major trauma: evaluation of the multislice computed tomography protocol exemplified by an urban trauma center. J Trauma 2007; 62: pp. 584-591.
10. Baker S.P., O’Neill B., Haddon W., et. al.: The injury severity score: a method for describing patients with multiple injuries and evaluating emergency care. J Trauma 1974; 14: pp. 187-196.
11. Kahloul M., Bouida W., Boubaker H., et. al.: Value of anatomic and physiologic scoring systems in outcome prediction of trauma patients. Eur J Emerg Med 2014; 21: pp. 125-129.
12. Baker S.P., O’Neill B., Haddon W., et. al.: The injury Severity Score: a method for describing patients with multiple injuries and evaluating emergency care. J Trauma 1974; 14: pp. 187-196.
13. Austin P.: An Introduction to Propensity Score Methods for Reducing the Effects of Confounding in Observational Studies. Multivariate Behav Res 2011; 46: pp. 399-424.
14. Jiang L., Ma Y., Jiang S., et. al.: Comparison of whole body computed tomography vs selective radiological imaging on outcomes in major trauma patients: a meta-analysis. Scand J Trauma Resusc Emerg Med 2014; 22: pp. 54.
15. Caputo N.D., Stahmer C., Lim G., et. al.: Whole-body computed tomographic scanning leads to better survival as opposed to selective scanning in trauma patients: a systematic review and meta-analysis. J Trauma Acute Care Surg 2014; 77: pp. 534-539.