
Rationale and Objectives
To determine if anatomically “nonmeasurable” disease in bone marrow (BM) is assessable for response to therapy by [ 18 F]-2-fluoro-2-deoxy-D-glucose (FDG) positron emission tomography (PET)/computed tomography (CT).
Materials and Methods
FDG PET/CT images of 27 patients with lymphoma, FDG-avid bone marrow (BM) lesions, and ≥1 FDG-avid, tumor-involved lymph node (LN) at baseline were retrospectively reviewed. FDG uptake in target LNs and BM foci was determined pre- and posttherapy using the standardized uptake value corrected for lean body mass (SUL mean ). Size of the same target LNs was measured pre- and posttherapy on CT. Percentage decreases of LN size and LN and BM SUL were calculated. Response was classified according to revised International Workshop Criteria (IWC) with and without modification for metabolic evaluation of BM and correlated to overall survival. Statistical analyses were performed using paired t -tests, Pearson correlation coefficients, and z-tests.
Results
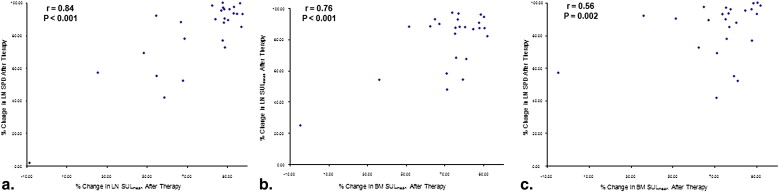
LN size, LN SUL mean , and BM SUL mean were significantly higher pre- versus posttherapy (2337 mm 2 ± 1810 vs. 309 mm 2 ± 323; 6.94 ± 4.96 vs. 1.02 ± 1.00; and 6.81 ± 4.58 to 1.84 ± 1.58, all P < .001, respectively). After therapy, significant correlation was found between percentage declines of LN size and SUL mean of LNs ( r = 0.84, P < .001) or BM ( r = 0.56, P = .002) and SUL mean of LN and BM ( r = 0.76, P < .001). Including a metabolic assessment of BM correctly altered overall response assessment in 5/27 (19%) patients and better predicted overall survival than revised IWC.
Conclusion
Anatomically “unmeasurable” BM infiltration with lymphoma behaves similarly to LN disease after therapy and is “measurable” by FDG PET/CT. FDG PET/CT is valuable for monitoring tumor response in “measurable” disease and BM, which was previously considered “unmeasurable” by anatomical imaging.
Tumor involvement of bone marrow (BM) in patients with lymphoma defines a higher stage and portends a worse prognosis. Biopsy is the current standard for diagnosing lymphomatous infiltration of BM. Sensitivity for identifying disease in BM increases 10%–20% by multiple sampling; however, even with negative bilateral biopsies, patients may subsequently prove to have BM disease .
Bone and BM lesions are considered “nonmeasurable” in therapy response criteria, which are primarily based on anatomic imaging. The terms “measurable” and “nonmeasurable” were introduced in the Response Evaluation Criteria in Solid Tumors (RECIST) approach . Per RECIST, “measurable lesions” can be accurately measured in at least one dimension with the longest diameter being ≥10 or 20 mm depending on computed tomography (CT) technique. Bone lesions and several others (eg, ascites, pleural/pericardial effusions, leptomeningeal disease, lymphangitis cutis/pulmonis, cystic lesions) are specifically considered as “truly nonmeasurable” per RECIST. Although no direct measurements of tumor burden are taken, response of “nonmeasurable” lesions is “considered” when assigning a posttreatment response classification.
Get Radiology Tree app to read full this article<
Get Radiology Tree app to read full this article<
Get Radiology Tree app to read full this article<
Materials and methods
Get Radiology Tree app to read full this article<
Patient Selection
Get Radiology Tree app to read full this article<
Table 1
Patient Characteristics (Total Group, n = 27)
Characteristics Sex (M/F) 20/7 Age (mean ± SD) 45 ± 21 years Histologies HL 9 Nodular sclerosing 7 Mixed cellularity 1 Not otherwise specified 1 NHL 18 Large B cell 16 ∗ Follicular 2 Pretherapy PET indication Initial staging 18 Restaging 9 Interval therapy Chemotherapy alone † 21 Radioimmunotherapy 4 Donor lymphocyte infusion 1 Stem cell transplant 1 Timing of posttherapy PET Mid-therapy After 2 cycles of chemotherapy 4 After 3 cycles of chemotherapy 10 After completion of therapy ‡ 13 Days between (mean ± SD) Pre- and posttherapy PET 95 ± 50 Last therapy day and posttherapy PET 31 ± 27 Last therapy day and pretherapy, restaging PET 100 ± 54
HL, Hodgkin’s lymphoma; NHL, non-Hodgkin’s lymphoma; PET, positron emission tomography.
Get Radiology Tree app to read full this article<
Get Radiology Tree app to read full this article<
Get Radiology Tree app to read full this article<
Get Radiology Tree app to read full this article<
PET/CT Imaging
Get Radiology Tree app to read full this article<
Get Radiology Tree app to read full this article<
Get Radiology Tree app to read full this article<
Image Interpretation
Get Radiology Tree app to read full this article<
Get Radiology Tree app to read full this article<
Get Radiology Tree app to read full this article<
Get Radiology Tree app to read full this article<
Get Radiology Tree app to read full this article<
Posttherapy Response Assessments
Get Radiology Tree app to read full this article<
Get Radiology Tree app to read full this article<
Statistical Analyses
Get Radiology Tree app to read full this article<
Get Radiology Tree app to read full this article<
Results
Get Radiology Tree app to read full this article<
Table 2
Lymph Node Size and Lymph Node and Bone Marrow FDG Uptake
Before Therapy After Therapy_P_ Value Lymph node ( n = 130) SPD (size, mm 2 ) 2337 ± 1810 309 ± 323 <.001 SUL mean 6.94 ± 4.96 1.02 ± 1.00 <.001 SUL max 8.74 ± 6.19 1.29 ± 1.32 <.001 Bone marrow lymphoma ( n = 91) SUL mean 6.81 ± 4.58 1.84 ± 1.58 <.001 SUL max 8.26 ± 5.2 2.16 ± 1.95 <.001 Normal bone marrow SUL mean 0.85 ± 0.33 0.93 ± 0.32 .28 SUL max 1.00 ± 0.34 1.12 ± 0.37 .37
SPD, sum of products of the diameters; SUL mean , mean standardized uptake value; SUL max , maximum standardized uptake value.
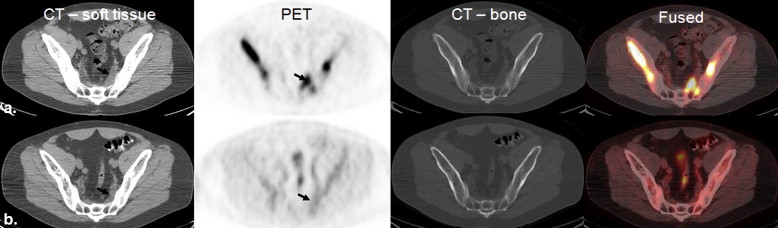
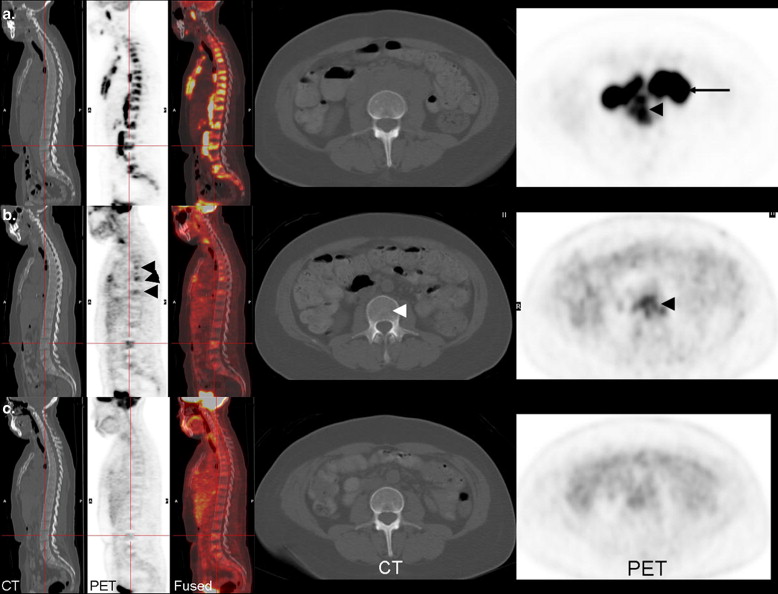
![Figure 1, (a) Lymph node involvement before and after therapy is shown on these scans (computed tomography [CT], left; positron emission tomography [PET]/CT, middle; PET, right). Before therapy, the lymph node ( arrows ) measured 28 × 16 mm and had a mean standardized uptake value (SUL mean ) of 8.11. After therapy, the lymph node ( crosshairs ) measured 16 × 8 mm and had a SUL mean of 0.72. (b) Bone marrow involvement in the sternum ( arrowheads ) is shown for the same patient (CT, left; PET/CT, middle; PET, right). Before therapy, SUL mean in the BM lesion was 6.76 and after therapy it was 0.84.](https://storage.googleapis.com/dl.dentistrykey.com/clinical/MeasuringtheUnmeasurable/0_1s20S1076633210002539.jpg)
Get Radiology Tree app to read full this article<
Get Radiology Tree app to read full this article<
Get Radiology Tree app to read full this article<
Get Radiology Tree app to read full this article<
Get Radiology Tree app to read full this article<
Get Radiology Tree app to read full this article<
Get Radiology Tree app to read full this article<
Get Radiology Tree app to read full this article<
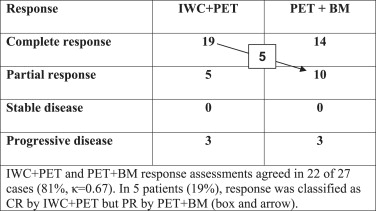
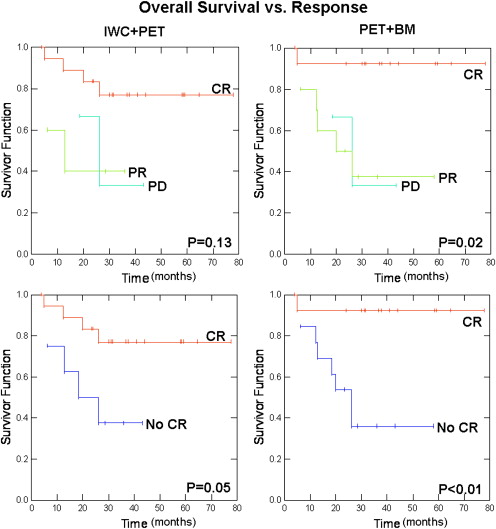
Table 3
Responses After Therapy
 Open full size image
IWC, International Workshop Criteria; PET, positron emission tomography; BM, bone marrow; CR, complete response; PR, partial response.
Get Radiology Tree app to read full this article<
Get Radiology Tree app to read full this article<
Get Radiology Tree app to read full this article<
Get Radiology Tree app to read full this article<
Discussion
Get Radiology Tree app to read full this article<
Get Radiology Tree app to read full this article<
Get Radiology Tree app to read full this article<
Get Radiology Tree app to read full this article<
Get Radiology Tree app to read full this article<
Get Radiology Tree app to read full this article<
Get Radiology Tree app to read full this article<
Get Radiology Tree app to read full this article<
Get Radiology Tree app to read full this article<
Get Radiology Tree app to read full this article<
Get Radiology Tree app to read full this article<
Get Radiology Tree app to read full this article<
Get Radiology Tree app to read full this article<
Get Radiology Tree app to read full this article<
Get Radiology Tree app to read full this article<
Get Radiology Tree app to read full this article<
Acknowledgments
Get Radiology Tree app to read full this article<
Get Radiology Tree app to read full this article<
References
1. Coller B.S., Chabner B.A., Gralnick H.R.: Frequencies and patterns of bone marrow involvement in non-Hodgkin’s lymphomas: observations on the value of bilateral biopsies. Am J Hematol 1977; 3: pp. 105-119.
2. Bitran J.D., Golomb H.M., Ultmann J.E., et. al.: Non-Hodgkin’s lymphoma, poorly differentiated lymphocytic and mixed cell types: results of sequential staging procedures, response to therapy, and survival of 100 patients. Cancer 1978; 42: pp. 88-95.
3. Therasse P., Arbuck S.G., Eisenhauer E.A., et. al.: New guidelines to evaluate the response to treatment in solid tumors. European Organization for Research and Treatment of Cancer, National Cancer Institute of the United States, National Cancer Institute of Canada. J Natl Cancer Inst 2000; 92: pp. 205-216.
4. Tatsumi M., Cohade C., Nakamoto Y., et. al.: Direct comparison of FDG PET and CT findings in patients with lymphoma: initial experience. Radiology 2005; 237: pp. 1038-1045.
5. Nakamoto Y., Cohade C., Tatsumi M., et. al.: CT appearance of bone metastases detected with FDG PET as part of the same PET/CT examination. Radiology 2005; 237: pp. 627-634.
6. Carr R., Barrington S.F., Madan B., et. al.: Detection of lymphoma in bone marrow by whole-body positron emission tomography. Blood 1998; 91: pp. 3340-3346.
7. Pakos E.E., Fotopoulos A.D., Ioannidis J.P.: 18F-FDG PET for evaluation of bone marrow infiltration in staging of lymphoma: a meta-analysis. J Nucl Med 2005; 46: pp. 958-963.
8. Park Y.H., Kim S., Choi S.J., et. al.: Clinical impact of whole-body FDG-PET for evaluation of response and therapeutic decision-making of primary lymphoma of bone. Ann Oncol 2005; 16: pp. 1401-1402.
9. Park Y.H., Choi S.J., Ryoo B.Y., Kim H.T.: PET imaging with F-18 fluorodeoxyglucose for primary lymphoma of bone. Clin Nucl Med 2005; 30: pp. 131-134.
10. Moog F., Bangerter M., Diederichs C., et. al.: Extranodal malignant lymphoma: detection with F-l8-FDG PET versus CT. Radiology 1998; 206: pp. 475-481.
11. Moog F., Bangerter M., KotzerkeI , et. al.: FDG PET as a new approach to detect lymphomatous bone marrow. J Clin Oncol 1998; 16: pp. 603-609.
12. Elstrom R., Guan L., Baker G., et. al.: Utility of FDG-PET scanning in lymphoma by WHO classification. Blood 2003; 101: pp. 3875-3876.
13. Muslimani A.A., Faraq H.L., Francis S., et. al.: The utility of 18-F-fluorodeoxyglucose positron emission tomography in evaluation of bone marrow involvement by non-Hodgkin lymphoma. Am J Clin Oncol 2008; 31: pp. 409-412.
14. Pelosi E., Pregno P., Penna D., et. al.: Role of whole-body [18F] fluorodeoxyglucose positron emission tomography/computed tomography (FDG-PET/CT) and conventional techniques in the staging of patients with Hodgkin and aggressive non Hodgkin lymphoma. Radiol Med 2008; 113: pp. 578-590.
15. Pelosi E., Penna D., Deandreis D., et. al.: FDG-PET in the detection of bone marrow disease in Hodgkin’s disease and aggressive non-Hodgkin’s lymphoma and its impact on clinical management. Q J Nucl Med Mol Imaging 2008; 52: pp. 9-16.
16. Schaefer N.G., Strobel K., Taverna C., et. al.: Bone involvement in patients with lymphoma: the role of FDG-PET/CT. Eur J Nucl Med Mol Imaging 2007; 34: pp. 60-67.
17. Kako S., Izutsu K., Ota Y., et. al.: FDG-PET in T-cell and NK-cell neoplasms. Ann Oncol 2007; 18: pp. 1685-1690.
18. Salaun P.Y., Gastinne T., Bodet-Milin C., et. al.: Analysis of 18 F-FDG PET diffuse bone marrow uptake and splenic uptake in staging of Hodgkin’s lymphoma: a reflection of disease infiltration or just inflammation?. Eur J Nucl Med Mol Imaging 2009; 36: pp. 1813-1821.
19. Cheson B.D., Horning S.J., Coiffier B., et. al.: Report of an international workshop to standardize response criteria for non-Hodgkin’s lymphomas. NCI Sponsored International Working Group. J Clin Oncol 1999; 17: pp. 1244-1253.
20. Cheson B.D., Pfistner B., Juweid M.E., et. al.: Revised response criteria for malignant lymphoma. J Clin Oncol 2007; 25: pp. 579-586.
21. Juweid M.E., Stroobants S., Hoekstra O.S., et. al.: Use of positron emission tomography for response assessment of lymphoma: consensus of the Imaging Subcommittee of International Harmonization Project in Lymphoma. J Clin Oncol 2007; 25: pp. 571-578.
22. Sugawara Y., Fisher S.J., Zasadny K.R., et. al.: Preclinical and clinical studies of bone marrow uptake of fluorine-1-fluorodeoxyglucose with or without granulocyte colony-stimulating factor during chemotherapy. J Clin Oncol 1998; 16: pp. 173-180.
23. Jacene H.A., Ishimori T., Engles J.M., et. al.: Effects of pegfilgrastim on normal biodistribution of 18F-FDG: preclinical and clinical studies. J Nucl Med 2006; 47: pp. 950-956.
24. Blodgett T.M., Ames J.T., Torok F.S., et. al.: Diffuse bone marrow uptake on whole-body F-18 fluorodeoxyglucose positron emission tomography in a patient taking recombinant erythropoietin. Clin Nucl Med 2004; 29: pp. 161-163.
25. Eisenhauer E.A., Therasse P., Bogaerts J., et. al.: New response evaluation criteria in solid tumours: revised RECIST guideline (version 1.1). Eur J Cancer 2009; 45: pp. 228-247.
26. Wahl R.L., Jacene H., Lodge M.A.: From RECIST to PERCIST: evolving Considerations for PET response criteria in solid tumors. J Nucl Med 2009; 50: 122S–50S
27. Freudenberg L.S., Antoch G., Schütt P., et. al.: FDG-PET/CT in re-staging of patients with lymphoma. Eur J Nucl Med Mol Imaging 2004; 31: pp. 325-329.
28. Naumann R., Vaic A., Beuthien-Baumann B., et. al.: Prognostic value of positron emission tomography in the evaluation of post-treatment residual mass in patients with Hodgkin’s disease and non-Hodgkin’s lymphoma. Br J Haematol 2001; 115: pp. 793-800.
29. Lin C., Itti E., Haioun C., et. al.: Early 18 F-FDG PET for prediction of prognosis in patients with diffuse large b-cell lymphoma: SUV-based assessment versus visual analysis. J Nucl Med 2007; 48: pp. 1626-1632.
30. Murata Y., Kubota K., Yukihiro M., et. al.: Correlations between 18F-FDG uptake by bone marrow and hematological parameters: measurements by PET/CT. Nucl Med Biol 2006; 33: pp. 999-1004.
31. Nahmias C., Hanna W.T., Wahl L.M., et. al.: Time course of early response to chemotherapy in non-small cell lung cancer patients with 18F-FDG PET/CT. J Nucl Med 2007; 48: pp. 744-751.
32. Kazama T., Swanston N., Podoloff D.A., et. al.: Effect of colony-stimulating factor and conventional- or high-dose chemotherapy on FDG uptake in bone marrow. Eur J Nucl Med Mol Imaging 2005; 32: pp. 1406-1411.
33. Lin E.C.: FDG PET/CT flip flop phenomenon in treated lymphoma of bone. Clin Nucl Med 2006; 31: pp. 803-805.
34. Shammas A., Lim R., Charron M.: Pediatric FDG PET/CT: physiologic uptake, normal variants, and benign conditions. Radiographics 2009; 29: pp. 1467-1486.
35. Mahmood S., Llano M.: Paget disease of the humerus mimicking metastatic disease in a patient with metastatic malignant mesothelioma on whole body F-18 FDG PET/CT. Clin Nucl Med 2008; 33: pp. 510-512.
36. Bybel B.: F-18 FDG PET/CT following dental extraction in a patient with head and neck cancer. Clin Nucl Med 2007; 32: pp. 741-742.
37. Shin D., Shon O., Han D., et. al.: The clinical efficacy of 18 F-FDG-PET/CT in benign and malignant musculoskeletal tumors. Ann Nucl Med 2008; 22: pp. 603-609.
38. Aoki J., Endo K., Watanabe H., et. al.: FDG-PET for evaluating musculoskeletal tumors. J Orthop Sci 2003; 8: pp. 435-441.
39. Feldman F., Heertum R.V., Manos C.: 18 FDG PET scanning of benign and malignant musculoskeletal lesions. Skeletal Radiol 2003; 32: pp. 201-208.
40. Mester U., Even-Sapir E.: Increased 18 F-fluorodeoxyglucose uptake in benign, nonphysiologic lesions found on whole-body positron emission tomography/computed tomography (PET/CT): accumulated data from four years of experience with PET/CT. Semin Nucl Med 2007; 37: pp. 206-222.
41. Dimitrakopoulou-Strauss A., Strauss L.G., Heichel T., et. al.: The role of quantitative 18 F-FDG PET studies for the differentiation of malignant and benign bone lesions. J Nucl Med 2002; 43: pp. 510-518.
42. Aoki J., Watanabe H., Shinozaki T., et. al.: FDG PET of primary benign and malignant bone tumors: standardized uptake value in 52 lesions. Radiology 2001; 219: pp. 774-777.
43. Grigolon MV, Delbeke D. F- 18 FDG uptake in a bone infarct: a case report. Clin Nucl Med 2001; 26:613–614.
44. Rosen R., Fayad L., Wahl R.L.: Increased 18 F-FDG uptake in degenerative disease of the spine: characterization with 18 F-FDG PET/CT. J Nucl Med 2006; 47: pp. 1274-1280.
45. A predictive model for aggressive non-Hodgkin’s lymphoma. The International Non-Hodgkin’s Lymphoma Prognostic Factors Project. N Engl J Med 1993; 329: pp. 987-994.
46. Schein P., Chabner B., Canellos G., et. al.: Non-Hodgkin’s lymphoma: patterns of relapse from complete remission after combination chemotherapy. Cancer 1975; 35: pp. 354-357.
47. Wirth A., Corry J., Laidlaw C., et. al.: Salvage radiotherapy for Hodgkin’s disease following chemotherapy failure. Int J Radiation Oncology Biol Phys 1997; 39: pp. 599-607.