
Rationale and Objectives
Photodynamic therapy (PDT) is a promising strategy for treating cancer. PDT involves three components: a photosensitizer (PS) drug, a specific wavelength of drug-activating light, and oxygen. A challenge in PDT is the unknown biodistribution of the PS in the target tissue. In this preliminary study, we report the development of a new approach to image in three dimensions the PS biodistribution in a noninvasive and fast manner.
Materials and Methods
A mesoscopic fluorescence tomography imaging platform was used to image noninvasively the biodistribution of 2-[1-hexyloxyethyl]-2 devinyl pyropheophorbide-a (HPPH) in preclinical skin cancer models. Seven tumors were imaged and optical reconstructions were compared to nonconcurrent ultrasound data.
Results
Successful imaging of the HPPH biodistribution was achieved on seven skin cancer tumors in preclinical models with a typical acquisition time of 1 minute. Two-dimensional fluorescence signals and estimated three-dimensional PS distributions were located within the lesions. However, HPPH distribution was highly heterogeneous with the tumors. Moreover, HPPH distribution volume and tumor volume as estimated by ultrasound did not match.
Conclusions
The results of this proof-of-concept study demonstrate the potential of MFMT to image rapidly the HPPH three-dimensional biodistribution in skin cancers. In addition, these preliminary data indicate that the PS biodistribution in skin cancer tumors is heterogeneous and does not match anatomical data. Mesoscopic fluorescence molecular tomography, by imaging fluorescence signals over large areas with high spatial sampling and at fast acquisition speeds, may be a new imaging modality of choice for planning and optimizing of PDT treatment.
The most common cancer treatments include surgery, radiation therapy, chemotherapy, immunotherapy, and monoclonal antibody therapy. These therapies may be used either alone or in combination with other therapies. Although improvement of these treatment modalities to enhance their tumor selectivity is under way, development of novel alternative treatment approaches that may be safer, reduce functional tissue damage, and improve patients’ quality of life is a major focus area of research. Among all new modalities investigated, photodynamic therapy (PDT) emerges as a promising alternative treatment strategy . PDT is a noninvasive treatment using a combination of a photosensitizer (PS) drug, a specific wavelength of drug-activating light and oxygen. Light activation of a PS results in energy transfer cascades that ultimately yield cytotoxic reactive oxygen species.
PDT has undergone extensive investigations in cancer treatment and various PS drugs have been approved for clinical use in the United States and other countries . PDT is being used mainly to treat skin diseases and easily accessible malignant and premalignant lesions . PDT is a local therapy with the major advantage that the PS itself is minimally toxic in the absence of light; therefore, PS accumulation in nonspecific tissues confers minimal systemic toxicity. Furthermore, light activation is performed below the maximum permissible exposure limit and at wavelengths that do not harm the tissues. Hence, PDT can be applied repeatedly should a single treatment fail. The efficacy of PDT is largely dependent on the functional state of the tissue, the PS uptake, and light fluence delivered locally. If these parameters can be controlled/assessed relatively easily in superficial lesions, it is a significant challenge for pathologies that are thick or located a few millimeters deep. In such scenarios, the PS biodistribution profile in tissue is not homogeneous, even in the case of local topical application. Second, light propagation in tissues is highly affected by the optical properties distribution in the sample. Hence, PDT efficiency can be hampered by intralesion PS heterogeneous biodistribution and light flux profiles.
Get Radiology Tree app to read full this article<
Get Radiology Tree app to read full this article<
Get Radiology Tree app to read full this article<
Get Radiology Tree app to read full this article<
Materials and methods
Preclinical Model Protocol
Get Radiology Tree app to read full this article<
Tumor Imaging
Get Radiology Tree app to read full this article<
Get Radiology Tree app to read full this article<
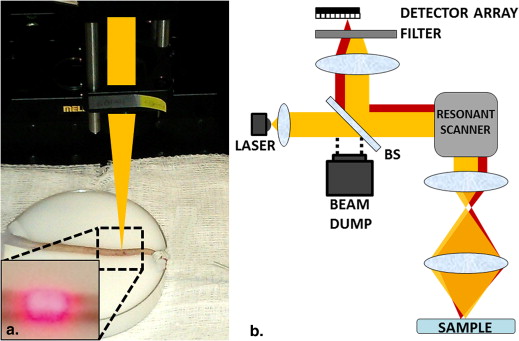
Mesoscopic Fluorescence Imaging System
Get Radiology Tree app to read full this article<
Get Radiology Tree app to read full this article<
MFMT Reconstructions
Get Radiology Tree app to read full this article<
x’=(ATA+λD)−1ATb x
’
=
(
A
T
A
+
λ
D
)
−
1
A
T
b
where b is obtained from the fluorescence measurement, x′ is the reconstructed fluorescence distribution, λD is a regularization depth-dependent parameter, and A is the whole Jacobian that is computed based by the Monte Carlo–forward model. Thanks to the symmetry of the imaging space, A is populated for all the positions of the raster-scanned beam, based on a single set of sensitivity matrices, which are computed for one optode set (one source and seven detectors). Optical properties, μ s ′ and μ a for Jacobian ( A ) matrix are chosen as 3 mm −1 and 0.002 mm −1 , respectively. Both 3D reconstruction of absorption and/or fluorescence contrast can be performed using this model . A depth-dependent regularization technique is used to mitigate the ill-posedness of the reflectance geometry. D is a diagonal matrix whose elements are the square root of the corresponding diagonal elements of A__T__A . The scaling factor (λ) for this diagonal matrix is selected based on the L-curve analysis . The conjugate gradient method is applied to solve this linear system (function cgs , MATLAB R2009b, MathWorks, Natick, MA). The iterative algorithm was stopped if 100 iterations or if a tolerance of 10 −2 was reached. Overall, the Monte Carlo–forward model and optical reconstructions were computed in less than 4 minutes for the typical 106,400 data measurements (15,200 sources positions × seven detectors) on a personal computer (Intel Core i7-3820 central processor unit, 3.6 GHz, 64 GB).
Get Radiology Tree app to read full this article<
Ultrasound Imaging
Get Radiology Tree app to read full this article<
Co-registration of US and MFMT Data Sets
Get Radiology Tree app to read full this article<
Get Radiology Tree app to read full this article<
Image Analysis
Get Radiology Tree app to read full this article<

Get Radiology Tree app to read full this article<
Results and discussion
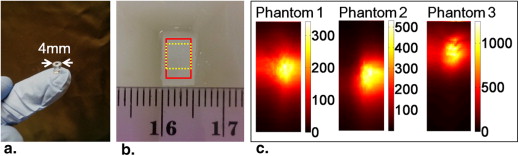
Phantom Study Results
Get Radiology Tree app to read full this article<
Get Radiology Tree app to read full this article<
Tumor Imaging Results
Get Radiology Tree app to read full this article<
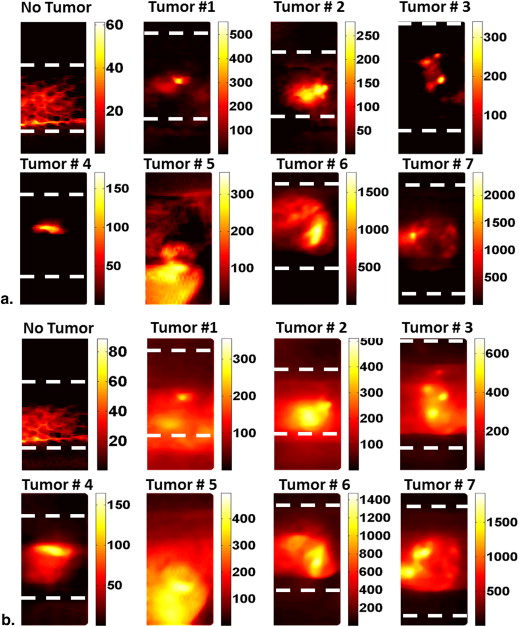
Get Radiology Tree app to read full this article<
Get Radiology Tree app to read full this article<
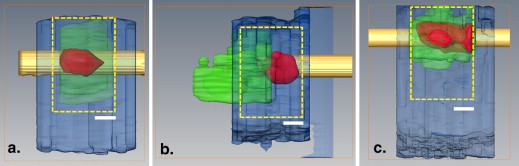
MFMT Reconstructions and US Co-registration
Get Radiology Tree app to read full this article<
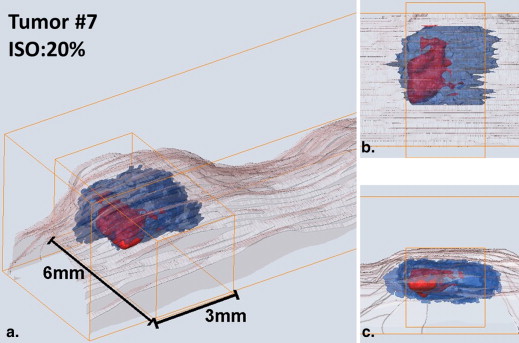

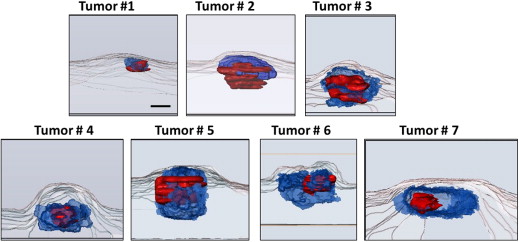
Table 1
Ultrasound and MFMT Reconstructed Tumor Volumes
Volume (mm 3 ) US 10% ISO 20% ISO 30% ISO 40% ISO Tumor 1 0.22 2.35 1.58 0.66 0.31 Tumor 2 2.8 4 1.98 1.26 0.85 Tumor 3 4.18 5.8 3.4 2 1.3 Tumor 4 4.8 3.11 1.44 0.77 0.38 Tumor 5 8.11 12 7.2 6.15 3.4 Tumor 6 9.6 11.3 5 2.16 0.6 Tumor 7 10 6.7 4.4 2.6 1.5
ISO, isosurface value for MFMT reconstruction.
Get Radiology Tree app to read full this article<
Discussion
Get Radiology Tree app to read full this article<
Get Radiology Tree app to read full this article<
Get Radiology Tree app to read full this article<
Conclusions
Get Radiology Tree app to read full this article<
Acknowledgments
Get Radiology Tree app to read full this article<
References
1. Dolmans D.E., Fukumura D., Jain R.K.: Photodynamic therapy for cancer. Nat Rev Cancer 2003; 3: pp. 380-387.
2. Ormond A., Freeman H.: Dye sensitizers for photodynamic therapy. Materials (Basel) 2013; 6: pp. 817-840.
3. Tian Y.Y., Wang L.L., Wang W.: Progress in photodynamic therapy on tumors. Laser Phys 2008; 18: pp. 1119-1123.
4. Morton C.A., Szeimies R.M., Sidoroff A., et. al.: European guidelines for topical photodynamic therapy part 1: treatment delivery and current indications - actinic keratoses, Bowen’s disease, basal cell carcinoma. J Eur Acad Dermatol Venereol 2013; 27: pp. 536-544.
5. Green B., Cobb A.R., Hopper C.: Photodynamic therapy in the management of lesions of the head and neck. Br J Oral Maxillofac Surg 2013; 51: pp. 283-287.
6. Kaščáková S., Kruijt B., de Bruijn H.S., et. al.: Ex vivo quantification of mTHPC concentration in tissue: Influence of chemical extraction on the optical properties. J Photochem Photobiol B Biol 2008; 91: pp. 99-107.
7. Mo W., Rohrbach D., Sunar U.: Imaging a photodynamic therapy photosensitizer in vivo with a time-gated fluorescence tomography system. J Biomed Opt 2012; 17: pp. 71306.
8. Muffoletto D., Gupta A., Xu Z., et. al.: Imaging of a targeted PDT drug with fluorescence tomography. Proc SPIE 2009; 7164: 716409–716409
9. Kepshire D., Davis S.C., Dehghani H., et. al.: Fluorescence tomography characterization for sub-surface imaging with protoporphyrin IX. Opt Express 2008; 16: pp. 8581-8593.
10. Cauchon N., Turcotte E., Lecomte R., et. al.: Predicting efficacy of photodynamic therapy by real-time FDG-PET in a mouse tumour model. Photochem Photobiol Sci 2012; 11: pp. 364-370.
11. Celli J.P., Spring B.Q., Rizvi I., et. al.: Imaging and photodynamic therapy: mechanisms, monitoring, and optimization. Chem Rev 2010; 110: pp. 2795-2838.
12. Doiron DR, Gomer CJ. Porphyrin Localization and Treatment of Tumors. Proceedings of the Clayton Foundation International Symposium on Porphyrin Localization and Treatment of Tumors, Santa Barbara, CA, April 24-28, 1983. New York: A.R. Liss, 1984.
13. Sunar U., Rohrbach D.J., Morgan J., et. al.: Quantification of PpIX concentration in basal cell carcinoma and squamous cell carcinoma models using spatial frequency domain imaging. Biomed Opt Express 2013; 4: pp. 531-537.
14. Wilson B.C., Andersson-Engels S.: In vivo fluorescence in clinical oncology: fundamental and practical issues. J Cell Pharmacol 1991; 3: pp. 48-61.
15. Balas C.: Review of biomedical optical imaging—a powerful, non-invasive, non-ionizing technology for improving in vivo diagnosis. Meas Sci Technol 2009; 20: pp. 104020.
16. Pogue B.W., Burke G.: Fiber-optic bundle design for quantitative fluorescence measurement from tissue. Appl Opt 1998; 37: pp. 7429-7436.
17. Lee C.C., Pogue B.W., O’Hara J.A., et. al.: Spatial heterogeneity and temporal kinetics of photosensitizer (AlPcS2) concentration in murine tumors RIF-1 and MTG-B. Photochem Photobiol Sci 2003; 2: pp. 145.
18. De Rosa F.S., Marchetti J.M., Thomazini J.A., et. al.: A vehicle for photodynamic therapy of skin cancer: influence of dimethylsulphoxide on 5-aminolevulinic acid in vitro cutaneous permeation and in vivo protoporphyrin {IX} accumulation determined by confocal microscopy. J Control Release 2000; 65: pp. 359-366.
19. König K.: Multiphoton microscopy in life sciences. J Microsc 2000; 200: pp. 83-104.
20. Zhao L., Lee V.K., Yoo S.S., et. al.: The integration of 3-D cell printing and mesoscopic fluorescence molecular tomography of vascular constructs within thick hydrogel scaffolds. Biomaterials 2012; 33: pp. 5325-5332.
21. Yuan S., Li Q., Jiang J., et. al.: Three-dimensional coregistered optical coherence tomography and line-scanning fluorescence laminar optical tomography. Opt Lett 2009; 34: pp. 1615-1617.
22. Muldoon T.J., Burgess S.A., Chen B.R., et. al.: Analysis of skin lesions using laminar optical tomography. Biomed Opt Express 2012; 3: pp. 1701-1712.
23. Ozturk M.S., Lee V.K., Zhao L., et. al.: Mesoscopic fluorescence molecular tomography of reporter genes in bioprinted thick tissue. J Biomed Opt 2013; 18: pp. 100501.
24. Dreier J., Felderer L., Barysch M., et. al.: Basal cell carcinoma: a paradigm for targeted therapies. Expert Opin Pharmacother 2013; 14: pp. 1307-1318.
25. Allison R.R., Downie G.H., Cuenca R., et. al.: Photosensitizers in clinical PDT. Photodiagnosis Photodyn Ther 2004; 1: pp. 27-42.
26. Schmitt J.M., Kumar G.: Optical scattering properties of soft tissue: a discrete particle model. Appl Opt 1998; 37: pp. 2788-2797.
27. Li H., Tian J., Zhu F., et. al.: A mouse optical simulation environment (MOSE) to investigate bioluminescent phenomena in the living mouse with the Monte Carlo method. Acad Radiol 2004; 11: pp. 1029-1038.
28. Dunn A., Boas D.: Transport-based image reconstruction in turbid media with small source-detector separations. Opt Lett 2000; 25: pp. 1777-1779.
29. Björn S., Ntziachristos V., Schulz R.: Mesoscopic epifluorescence tomography: reconstruction of superficial and deep fluorescence in highly-scattering media. Opt Express 2010; 18: pp. 8422-8429.
30. Yuan B., Burgess S.A., Iranmahboob A., et. al.: A system for high-resolution depth-resolved optical imaging of fluorescence and absorption contrast. Rev Sci Instrum 2009; 80: pp. 043706.
31. Chen J., Intes X.: Comparison of Monte Carlo methods for fluorescence molecular tomography-computational efficiency. Med Phys 2011; 38: pp. 5788-5798.
32. Intes X., Ripoll J., Chen Y., et. al.: In vivo continuous-wave optical breast imaging enhanced with Indocyanine Green. Med Phys 2003; 30: pp. 1039.
33. Flynn BP, D’Souza AV, Kanick SC, et al. Subsurface PpIX imaging in vivo with ultrasound-guided tomographic spectroscopy: reconstruction vs. born-normalized data. 2013; 8568:856807–856809.
34. Rohrbach D.J., Rigual N., Tracy E., et. al.: Interlesion differences in the local photodynamic therapy response of oral cavity lesions assessed by diffuse optical spectroscopies. Biomed Opt Express 2012; 3: pp. 2142-2153.
35. Saager R.B., Cuccia D.J., Saggese S., et. al.: Quantitative fluorescence imaging of protoporphyrin IX through determination of tissue optical properties in the spatial frequency domain. J Biomed Opt 2011; 16: pp. 126013.
36. Konecky S.D., Mazhar A., Cuccia D., et. al.: Quantitative optical tomography of sub-surface heterogeneities using spatially modulated structured light. Opt Express 2009; 17: pp. 14780-14790.