
Rationale and Objectives
We sought to ( ) describe associations between measures of tumor perfusion by dynamic contrast-enhanced breast magnetic resonance imaging (DCE-MRI), blood flow by 15 O-water positron emission tomography (PET) and metabolism by 18 F-fluorodeoxyglucose ( 18 F)-FDG PET and ( ) improve our understanding of tumor enhancement on MRI through independent measures of tumor metabolism and blood flow.
Materials and Methods
We performed a retrospective analysis of the existing PET and MRI databases from the Departments of Nuclear Medicine and Radiology. We identified patients with locally advanced breast cancer who underwent 15 O-water/ 18 F-FDG PET within 1 month of clinical DCE-MRI between February 2004 and August 2006. The 15 O-water PET blood flow and 18 F-FDG metabolic rate and tissue transport constant ( K 1 ) in the primary malignancy were calculated. DCE-MRI peak percent enhancement and peak signal enhancement ratio (SER) were measured for each tumor. Correlations and regression analysis of these variables were performed.
Results
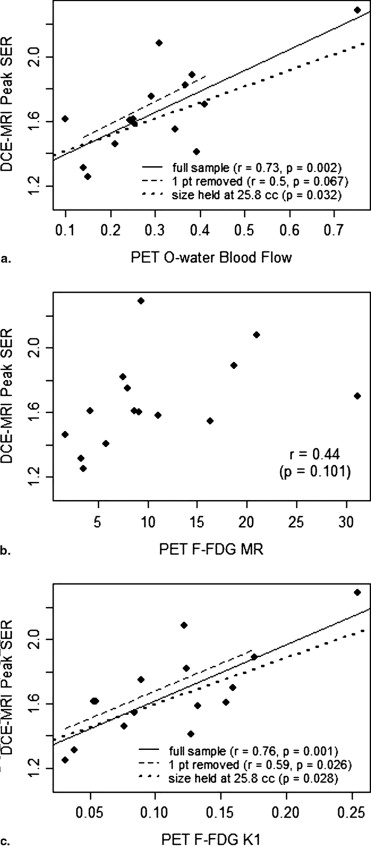
Fifteen patients with complete PET and DCE-MRI data were included in the analysis cohort. Peak SER correlated significantly with blood flow ( r = 0.73, P = .002) and K 1 ( r = 0.76, P = .001). However, peak SER did not correlate significantly with FDG metabolic rate ( r = 0.44, P = .101). There were no significant correlations between peak percent enhancement and any of the PET parameters.
Conclusions
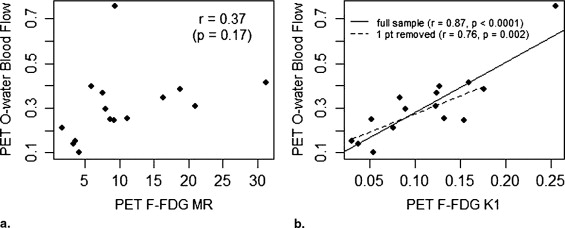
Our findings suggest that tumor perfusion, represented by 15 O-water PET blood flow, is an important factor in the MRI enhancement of locally advanced breast cancer. A lack of correlation of FDG metabolic rate with blood flow and DCE-MRI kinetics suggests that 18 F-FDG PET provides complementary metabolic information independent of vascular factors.
Locally advanced breast cancer (LABC) is most frequently treated by neoadjuvant systemic therapy prior to definitive surgical resection. Dynamic contrast-enhanced breast magnetic resonance imaging (DCE-MRI) and positron emission tomography (PET) have been used to evaluate response to traditional cytotoxic neoadjuvant chemotherapy ( ). In addition, there is growing interest in targeted breast cancer therapy, such as antiangiogenic agents, for which noninvasive imaging may be particularly advantageous for response evaluation ( ).
Prior studies have examined DCE-MRI and PET functional studies independently. DCE-MRI defines the extent of breast cancer in vivo more accurately than any other imaging modality ( ). In addition, DCE-MRI data can provide measurements of tumor volume and enhancement kinetics. Changes in tumor volume following neoadjuvant therapy, as measured using DCE-MRI, are predictive of recurrence-free survival ( ). Measurements of tumor enhancement, including semiquantitative parameters such as initial percent enhancement (PE) and delayed signal enhancement ratio (SER), have been shown to be helpful and accurate for tumor detection and response evaluation ( ). Tumor enhancement likely reflects a combination of blood flow and capillary permeability ( ). However, the precise biologic factors underlying enhancement and the relative contributions of blood flow and capillary permeability are not completely understood.
Get Radiology Tree app to read full this article<
Get Radiology Tree app to read full this article<
Get Radiology Tree app to read full this article<
Materials and Methods
Case/Patient Selection
Get Radiology Tree app to read full this article<
MRI Acquisition Protocols
Get Radiology Tree app to read full this article<
Get Radiology Tree app to read full this article<
MRI Image Analysis
Get Radiology Tree app to read full this article<
PE=S1−S0S0×100% P
E
=
S
1
−
S
0
S
0
×
100
%
Get Radiology Tree app to read full this article<
Get Radiology Tree app to read full this article<
SER=S1−S0S2−S0 S
E
R
=
S
1
−
S
0
S
2
−
S
0
where S 2 is the value of the post-contrast sequence centered at 270 seconds. SER values model the shape of the enhancement curve for each voxel with SER >1.1 indicating washout, SER between 1.1 and 0.9 indicating plateau enhancement, and SER <0.9 indicating persistent enhancement. SER was previously shown to reflect both microvessel density and tumor grade ( ).
Get Radiology Tree app to read full this article<
Get Radiology Tree app to read full this article<
PET Acquisition Protocol
Get Radiology Tree app to read full this article<
Get Radiology Tree app to read full this article<
PET Imaging Analysis
Get Radiology Tree app to read full this article<
Kinetic Models
Get Radiology Tree app to read full this article<
Get Radiology Tree app to read full this article<
FDG metabolic rate =[Glucose]∗Ki FDG metabolic rate =
[
Glucose
]
∗
K
i
where [Glucose] is the plasma glucose concentration (micromoles per millier) at the time of FDG PET. We have previously examined the relationship between FDG K 1 and FDG metabolic rate and blood flow measured by 15 O-water PET and to response to therapy ( ).
Get Radiology Tree app to read full this article<
Statistical Analysis
Get Radiology Tree app to read full this article<
Results
Get Radiology Tree app to read full this article<
Get Radiology Tree app to read full this article<
Get Radiology Tree app to read full this article<
Get Radiology Tree app to read full this article<
Get Radiology Tree app to read full this article<
Table 1
Correlations Between PET and DCE-MRI Variables
DCE-MRI Variable 15 O-Water PET Blood Flow 18 F-FDG PET Metabolic Rate 18 F-FDG PET K 1 Peak SER_r_ = 0.73 ( P = .002)r = 0.44 ( P = .10)r = 0.76 ( P = .001) Peak PE_r_ = 0.28 ( P = .30)r = 0.15 ( P = .59)r = 0.30 ( P = .28)
DCE: dynamic contrast-enhanced; 18 F-FDG: 18 F-fluorodeoxyglucose; K 1 : tissue transport constant; MRI: magnetic resonance imaging; PE: percent enhancement; PET: positron emission tomography; SER: signal enhancement ratio.
Get Radiology Tree app to read full this article<
Get Radiology Tree app to read full this article<
Get Radiology Tree app to read full this article<
Get Radiology Tree app to read full this article<
Discussion
Get Radiology Tree app to read full this article<
Get Radiology Tree app to read full this article<
Get Radiology Tree app to read full this article<
Get Radiology Tree app to read full this article<
Get Radiology Tree app to read full this article<
Limitations
Get Radiology Tree app to read full this article<
Get Radiology Tree app to read full this article<
Get Radiology Tree app to read full this article<
Conclusions
Get Radiology Tree app to read full this article<
Get Radiology Tree app to read full this article<
References
1. Chen J.H., Feig B., Agrawal G., et. al.: MRI evaluation of pathologically complete response and residual tumors in breast cancer after neoadjuvant chemotherapy. Cancer 2007; 112: pp. 17-26.
2. Chen X., Moore M.O., Lehman C.D., et. al.: Combined use of MRI and PET to monitor response and assess residual disease for locally advanced breast cancer treated with neoadjuvant chemotherapy. Acad Radiol 2004; 11: pp. 1115-1124.
3. Daldrup-Link H.E., Okuhata Y., Wolfe A., et. al.: Decrease in tumor apparent permeability-surface area product to a MRI macromolecular contrast medium following angiogenesis inhibition with correlations to cytotoxic drug accumulation. Microcirculation 2004; 11: pp. 387-396.
4. Jansson T., Westlin J.E., Ahlstrom H., Lilja A., Langstrom B., Bergh J.: Positron emission tomography studies in patients with locally advanced and/or metastatic breast cancer: A method for early therapy evaluation?. J Clin Oncol 1995; 13: pp. 1470-1477.
5. Mankoff D.A., Dunnwald L.K., Gralow J.R., et. al.: Blood flow and metabolism in locally advanced breast cancer: Relationship to response to therapy. J Nucl Med 2002; 43: pp. 500-509.
6. Mankoff D.A., Dunnwald L.K., Gralow J.R., et. al.: Changes in blood flow and metabolism in locally advanced breast cancer treated with neoadjuvant chemotherapy. J Nucl Med 2003; 44: pp. 1806-1814.
7. Martincich L., Montemurro F., De Rosa G., et. al.: Monitoring response to primary chemotherapy in breast cancer using dynamic contrast-enhanced magnetic resonance imaging. Breast Cancer Res Treat 2004; 83: pp. 67-76.
8. Partridge S.C., Gibbs J.E., Lu Y., et. al.: MRI measurements of breast tumor volume predict response to neoadjuvant chemotherapy and recurrence-free survival. AJR Am J Roentgenol 2005; 184: pp. 1774-1781.
9. Semple S.I., Gilbert F.J., Redpath T.W., et. al.: Correlation of MRI/PET rim enhancement in breast cancer: A delivery related phenomenon with therapy implications?. Lancet Oncol 2003; 4: pp. 759.
10. Semple S.I., Staff R.T., Heys S.D., et. al.: Baseline MRI delivery characteristics predict change in invasive ductal breast carcinoma PET metabolism as a result of primary chemotherapy administration. Ann Oncol 2006; 17: pp. 1393-1398.
11. Tseng J., Dunnwald L.K., Schubert E.K., et. al.: 18F-FDG kinetics in locally advanced breast cancer: Correlation with tumor blood flow and changes in response to neoadjuvant chemotherapy. J Nucl Med 2004; 45: pp. 1829-1837.
12. Wahl R.L., Zasadny K., Helvie M., Hutchins G.D., Weber B., Cody R.: Metabolic monitoring of breast cancer chemohormonotherapy using positron emission tomography: Initial evaluation. J Clin Oncol 1993; 11: pp. 2101-2111.
13. Wasser K., Klein S.K., Fink C., et. al.: Evaluation of neoadjuvant chemotherapeutic response of breast cancer using dynamic MRI with high temporal resolution. Eur Radiol 2003; 13: pp. 80-87.
14. Yu H.J., Chen J.H., Mehta R.S., Nalcioglu O., Su M.Y.: MRI measurements of tumor size and pharmacokinetic parameters as early predictors of response in breast cancer patients undergoing neoadjuvant anthracycline chemotherapy. J Magn Reson Imaging 2007; 26: pp. 615-623.
15. Pham C.D., Roberts T.P., van Bruggen N., et. al.: Magnetic resonance imaging detects suppression of tumor vascular permeability after administration of antibody to vascular endothelial growth factor. Cancer Invest 1998; 16: pp. 225-230.
16. Wedam S.B., Low J.A., Yang S.X., et. al.: Antiangiogenic and antitumor effects of bevacizumab in patients with inflammatory and locally advanced breast cancer. J Clin Oncol 2006; 24: pp. 769-777.
17. Wilmes L.J., Pallavicini M.G., Fleming L.M., et. al.: AG-013736, a novel inhibitor of VEGF receptor tyrosine kinases, inhibits breast cancer growth and decreases vascular permeability as detected by dynamic contrast-enhanced magnetic resonance imaging. Magn Reson Imaging 2007; 25: pp. 319-327.
18. Berg W.A., Gutierrez L., NessAiver M.S., et. al.: Diagnostic accuracy of mammography, clinical examination, US, and metabolic rate imaging in preoperative assessment of breast cancer. Radiology 2004; 233: pp. 830-849.
19. Bone B., Szabo B.K., Perbeck L.G., Veress B., Aspelin P.: Can contrast-enhanced metabolic rate imaging predict survival in breast cancer?. Acta Radiol 2003; 44: pp. 373-378.
20. Esserman L., Hylton N., George T., Weidner N.: Contrast-enhanced magnetic resonance imaging to assess tumor histopathology and angiogenesis in breast carcinoma. Breast J 1999; 5: pp. 13-21.
21. Hylton N.M.: Vascularity assessment of breast lesions with gadolinium-enhanced metabolic rate imaging. Magn Reson Imaging Clin N Am 1999; 7: pp. 411-420. , x
22. Knopp M.V., Brix G., Junkermann H.J., Sinn H.P.: metabolic rate mammography with pharmacokinetic mapping for monitoring of breast cancer treatment during neoadjuvant therapy. Magn Reson Imaging Clin N Am 1994; 2: pp. 633-658.
23. Kuhl C.K., Mielcareck P., Klaschik S., et. al.: Dynamic breast metabolic rate imaging: Are signal intensity time course data useful for differential diagnosis of enhancing lesions?. Radiology 1999; 211: pp. 101-110.
24. Li K.L., Henry R.G., Wilmes L.J., et. al.: Kinetic assessment of breast tumors using high spatial resolution signal enhancement ratio (SER) imaging. Magn Reson Med 2007; 58: pp. 572-581.
25. Padhani A.R., Hayes C., Assersohn L., et. al.: Prediction of clinicopathologic response of breast cancer to primary chemotherapy at contrast-enhanced metabolic rate imaging: Initial clinical results. Radiology 2006; 239: pp. 361-374.
26. Shames D.M., Kuwatsuru R., Vexler V., Muhler A., Brasch R.C.: Measurement of capillary permeability to macromolecules by dynamic magnetic resonance imaging: A quantitative noninvasive technique. Magn Reson Med 1993; 29: pp. 616-622.
27. Knopp M.V., Weiss E., Sinn H.P., et. al.: Pathophysiologic basis of contrast enhancement in breast tumors. J Magn Reson Imaging 1999; 10: pp. 260-266.
28. Schelling M., Avril N., Nahrig J., et. al.: Positron emission tomography using [(18)F]fluorodeoxyglucose for monitoring primary chemotherapy in breast cancer. J Clin Oncol 2000; 18: pp. 1689-1695.
29. Smith I.C., Welch A.E., Hutcheon A.W., et. al.: Positron emission tomography using [(18)F]-fluorodeoxy-D-glucose to predict the pathologic response of breast cancer to primary chemotherapy. J Clin Oncol 2000; 18: pp. 1676-1688.
30. Wilson C.B., Lammertsma A.A., McKenzie C.G., Sikora K., Jones T.: Measurements of blood flow and exchanging water space in breast tumors using positron emission tomography: A rapid and noninvasive dynamic method. Cancer Res 1992; 52: pp. 1592-1597.
31. Beaney R.P., Lammertsma A.A., Jones T., McKenzie C.G., Halnan K.E.: Positron emission tomography for in-vivo measurement of regional blood flow, oxygen utilisation, and blood volume in patients with breast carcinoma. Lancet 1984; 1: pp. 131-134.
32. Zasadny K.R., Tatsumi M., Wahl R.L.: FDG metabolism and uptake versus blood flow in women with untreated primary breast cancers. Eur J Nucl Med Mol Imaging 2003; 30: pp. 274-280.
33. Goerres G.W., Michel S.C., Fehr M.K., et. al.: Follow-up of women with breast cancer: Comparison between MRI and FDG PET. Eur Radiol 2003; 13: pp. 1635-1644.
34. Muramoto S., Uematsu H., Sadato N., et. al.: H(2) (15)0 positron emission tomography validation of semiquantitative prostate blood flow determined by double-echo dynamic MRI: A preliminary study. J Comput Assist Tomogr 2002; 26: pp. 510-514.
35. Sakuma H., Koskenvuo J.W., Niemi P., et. al.: Assessment of coronary flow reserve using fast velocity-encoded cine metabolic rate imaging: Validation study using positron emission tomography. AJR Am J Roentgenol 2000; 175: pp. 1029-1033.
36. Ye F.Q., Berman K.F., Ellmore T., et. al.: H(2)(15)O PET validation of steady-state arterial spin tagging cerebral blood flow measurements in humans. Magn Reson Med 2000; 44: pp. 450-456.
37. Partridge S.C., Heumann E.J., Hylton N.M.: Semi-automated analysis for MRI of breast tumors. Stud Health Technol Inform 1999; 62: pp. 259-260.
38. Sokoloff L., Reivich M., Kennedy C., et. al.: The [14C]deoxyglucose method for the measurement of local cerebral glucose utilization: Theory, procedure, and normal values in the conscious and anesthetized albino rat. J Neurochem 1977; 28: pp. 897-916.
39. Phelps M.E., Huang S.C., Hoffman E.J., Selin C., Sokoloff L., Kuhl D.E.: Tomographic measurement of local cerebral glucose metabolic rate in humans with (F-18)2-fluoro-2-deoxy-D-glucose: Validation of method. Ann Neurol 1979; 6: pp. 371-388.
40. Reivich M., Alavi A., Wolf A., et. al.: Glucose metabolic rate kinetic model parameter determination in humans: The lumped constants and rate constants for [18F]fluorodeoxyglucose and [11C]deoxyglucose. J Cereb Blood Flow Metab 1985; 5: pp. 179-192.
41. Reivich M., Kuhl D., Wolf A., et. al.: The [18F]fluorodeoxyglucose method for the measurement of local cerebral glucose utilization in man. Circ Res 1979; 44: pp. 127-137.
42. Su H., Bodenstein C., Dumont R.A., et. al.: Monitoring tumor glucose utilization by positron emission tomography for the prediction of treatment response to epidermal growth factor receptor kinase inhibitors. Clin Cancer Res 2006; 12: pp. 5659-5667.
43. Brix G., Henze M., Knopp M.V., et. al.: Comparison of pharmacokinetic MRI and [18F] fluorodeoxyglucose PET in the diagnosis of breast cancer: Initial experience. Eur Radiol 2001; 11: pp. 2058-2070.
44. Alger J.R., Frank J.A., Bizzi A., et. al.: Metabolism of human gliomas: Assessment with H-1 metabolic rate spectroscopy and F-18 fluorodeoxyglucose PET. Radiology 1990; 177: pp. 633-641.
45. Luyten P.R., Marien A.J., Heindel W., et. al.: Metabolic imaging of patients with intracranial tumors: H-1 metabolic rate spectroscopic imaging and PET. Radiology 1990; 176: pp. 791-799.
46. Brix G., Kiessling F., Lucht R., et. al.: Microcirculation and microvasculature in breast tumors: Pharmacokinetic analysis of dynamic metabolic rate image series. Magn Reson Med 2004; 52: pp. 420-429.
47. Hayes C., Padhani A.R., Leach M.O.: Assessing changes in tumour vascular function using dynamic contrast-enhanced magnetic resonance imaging. NMR Biomed 2002; 15: pp. 154-163.
48. Pickles M.D., Lowry M., Manton D.J., Gibbs P., Turnbull L.W.: Role of dynamic contrast enhanced MRI in monitoring early response of locally advanced breast cancer to neoadjuvant chemotherapy. Breast Cancer Res Treat 2005; 91: pp. 1-10.
49. Thukral A., Thomasson D.M., Chow C.K., et. al.: Inflammatory breast cancer: Dynamic contrast-enhanced metabolic rate in patients receiving bevacizumab—Initial experience. Radiology 2007; 244: pp. 727-735.